Dallas Fed Energy Survey

Oil and Gas Activity Expands Strongly; Outlook Improves Dramatically
Special questions this quarter include an annual update on breakeven prices by basin, expected changes in employee head counts for 2021, expectations for changes in service pricing this year and the impact of changing federal regulation on profitability.
Activity in the oil and gas sector expanded strongly in first quarter 2021, according to oil and gas executives responding to the Dallas Fed Energy Survey. The business activity index—the survey’s broadest measure of conditions facing Eleventh District energy firms—soared from 18.5 in the fourth quarter to 53.6 in first quarter 2021, reaching its highest reading in the survey’s five-year history. Exploration and production (E&P) and oilfield services firms both experienced a strong expansion in activity.
Oil and gas production increased, according to E&P executives. The oil production index rose from 1.0 in the fourth quarter to 16.3 in the first quarter. Likewise, the natural gas production index turned positive and increased 18 points to 15.9.
The index for capital expenditures increased from 12.5 to 31.0, indicating an acceleration in capital spending among E&P firms. Additionally, the index for the expected level of capital expenditures next year came in at 49.5, signaling firms have increased their capital spending plans for 2022.
Oilfield services firms reported improvement in all indicators. The equipment utilization index surged, jumping 57 points to 63.2 in the first quarter. Operating margins improved, with the index moving into positive territory—increasing from -31.9 to 14.0. The index of prices received for services also turned positive, jumping from -29.7 to 20.0. However, the index for input costs also rose notably—from -4.3 to 36.0—suggesting mounting cost pressures.
After seven consecutive negative readings that indicated contracting payrolls, the aggregate employment index turned positive, rising from -11.7 to 8.4. Employment growth was driven primarily by oilfield services firms. The employment index was 23.5 for services firms versus 1.0 for E&P firms. The employee hours index moved into positive territory, rising from -6.9 to 22.8. The aggregate wages and benefits index also turned positive—from -12.4 to 14.8.
Six-month outlooks improved notably, with the index rising from 21.6 last quarter to 70.6—the highest reading in the survey’s five-year history. Additionally, firms noted less uncertainty around their outlook this quarter than last; the aggregate uncertainty index fell eight points to -22.2. This is the lowest reading for the uncertainty index since its inception in first quarter 2017.
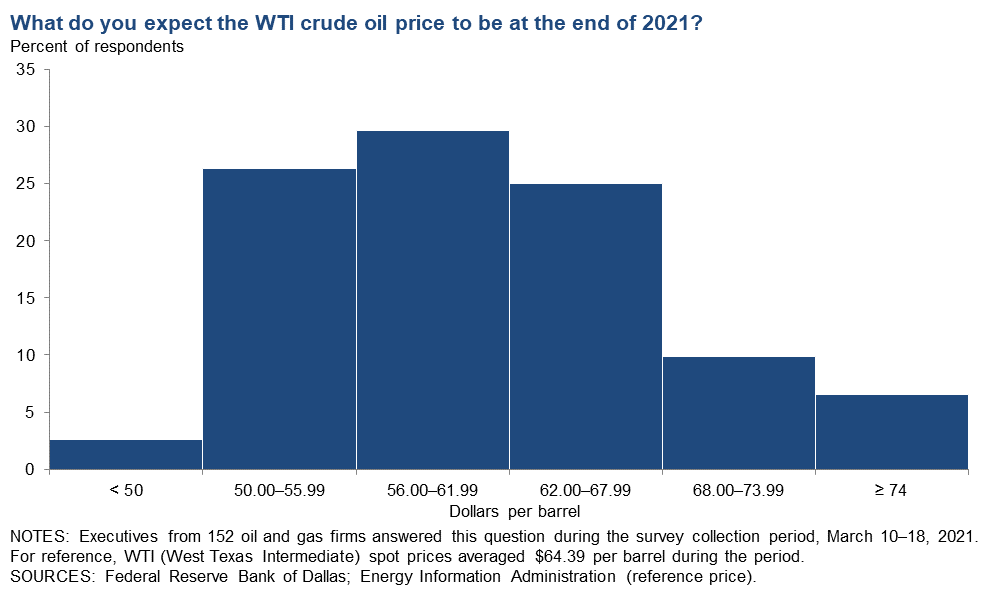
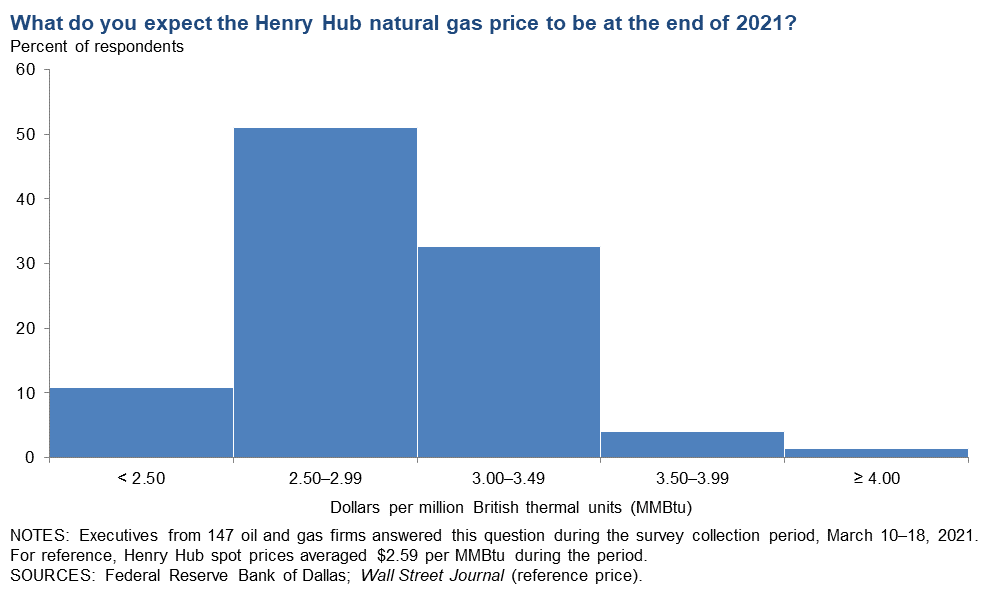
On average, respondents expect a West Texas Intermediate (WTI) oil price of $61 per barrel by year-end 2021; responses ranged from $45 to $85 per barrel. Survey participants expect Henry Hub natural gas prices of $2.80 per million British thermal units (MMBtu) at year-end. For reference, WTI spot prices averaged $64 per barrel during the survey collection period, and Henry Hub spot prices averaged $2.59 per MMBtu.
Next release: June 23, 2021
Data were collected March 10–18, and 155 energy firms responded. Of the respondents, 104 were exploration and production firms and 51 were oilfield services firms.
The Dallas Fed conducts the Dallas Fed Energy Survey quarterly to obtain a timely assessment of energy activity among oil and gas firms located or headquartered in the Eleventh District. Firms are asked whether business activity, employment, capital expenditures and other indicators increased, decreased or remained unchanged compared with the prior quarter and with the same quarter a year ago. Survey responses are used to calculate an index for each indicator. Each index is calculated by subtracting the percentage of respondents reporting a decrease from the percentage reporting an increase. When the share of firms reporting an increase exceeds the share reporting a decrease, the index will be greater than zero, suggesting the indicator has increased over the previous quarter. If the share of firms reporting a decrease exceeds the share reporting an increase, the index will be below zero, suggesting the indicator has decreased over the previous quarter.
Price Forecasts
West Texas Intermediate Crude
| West Texas Intermediate crude oil price (dollars per barrel), year-end 2022 | ||||
| Indicator | Survey Average | Low Forecast | High Forecast | Price During Survey |
Current quarter | $61.13 | $45.00 | $85.00 | $64.39 |
Prior quarter | $49.77 | $35.00 | $70.00 | $47.09 |
| NOTE: Price during survey is an average of daily spot prices during the survey collection period. SOURCES: Energy Information Administration; Federal Reserve Bank of Dallas. | ||||
Henry Hub Natural Gas
| Henry Hub natural gas price (dollars per MMBtu), year-end 2022 | ||||
| Indicator | Survey Average | Low Forecast | High Forecast | Price During Survey |
Current quarter | $2.80 | $2.00 | $4.00 | $2.59 |
Prior quarter | $2.76 | $1.75 | $4.70 | $2.60 |
| NOTE: Price during survey is an average of daily spot prices during the survey collection period. SOURCES: Federal Reserve Bank of Dallas; Wall Street Journal. | ||||
Special Questions
Data were collected March 10–18; 151 oil and gas firms responded to the special questions survey.
Exploration and Production (E&P) Firms
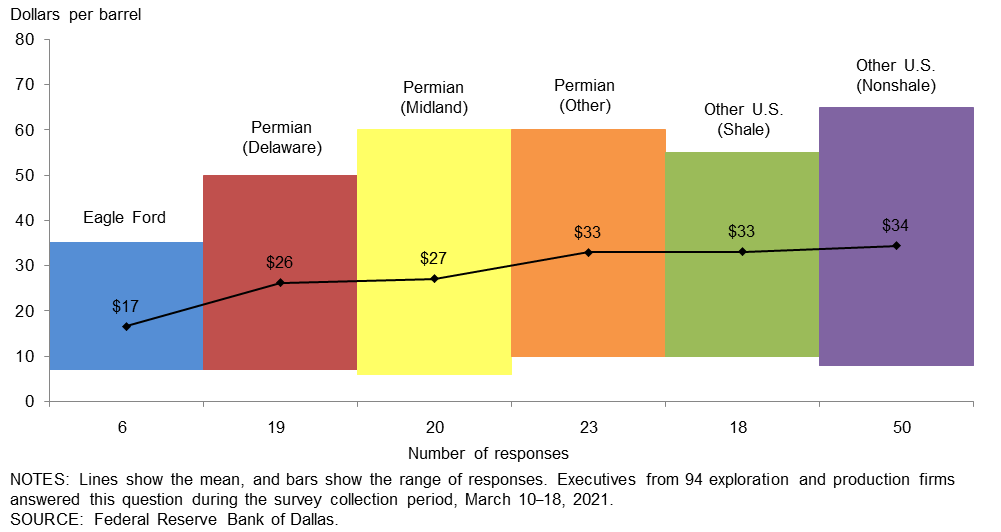
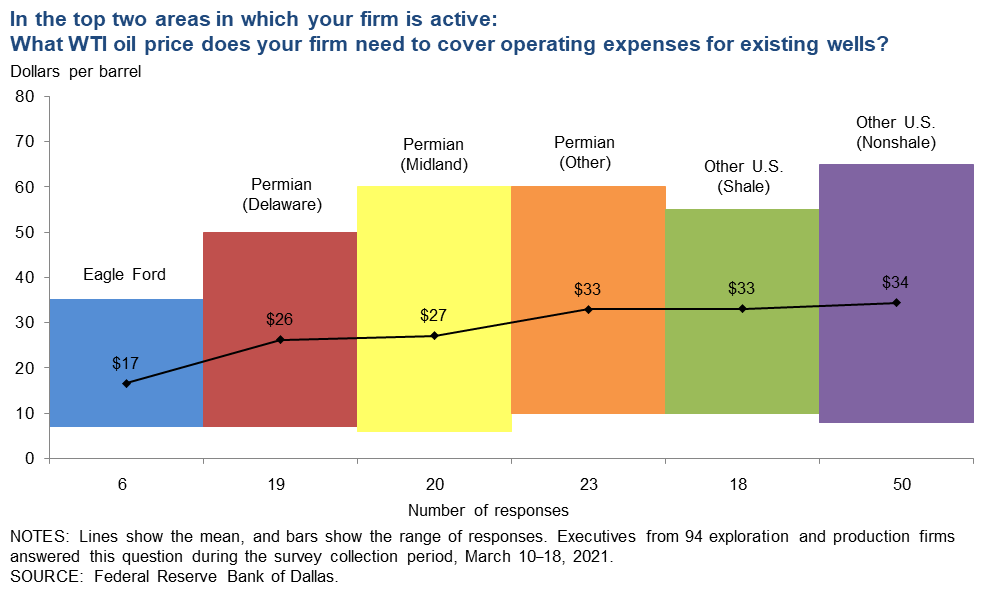
In the top two areas in which your firm is active: What West Texas Intermediate (WTI) oil price does your firm need to cover operating expenses for existing wells?
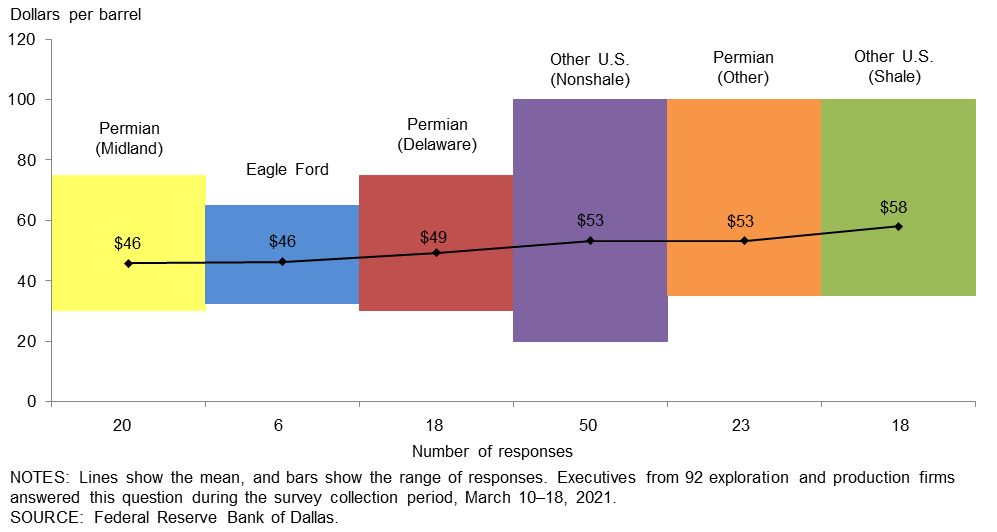
Across regions, the average price necessary to cover operating expenses ranges from $17 to $34 per barrel. Almost all respondents can cover operating expenses for existing wells at current prices. The average across the entire sample is approximately $31 per barrel, up slightly from $30 last year.
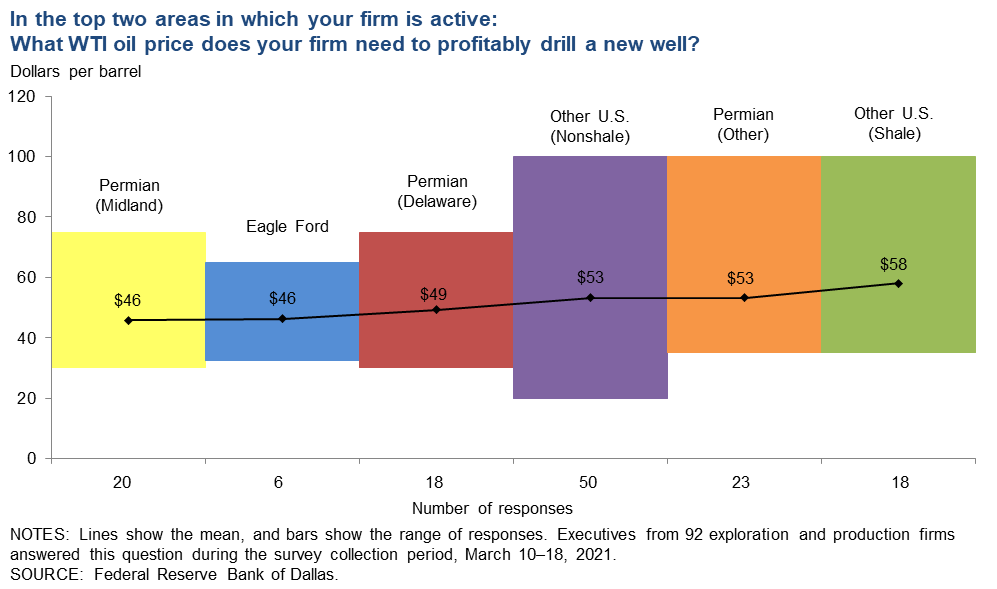
In the top two areas in which your firm is active: What WTI oil price does your firm need to profitably drill a new well?
For the entire sample, firms need $52 per barrel on average to profitably drill—higher than the $49-per-barrel price when this question was asked last year. Across regions, average breakeven prices to profitably drill a new well range from $46 to $58 per barrel. Breakeven prices in the Permian Basin average $50 per barrel—$1 higher than last year. For the past five years, Permian (Midland) has been the lowest-cost region. With the recent recovery in oil prices, the majority of firms in the survey can profitably drill a new well at current prices; 80 percent of responses were at or below the March 19 WTI spot price ($61 per barrel).
Oil and Gas Support Services Firms
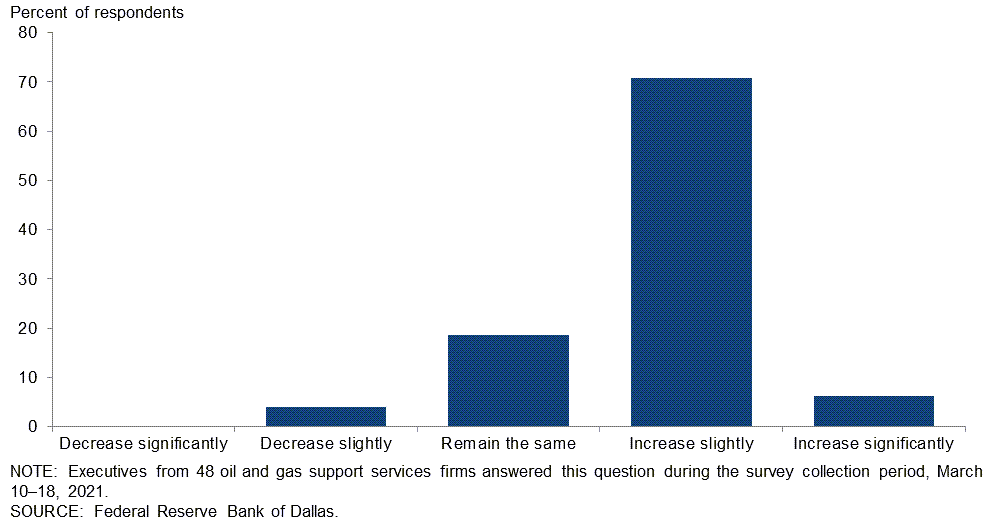
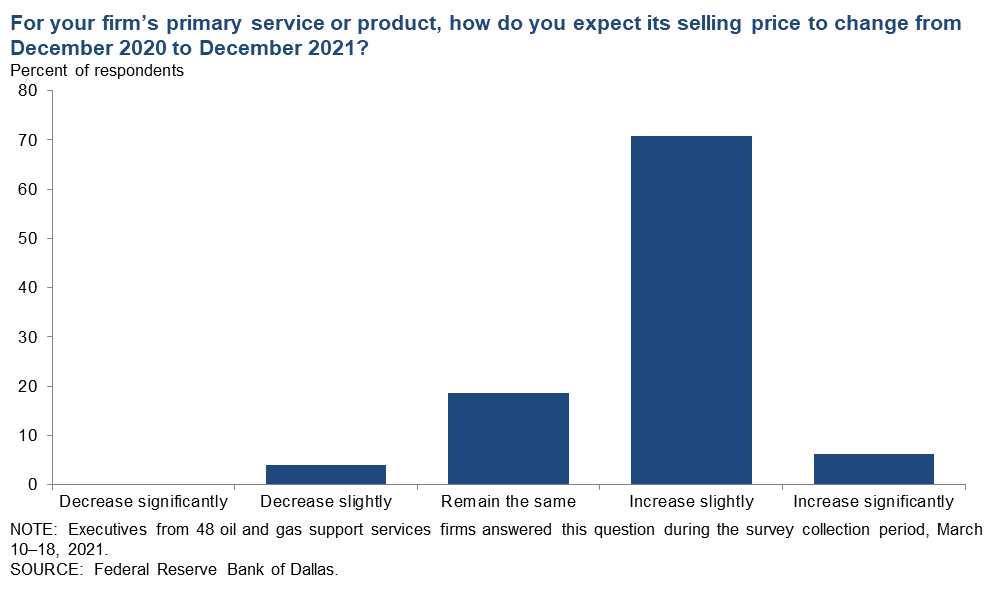
For your firm’s primary service or product, how do you expect its selling price to change from December 2020 to December 2021?
Seventy-one percent of executives expect the selling price of their firm’s primary service or product to increase slightly from December 2020 to December 2021. An additional 6 percent expect the selling price to increase significantly, while 19 percent expect it to remain the same. Four percent of executives expect the selling price to decrease slightly during the period.
All Firms
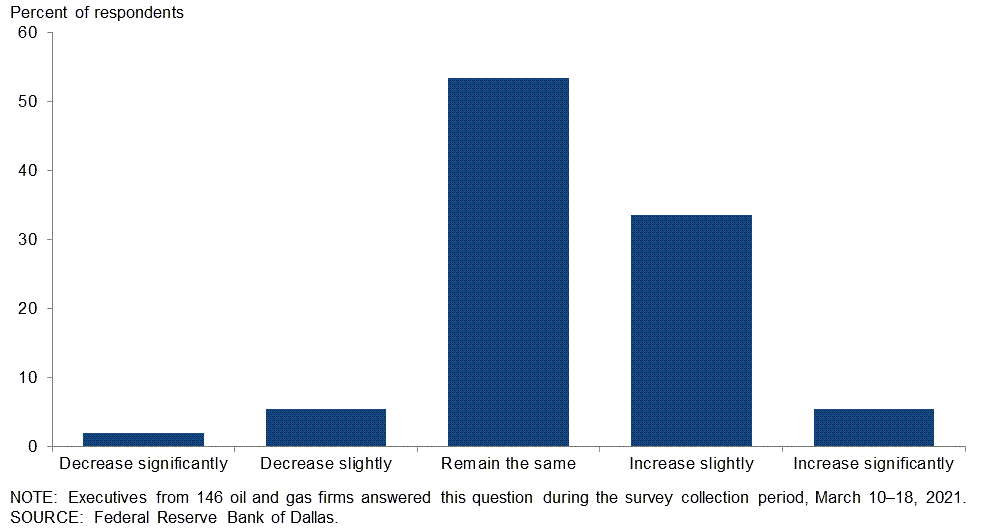
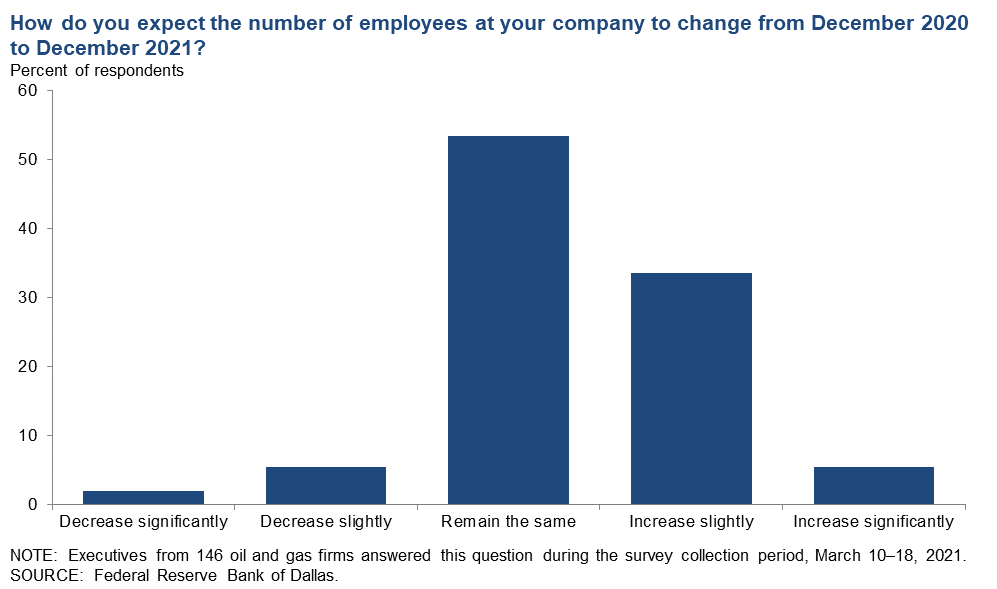
How do you expect the number of employees at your company to change from December 2020 to December 2021?
Slightly over half—53 percent—of executives expect their head count to remain unchanged from December 2020 to December 2021. Thirty-nine percent of executives expect the number of employees to increase, of which 5 percent expect a significant increase and 34 percent expect a slight increase. Only 7 percent expect the number of employees to decrease over the period.
Fifty-three percent of support services firms expect to increase the number of employees in 2021 versus 32 percent for E&P firms. (See table for more detail.)
| Response | Percent of respondents | ||
| All firms | E&P | Services | |
| Decrease significantly | 2 | 3 | 0 |
| Decrease slightly | 5 | 6 | 4 |
| Remain the same | 53 | 59 | 43 |
| Increase slightly | 34 | 28 | 45 |
| Increase significantly | 5 | 4 | 8 |
| OTES: Executives from 97 exploration and production firms and 49 oil and gas support services firms answered this question during the survey collection period, March 10–18, 2021. The "All Firms" column reports the percentage out of the total 146 responses. Percentages may not sum to 100 due to rounding. SOURCE: Federal Reserve Bank of Dallas. |
|||
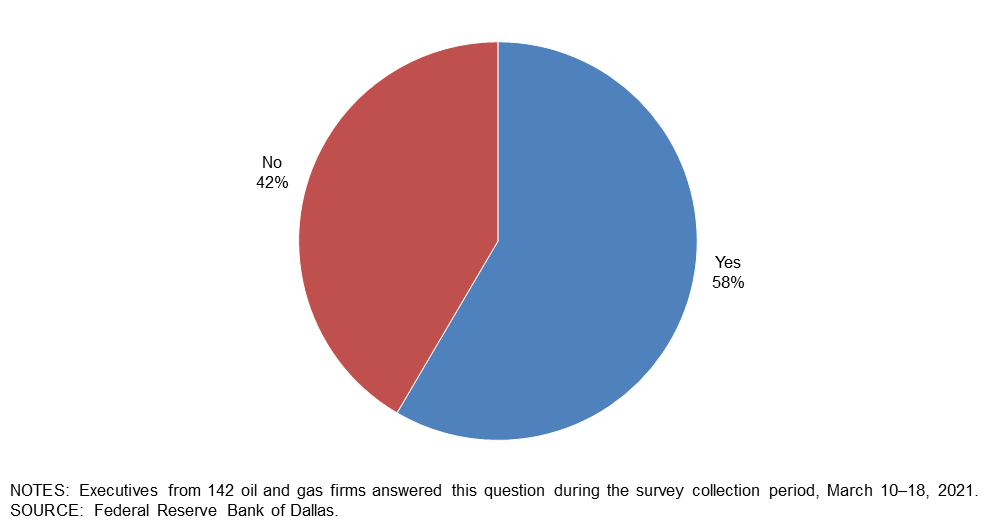
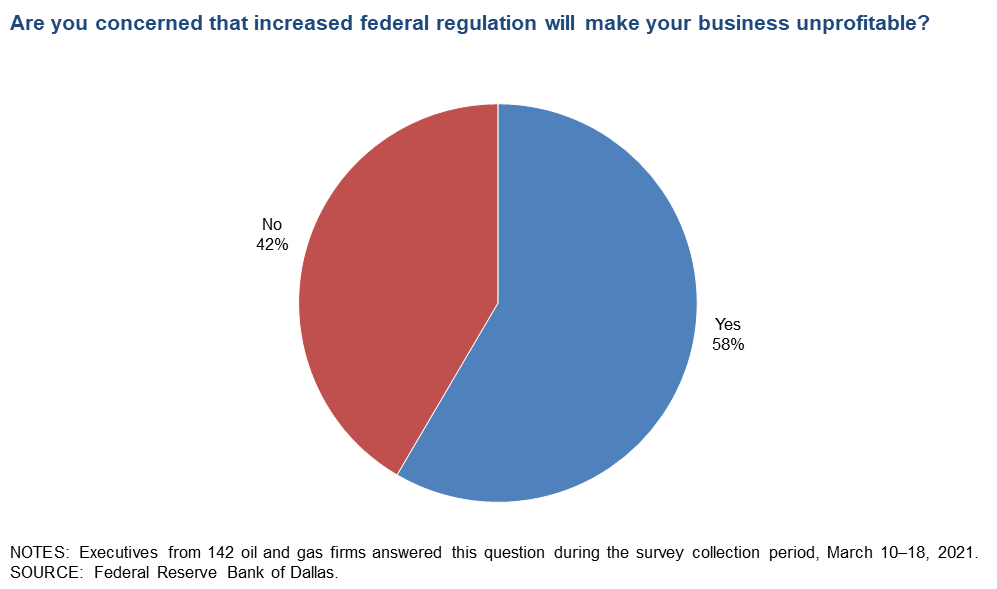
Are you concerned that increased federal regulation will make your business unprofitable?
Fifty-eight percent of executives said they are concerned that increased federal regulation will make their business unprofitable. The remaining 42 percent aren’t concerned.
Special Questions Comments
Exploration and Production (E&P) Firms
- The current federal regulations are very concerning. We have a strong New Mexico presence, and that is being jeopardized significantly by the new administration.
- The decidedly oil and gas unfriendly Biden administration has us in the crosshairs. I believe that it is their goal to effectively shut down our industry, and they will pursue that end with great energy. I am happy that my career is nearly over and am worried about the future of our industry.
- The oil and gas industry does not need government intervention and additional political risk right now. If there is a need to make changes, it should be done with transparency and incrementally over time with industry input. Rash and disruptive decisions do not help an industry that is already very volatile.
- Various political stances are attempting to villainize the entire industry, which is counterproductive to the stated desires of "getting green." Natural gas is a critical transition energy source and needs to be spurred by incentives to capture and sequester rather than having obstacles, bureaucratic "red flags" and knee-jerk policy pronouncements that are simply serving as shortsighted political postures.
- The loss of suppliers and other services this past year will cause problems in being able to get work accomplished in a timely manner. The infrastructure has deteriorated and will get worse with offshore and federal land regulations as well as with what the Environmental Protection Agency may come up with.
- We do not operate on federal lands, and our emissions compliance is up to standards set during the Obama administration and restored by the current administration. We have added over 150 contract employees working directly for the company or for our contractors or subcontractors by returning to drilling and completing wells.
- It is very frustrating to see the progressive “left” exert pressure on the new administration, pushing them not to appoint or hire anyone who has any experience with oil and gas production. This will cause America to relinquish its positive trade balance in oil and regain the posture as the world's biggest importer of oil in just a few years.
- Restrictions will increase the price of oil.
- E&P demand for oilfield services has increased in the last six months, but an oversupply is still creating a buyer’s market in 2021.
- We do not drill on federal leases so increasing federal regulations will have no adverse effect on our business.
- COVID-19 is going to be over before we know it, and demand recovery will be stronger than expected. Despite attempts to force electrification, consumer preferences will remain for sport utility vehicles over smaller vehicles and air travel over staying at home. There is a bright future ahead for oil.
- The current regulatory environment is dangerous for the country.
- Any regulation or restriction on leases, drilling or producing only serves to raise oil prices, making existing reserves more valuable. However, as a deal taker, it makes it much more difficult to find reasonably priced deals.
- Regulatory uncertainty creates a clear challenge to continued investment in energy development of our assets.
- The answer regarding whether we are concerned that increased federal regulations will make our business unprofitable could go from “No” to “Yes” in the long run if federal regulations become more targeted at decreasing supply. Companies will adapt by focusing on nonfederal U.S. areas.
- We have federal leases. Therefore, additional federal regulation will have a substantial negative effect.
Oil and Gas Support Services Firms
- Time will tell, but closing loopholes on flaring could actually stimulate some areas of our business. The bigger E&P firms are already moving in that direction.
- We are fortunate, as our primary operations are not directly impacted by the Biden administration’s moratorium on federal leasing and permitting. We don't do much work offshore and, with the exception of the New Mexico portion of the Permian Basin, are not impacted by the onshore moratorium. We do expect this change will force relocation of companies from those areas and cause a further oversupply of service equipment in the areas of state and private land drilling. This change is likely a positive for states like Texas, Oklahoma, Kansas, West Virginia, Ohio and Pennsylvania, as more E&P companies will shift budgets to those states not impacted by the federal moratorium.
- The global oil supply has been impaired based on actions taken over the last 12 months, especially in the lower 48 states.
- Our company is looking to diversify our operations so that we have other revenue streams that aren’t impacted by increased federal regulations. Our business, along with many others, is directly impacted by these regulations.
- Increased federal regulations will likely impact our costs to build and operate pipelines. State regulation, particularly in New Mexico, could have a large impact as well.
- As to the question about federal regulations making our business unprofitable, I think that regulations that restrict access to drillable locations will make other drillable areas more attractive and will lead to improved commodity prices. The use of hydrocarbons is not going away anytime soon, and should the economy rebound to need 100 million barrels a day again, oil and gas prices will improve to make delivering those 100 million barrels profitable. Restrictive federal regulations will only exacerbate the potential price spike.
- As usual, the price of oil is so unpredictable. I never would have guessed it would hit $65 per barrel in March of 2021.
Additional Comments »
Historical data are available from first quarter 2016 to the most current release quarter.
Business Indicators: Quarter/Quarter
| Business Indicators: All Firms Current Quarter (versus previous quarter) | |||||
| Indicator | Current Index | Previous Index | % Reporting Increase | % Reporting No Change | % Reporting Decrease |
Level of Business Activity | 53.6 | 18.5 | 59.4 | 34.8 | 5.8 |
Capital Expenditures | 30.0 | 6.3 | 43.1 | 43.8 | 13.1 |
Supplier Delivery Time | 7.8 | –0.7 | 19.6 | 68.6 | 11.8 |
Employment | 8.4 | –11.7 | 16.2 | 76.0 | 7.8 |
Employee Hours | 22.8 | –6.9 | 28.6 | 65.6 | 5.8 |
Wages and Benefits | 14.8 | –12.4 | 20.6 | 73.5 | 5.8 |
| Indicator | Current Index | Previous Index | % Reporting Improved | % Reporting No Change | % Reporting Worsened |
Company Outlook | 70.6 | 21.6 | 75.3 | 20.0 | 4.7 |
| Indicator | Current Index | Previous Index | % Reporting Increase | % Reporting No Change | % Reporting Decrease |
Uncertainty | –22.2 | –13.8 | 20.9 | 35.9 | 43.1 |
| Business Indicators: E&P Firms Current Quarter (versus previous quarter) | |||||
| Indicator | Current Index | Previous Index | % Reporting Increase | % Reporting No Change | % Reporting Decrease |
Level of Business Activity | 47.1 | 16.5 | 53.8 | 39.4 | 6.7 |
Oil Production | 16.3 | 1.0 | 34.6 | 47.1 | 18.3 |
Natural Gas Wellhead Production | 15.9 | –2.1 | 32.7 | 50.5 | 16.8 |
Capital Expenditures | 31.0 | 12.5 | 45.6 | 39.8 | 14.6 |
Expected Level of Capital Expenditures Next Year | 49.5 | 24.0 | 56.3 | 36.9 | 6.8 |
Supplier Delivery Time | 4.8 | –2.1 | 17.3 | 70.2 | 12.5 |
Employment | 1.0 | –13.4 | 9.7 | 81.6 | 8.7 |
Employee Hours | 11.6 | –8.2 | 18.4 | 74.8 | 6.8 |
Wages and Benefits | 7.7 | –14.4 | 15.4 | 76.9 | 7.7 |
Finding and Development Costs | 3.9 | –21.9 | 12.7 | 78.4 | 8.8 |
Lease Operating Expenses | –5.9 | –12.5 | 10.8 | 72.5 | 16.7 |
| Indicator | Current Index | Previous Index | % Reporting Improved | % Reporting No Change | % Reporting Worsened |
Company Outlook | 69.6 | 25.3 | 74.7 | 20.2 | 5.1 |
| Indicator | Current Index | Previous Index | % Reporting Increase | % Reporting No Change | % Reporting Decrease |
Uncertainty | –21.4 | –22.9 | 22.3 | 34.0 | 43.7 |
| Business Indicators: O&G Support Services Firms Current Quarter (versus previous quarter) | |||||
| Indicator | Current Index | Previous Index | % Reporting Increase | % Reporting No Change | % Reporting Decrease |
Level of Business Activity | 66.7 | 22.4 | 70.6 | 25.5 | 3.9 |
Utilization of Equipment | 63.2 | 6.4 | 67.3 | 28.6 | 4.1 |
Capital Expenditures | 28.0 | –6.2 | 38.0 | 52.0 | 10.0 |
Supplier Delivery Time | 14.3 | 2.1 | 24.5 | 65.3 | 10.2 |
Lag Time in Delivery of Firm's Services | 18.8 | –4.3 | 18.8 | 81.3 | 0.0 |
Employment | 23.5 | –8.3 | 29.4 | 64.7 | 5.9 |
Employee Hours | 45.1 | –4.1 | 49.0 | 47.1 | 3.9 |
Wages and Benefits | 29.4 | –8.4 | 31.4 | 66.7 | 2.0 |
Input Costs | 36.0 | –4.3 | 38.0 | 60.0 | 2.0 |
Prices Received for Services | 20.0 | –29.7 | 26.0 | 68.0 | 6.0 |
Operating Margin | 14.0 | –31.9 | 28.0 | 58.0 | 14.0 |
| Indicator | Current Index | Previous Index | % Reporting Improved | % Reporting No Change | % Reporting Worsened |
Company Outlook | 72.6 | 14.6 | 76.5 | 19.6 | 3.9 |
| Indicator | Current Index | Previous Index | % Reporting Increase | % Reporting No Change | % Reporting Decrease |
Uncertainty | –24.0 | 4.1 | 18.0 | 40.0 | 42.0 |
Business Indicators: Year/Year
| Business Indicators: All Firms Current Quarter (versus same quarter a year ago) | |||||
| Indicator | Current Index | Previous Index | % Reporting Increase | % Reporting No Change | % Reporting Decrease |
Level of Business Activity | 17.3 | –52.9 | 48.0 | 21.3 | 30.7 |
Capital Expenditures | 8.7 | –54.7 | 38.0 | 32.7 | 29.3 |
Supplier Delivery Time | 9.0 | –16.8 | 22.1 | 64.8 | 13.1 |
Employment | –16.7 | –36.9 | 14.8 | 53.7 | 31.5 |
Employee Hours | 2.1 | –34.6 | 25.7 | 50.7 | 23.6 |
Wages and Benefits | –2.0 | –38.3 | 19.6 | 58.8 | 21.6 |
| Indicator | Current Index | Previous Index | % Reporting Improved | % Reporting No Change | % Reporting Worsened |
Company Outlook | 53.6 | –37.0 | 70.0 | 13.6 | 16.4 |
| Business Indicators: E&P Firms Current Quarter (versus same quarter a year ago) | |||||
| Indicator | Current Index | Previous Index | % Reporting Increase | % Reporting No Change | % Reporting Decrease |
Level of Business Activity | 25.0 | –52.1 | 50.0 | 25.0 | 25.0 |
Oil Production | –3.9 | –50.5 | 33.7 | 28.7 | 37.6 |
Natural Gas Wellhead Production | 3.0 | –34.0 | 34.3 | 34.3 | 31.3 |
Capital Expenditures | 13.0 | –53.8 | 40.0 | 33.0 | 27.0 |
Expected Level of Capital Expenditures Next Year | 35.0 | –29.6 | 49.0 | 37.0 | 14.0 |
Supplier Delivery Time | 7.2 | –14.4 | 19.4 | 68.4 | 12.2 |
Employment | –13.2 | –35.5 | 13.1 | 60.6 | 26.3 |
Employee Hours | 11.2 | –28.6 | 25.5 | 60.2 | 14.3 |
Wages and Benefits | –4.0 | –37.6 | 15.2 | 65.7 | 19.2 |
Finding and Development Costs | –12.0 | –45.6 | 12.0 | 64.0 | 24.0 |
Lease Operating Expenses | –20.2 | –45.0 | 12.1 | 55.6 | 32.3 |
| Indicator | Current Index | Previous Index | % Reporting Improved | % Reporting No Change | % Reporting Worsened |
Company Outlook | 59.1 | –29.8 | 73.1 | 12.9 | 14.0 |
| Business Indicators: O&G Support Services Firms Current Quarter (versus same quarter a year ago) | |||||
| Indicator | Current Index | Previous Index | % Reporting Increase | % Reporting No Change | % Reporting Decrease |
Level of Business Activity | 2.0 | –54.2 | 44.0 | 14.0 | 42.0 |
Utilization of Equipment | 4.3 | –61.7 | 42.6 | 19.1 | 38.3 |
Capital Expenditures | 0.0 | –56.2 | 34.0 | 32.0 | 34.0 |
Supplier Delivery Time | 12.8 | –21.3 | 27.7 | 57.4 | 14.9 |
Lag Time in Delivery of Firm's Services | 6.3 | –17.0 | 18.8 | 68.8 | 12.5 |
Employment | –24.0 | –39.6 | 18.0 | 40.0 | 42.0 |
Employee Hours | –16.0 | –45.9 | 26.0 | 32.0 | 42.0 |
Wages and Benefits | 2.1 | –39.6 | 28.6 | 44.9 | 26.5 |
Input Costs | 20.4 | –32.0 | 36.7 | 46.9 | 16.3 |
Prices Received for Services | –24.5 | –57.5 | 22.4 | 30.6 | 46.9 |
Operating Margin | –28.0 | –56.5 | 20.0 | 32.0 | 48.0 |
| Indicator | Current Index | Previous Index | % Reporting Improved | % Reporting No Change | % Reporting Worsened |
Company Outlook | 42.5 | –51.1 | 63.8 | 14.9 | 21.3 |
Activity Chart

Comments from Survey Respondents
These comments are from respondents’ completed surveys and have been edited for publication. Comments from the Special Questions survey can be found below the special questions.
Exploration and Production (E&P) Firms
- With drilling costs lower and oil prices higher, we are drilling more wells in 2021 than we did from 2018 to 2020.
- With the current political sentiment being against oil and gas, I am beginning to question how much longer I will continue to risk capital in this business. I am waiting to see what tax law changes come out of Washington, D.C.
- Steel mill production curtailments and logistical constraints amid rapid restocking in anticipation of a recovery caused supply–demand mismatch and supply squeeze of certain raw products, reminiscent of a supply chain bullwhip effect. This imbalance is expected to be sorted out later this year. In a higher oil price world, the industry will be tested—whether to keep cost discipline in check and focus on returns or pursue growth; watch for activities among private operators.
- With the new administration, I think that oil supply will go down, and hence, oil prices will go up.
- While the price increases have been welcome news, OPEC-plus is a sword of Damocles: if U.S. operators raise capital expenditures, OPEC-plus will open its taps and flood the market. There is a tense détente currently.
- New equity capital has allowed our company to return to drilling after a 10-month pause, during which time we paid down debt.
- If the administration does not take a balanced approach to energy supplies by promoting all forms—but as efficiently as possible in all respects—then it will keep energy prices high for consumers, which is unnecessary. This helps earnings in the short run but creates uncertainty in the long run if projects require federal approval.
- Current building restrictions on government leases and fears around pipeline construction permits have increased our price projections.
- The New Mexico political issues and national political issues have put a real damper on the outlook for our industry in New Mexico. It is so unfortunate, as the opportunities at the current price level are excellent, and the industry should be booming, but it is not. The sad thing is that we will use fossil fuels in our country for years to come, and every barrel that is produced domestically results in less emissions than a barrel produced anywhere else in the world. Yet, we seem bent on killing the domestic oil and gas industry.
- As if production declines, hostile politics and sustained product price differentials weren't bad enough, the "Great Texas Valentine’s Day Ice Storm" added another layer of complexity into an otherwise nearly insurmountable layer-cake of adversity this year. This is going to be another character-building year, and hopefully, by the time this long year ends, there will be a bunch of us characters still around! Well, we can all cheer up knowing tax day is just around the corner. Oh wait, that's just for the companies that have a profit. We still will need legions of certified public accountants to report zero tax due on seas of red ink, again.
- It is great to see improved oil prices. The higher prices feel fragile and have not really impacted my revenue yet.
- The jump in prices has created uncertainty and could potentially negatively impact the acquisition and divestiture market, which was about to become settled on commodity price expectations. Government regulations and intervention in oil and gas on federal leases have created political risk and pose a long-term threat. American hydrocarbons are the most regulated, safest and most reliable sources of clean barrels relative to other sources.
- The positive outlook and activity increase at our firm are primarily due to completing a major acquisition.
- We are currently doing numerous workovers that were put off last year.
- The Biden administration’s moratorium on granting new oil and gas leases on federal lands administered by the Bureau of Land Management as well as a temporary ban on the issuance of new drilling permits on federal lands will necessitate a change of focus in our exploration plans.
- The erratic political scene in our national government today and its influence on the economy is making any meaningful assessment of near- and long-term market conditions impossible. As a consequence, capital planning is a "fool’s" game, at best. There is no question that we are going to experience an inflation cycle of significance, as Washington has obviously elected to forgo any rational concept of the consequences of the "blank" check increase in the money supply based on unlimited deficit financing on the federal level.
- In the last quarter of 2020 and the first quarter of 2021, we have been selling and/or plugging low-production inventory, thus the decrease in activity, production and expenditures. This was done to better position us for growth in 2021.
Oil and Gas Support Services Firms
- While commodity prices have improved, we have not seen much increase in drilling activity from the prior two quarters. Our forecast is for a modest improvement in activity in the second half of 2021. Hopefully, with improved commodity prices and cash flow to our customers, there will be some price improvement for the service sector. Many service companies are stretched very thin and are managing to hang on only due to Paycheck Protection Program funding. The service industry will not survive a full year at the current pricing levels.
- Any service price increase will be slow to come.
- The outlook has improved based on increased oil demand and prices driven by accelerated COVID-19 vaccine rollout and heightened expectations of the eventual reopening of economies. Investor demands on E&P firms will mute somewhat the continued recovery in upstream E&P spending during 2021.
- Our activity level is steadily increasing, but we are increasing wages almost daily to retain quality employees.
- While our level of business activity has increased, we have had to cut prices on our services, so there hasn't really been an increase in revenue. That, coupled with rising fuel costs, is creating an impossibly small operating margin.
- We are concerned about the federal leasing moratorium and political activity in New Mexico. Curtailment will simply push prices up and rigs elsewhere (or to OPEC).
- The small activity increase for us has been mostly related to solar farms with mineral agreements.
- We expect another quarter of guarded optimism. Activity levels are up slightly. Uncertainty of demand due to the pandemic is still a driving force.
- I have a small company of just me and my husband with a truck and mini-float trailer. I just can't compete against the big companies due to insurance demands from customers.
- Our seismic customers are slowly awakening from a deep downward spiral with a clear directive to continue to control cost. While no one is breaking out the champagne yet, at least we can see the potential for a viable business (seismic) going forward.
- Pricing for oilfield services must be allowed to increase immediately. Until that occurs, E&P companies are being subsidized by unsustainable service price levels.
- While commodity prices are easing upward, most of the E&P firms in our basins have been slow to react.
Questions regarding the Dallas Fed Energy Survey can be addressed to Michael Plante at Michael.Plante@dal.frb.org or Kunal Patel at Kunal.Patel@dal.frb.org.
Sign up for our email alert to be automatically notified as soon as the latest Dallas Fed Energy Survey is released on the web.