
Dallas Fed Energy Survey
Oil and gas activity rises modestly as production, employment little changed
Special questions this quarter focus on artificial intelligence use and benefits, the potential impact of consolidation on U.S. oil production, lithium extraction from oil field brine, the impact of low Waha Hub natural gas prices on oil field and services activity in the Permian Basin and expectations for drilling horizontal laterals in a horseshoe pattern.
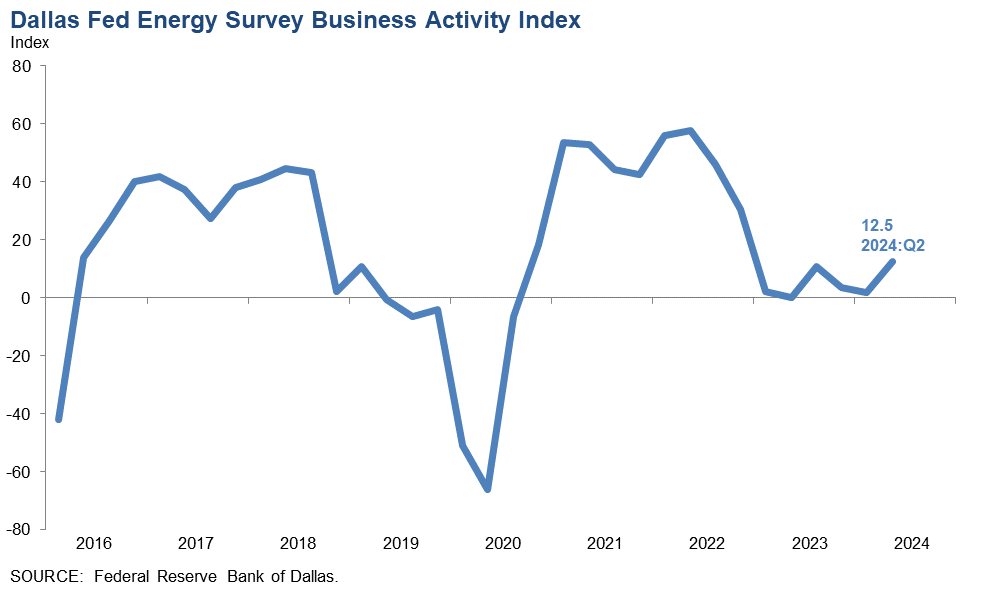
Activity in the oil and gas sector grew in the second quarter of 2024, according to oil and gas executives responding to the Dallas Fed Energy Survey. The business activity index, the survey’s broadest measure of the conditions energy firms in the Eleventh District face, increased from 2.0 in the first quarter to 12.5 in the second quarter.
Oil and gas production was little changed in the second quarter, according to executives at exploration and production (E&P) firms. The oil production index advanced from -4.1in the first quarter to 1.1 in the second quarter. The near-zero reading suggests production was essentially unchanged. Meanwhile, the natural gas production index also turned positive, but barely so, increasing from -17.0 to 2.3.
Costs rose at a slightly faster pace for oilfield services, but at a slower pace for E&P firms. Among oilfield services firms, the input cost index increased from 31.2 to 42.2. Among E&P firms, the finding and development costs index declined from 24.2 to 15.7. Meanwhile, the lease operating expenses index declined from 33.7 to 23.6.
The equipment utilization index of oilfield services firms turned positive, increasing from -4.2 in the first quarter to 10.9 in the second. The operating margin index remained negative but increased from -35.4 to -13.0, suggesting margins declined at a much slower pace. The index of prices received for services was relatively unchanged at -4.4.
The aggregate employment index was little changed at 2.9 in the first quarter. While this is the 14th consecutive positive reading for the index, the low-single-digit result suggests slow net hiring. The aggregate employee hours index was largely unchanged at 8.1. Additionally, the aggregate wages and benefits index decreased from 32.8 to 24.0.
The company outlook index was essentially unchanged at 10.0. The outlook index was 16.8 for E&P firms compared with -2.1 for services firms, suggesting modest optimism among E&P firms and a neutral outlook among services firms. The overall outlook uncertainty index was unchanged at 24.1, suggesting uncertainty continued to increase on net.
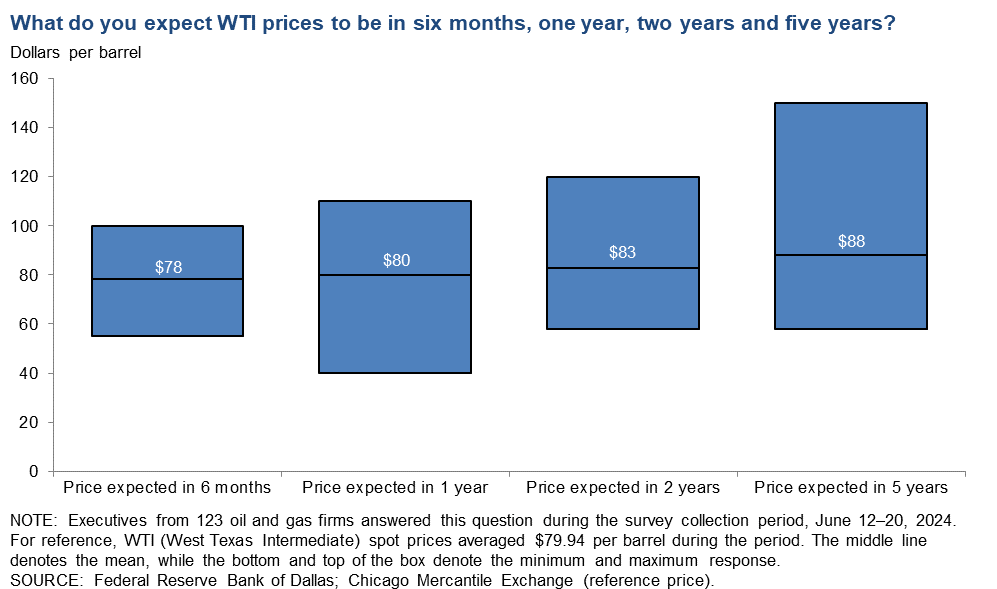
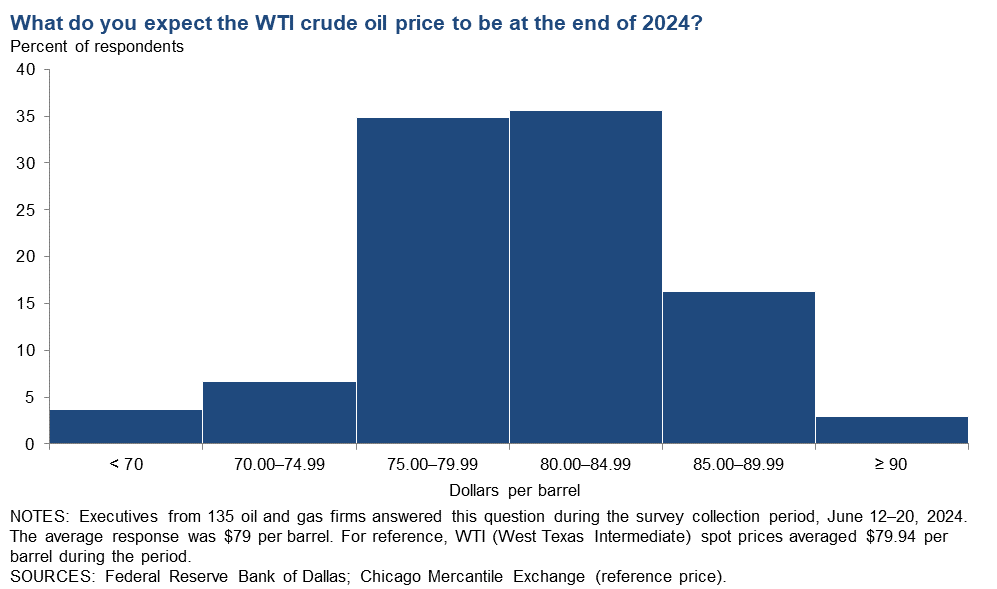
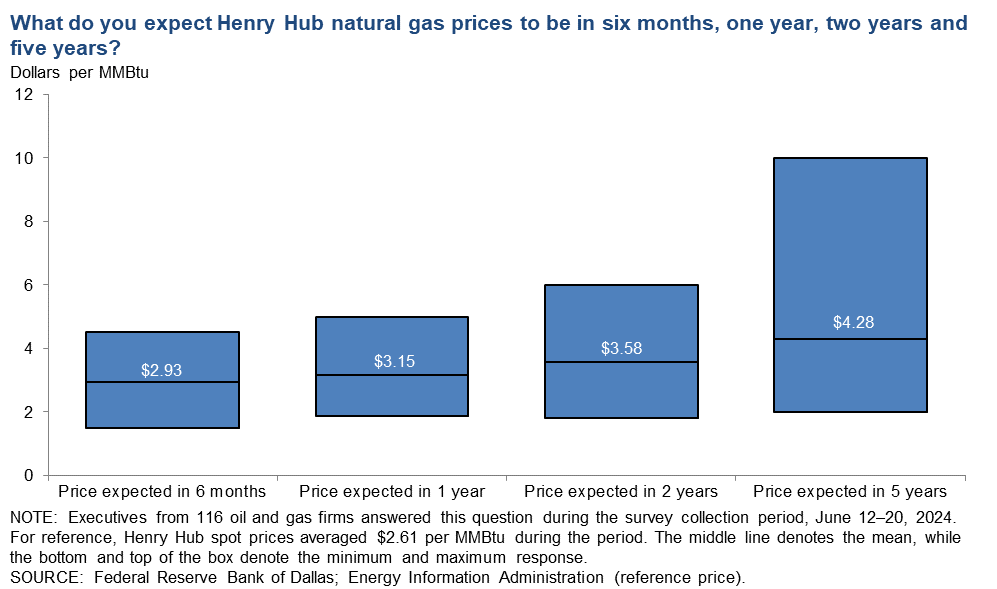
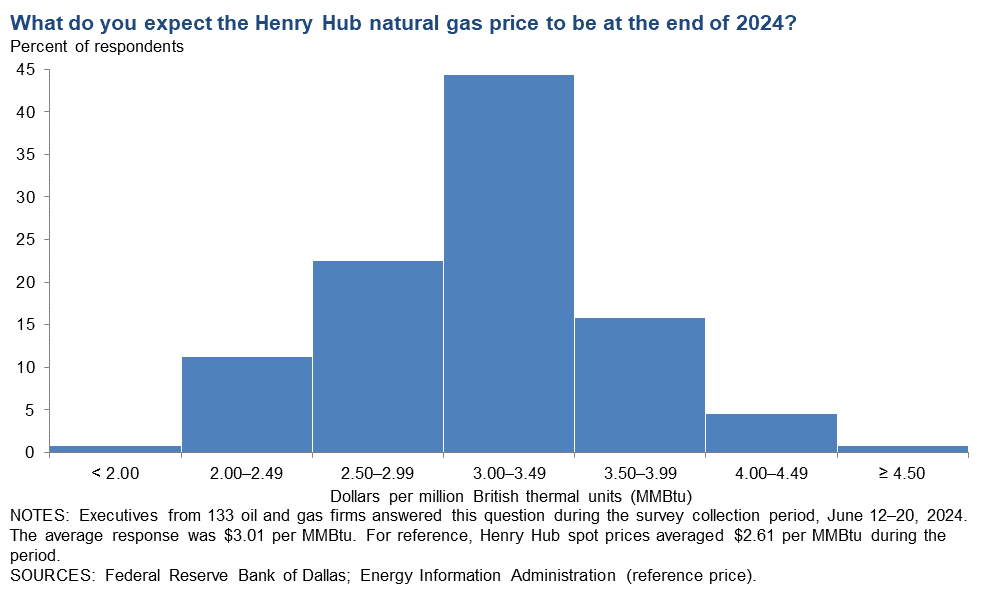
On average, respondents expect a West Texas Intermediate (WTI) oil price of $79 per barrel at year-end 2024; responses ranged from $62.5 to $100 per barrel. When asked about longer-term expectations, respondents on average expect a WTI oil price of $83 per barrel two years from now and $88 per barrel five years from now. Survey participants expect a Henry Hub natural gas price of $3.01 per million British thermal units (MMBtu) at year-end. When asked about longer-term expectations, respondents on average anticipate a Henry Hub gas price of $3.58 per MMBtu two years from now and $4.28 per MMBtu five years from now. For reference, WTI spot prices averaged $79.94 per barrel during the survey collection period, and Henry Hub spot prices averaged $2.61 per MMBtu.
Next release: September 25, 2024
Data were collected June 12–20, and 138 energy firms responded. Of the respondents, 90 were exploration and production firms and 48 were oilfield services firms.
The Dallas Fed conducts the Dallas Fed Energy Survey quarterly to obtain a timely assessment of energy activity among oil and gas firms located or headquartered in the Eleventh District. Firms are asked whether business activity, employment, capital expenditures and other indicators increased, decreased or remained unchanged compared with the prior quarter and with the same quarter a year ago. Survey responses are used to calculate an index for each indicator. Each index is calculated by subtracting the percentage of respondents reporting a decrease from the percentage reporting an increase. When the share of firms reporting an increase exceeds the share reporting a decrease, the index will be greater than zero, suggesting the indicator has increased over the previous quarter. If the share of firms reporting a decrease exceeds the share reporting an increase, the index will be below zero, suggesting the indicator has decreased over the previous quarter.
Price Forecasts
West Texas Intermediate Crude
| West Texas Intermediate crude oil price (dollars per barrel), year-end 2024 | ||||
| Indicator | Survey Average | Low Forecast | High Forecast | Price During Survey |
Current quarter | $78.66 | $62.50 | $100.00 | $79.94 |
Prior quarter | $80.11 | $70.00 | $120.00 | $82.52 |
| NOTE: Price during survey is an average of daily spot prices during the survey collection period. SOURCES: Federal Reserve Bank of Dallas; Chicago Mercantile Exchange. | ||||
Henry Hub Natural Gas
| Henry Hub natural gas price (dollars per MMBtu), year-end 2024 | ||||
| Indicator | Survey Average | Low Forecast | High Forecast | Price During Survey |
Current quarter | $3.01 | $1.85 | $4.80 | $2.61 |
Prior quarter | $2.59 | $1.50 | $7.00 | $1.44 |
| NOTE: Price during survey is an average of daily spot prices during the survey collection period. SOURCES: Federal Reserve Bank of Dallas; Energy Information Administration. | ||||
Special Questions
Data were collected June 12–20; 136 oil and gas firms responded to the special questions survey.
All firms
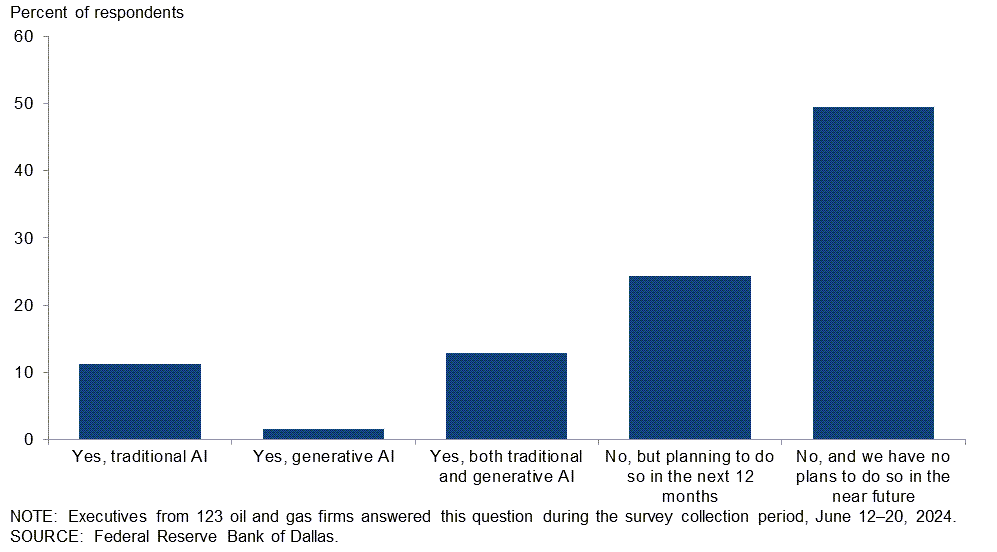
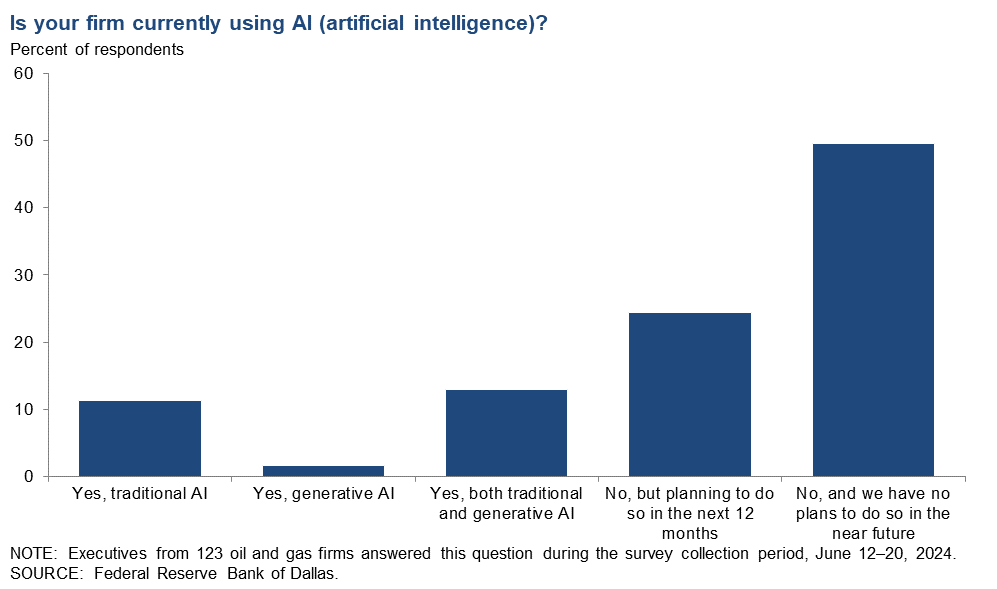
Is your firm currently using artificial intelligence (AI)?
Executives were provided examples of traditional AI and generative AI before they responded to the question. Fifty percent of executives said their firm is not using AI and has no plans to do so in the near future. Twenty-six percent of executives note their firm is using either traditional AI, generative AI or both. The remaining 24 percent of executives said their firm is currently not using AI but plans to do so in the next 12 months.
Responses differed depending on the firm’s size and type. Roughly half of the executives surveyed from large exploration and production (E&P) firms (with crude oil production of 10,000 barrels per day or more as of the fourth quarter of 2023) note they are using some form of AI, compared with 32 percent of executives from oil and gas support services firms and 16 percent of executives from small E&P firms (fewer than 10,000 barrels per day). Small E&P firms were also more likely than large E&P firms and services firms to indicate they have no plans to use AI in the near future. A breakdown of the data can be found in the table below.
| Response | Percent of respondents (among each group) | |||
| All firms | Large E&P | Small E&P | Services | |
| Yes, traditional AI | 11 | 25 | 5 | 16 |
| Yes, generative AI | 2 | 13 | 0 | 0 |
| Yes, both traditional and generative AI | 13 | 13 | 11 | 16 |
| No, but planning to do so in the next 12 months | 24 | 19 | 27 | 23 |
| No, and we have no plans to do so in the near future | 50 | 31 | 57 | 45 |
| NOTES: Executives from 79 exploration and production firms and 44 oil and gas support services firms answered this question during the survey collection period, June 12–20, 2024. Small E&P firms produced fewer than 10,000 barrels per day (b/d) in the fourth quarter of 2023, while large E&P firms produced 10,000 b/d or more. Responses came from 63 small firms and 16 large firms. Percentages may not sum to 100 due to rounding.
SOURCE: Federal Reserve Bank of Dallas. |
||||
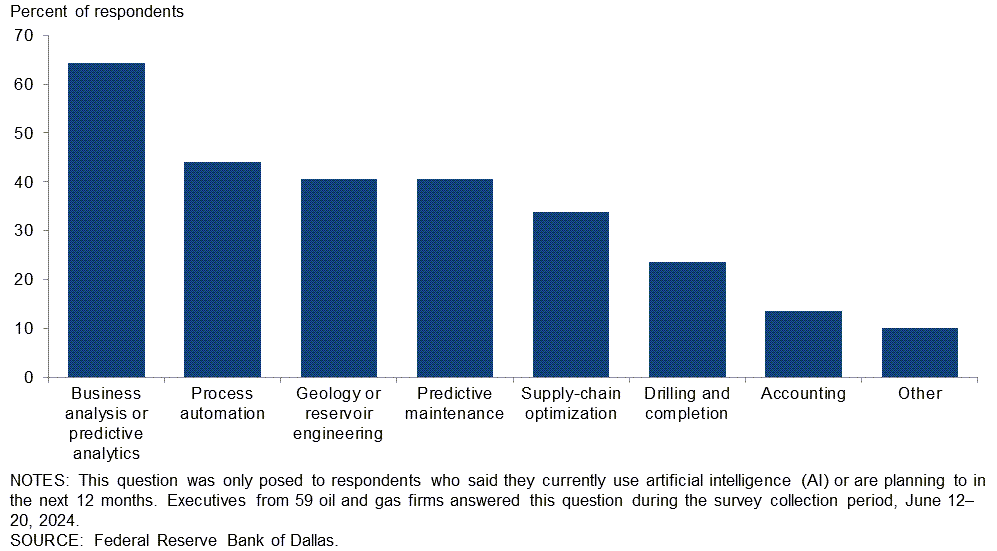
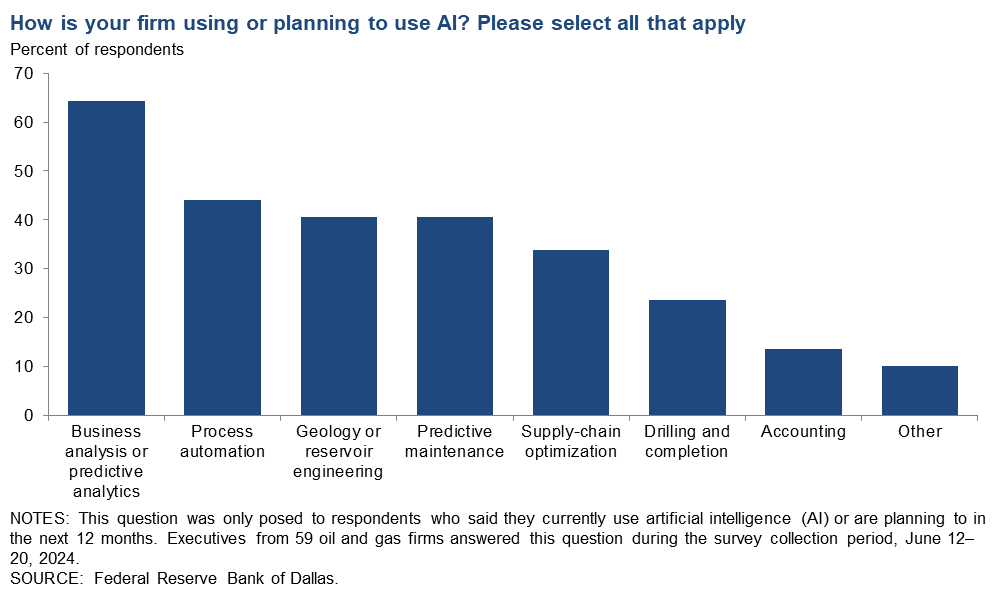
How is your firm using or planning to use AI? Please select all that apply.
This question was only posed to executives who said their firm currently uses AI or is planning to use it in the next 12 months. Executives were presented with seven potential uses, along with an option for “other.” The most selected response was "business analysis or predictive analytics" (64 percent of respondents) followed by “process automation” (44 percent of respondents). Both “geology or reservoir engineering” and “predictive maintenance” were selected by 41 percent of respondents. A breakdown of the data between the type of firm and size is in the table below. Exploration and production firms were more likely to note multiple uses for AI.
| Response | Percent of respondents (among each group) | |||
| All firms | Large E&P | Small E&P | Services | |
| Business analysis or predictive analytics | 64 | 82 | 64 | 57 |
| Process automation | 44 | 45 | 56 | 30 |
| Geology or reservoir engineering | 41 | 55 | 64 | 9 |
| Predictive maintenance | 41 | 55 | 32 | 43 |
| Supply-chain optimization | 34 | 27 | 44 | 26 |
| Drilling and completion | 24 | 27 | 16 | 30 |
| Accounting | 14 | 27 | 8 | 13 |
| Other | 10 | 18 | 4 | 13 |
| NOTES: This question was only posed to respondents who said they currently use AI or are planning to use it in the next 12 months. Executives from 36 exploration and production firms and 23 oil and gas support services firms answered this question during the survey collection period, June 12–20, 2024. Responses came from 25 small E&P firms and 11 large E&P firms. Percentages may not sum to 100 due to rounding. SOURCE: Federal Reserve Bank of Dallas. |
||||
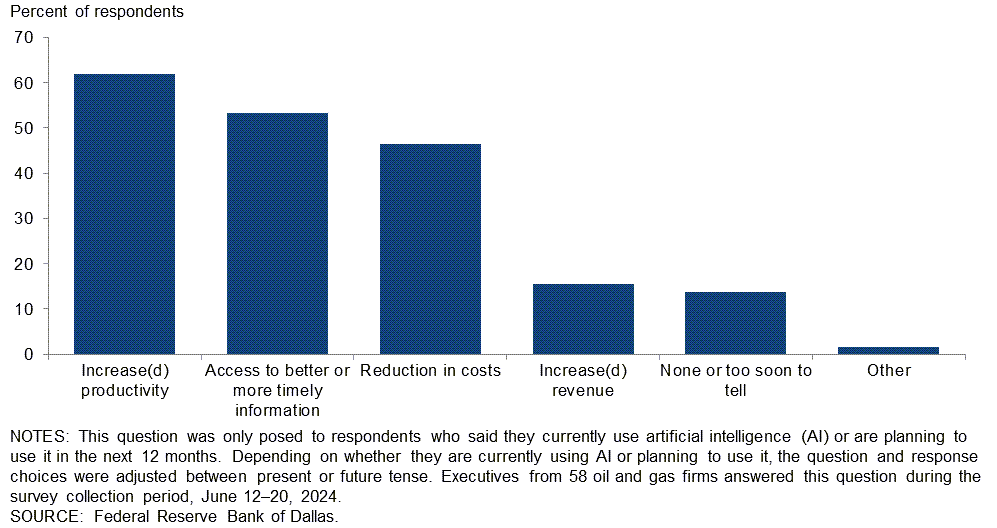
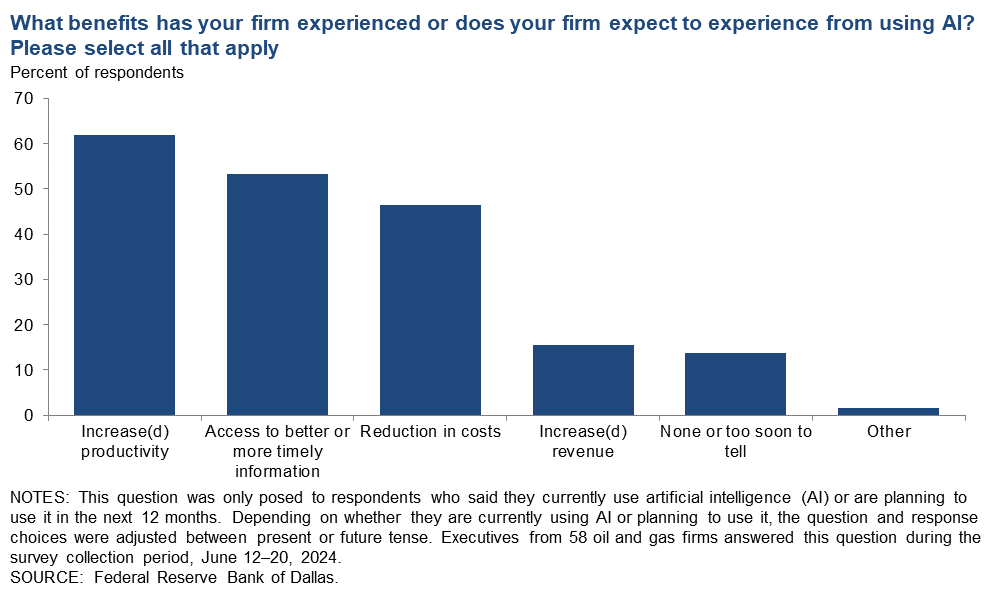
What benefits has your firm experienced or does your firm expect to experience from using AI? Please select all that apply.
This question was only posed to executives who said their firm currently uses AI or is planning to use it in the next 12 months. Executives were presented five potential benefits of AI, along with an option for “other.” The most selected response was "increase(d) productivity" (62 percent of respondents) followed by “access to better or more timely information” (53 percent of respondents) and “reduction in costs” (47 percent of respondents). A breakdown of the data between the type of firm and size can be found in the table below. Exploration and production firms were more likely to note multiple AI benefits.
| Response | Percent of respondents (among each group) | |||
| All firms | Large E&P | Small E&P | Services | |
| Increase(d) productivity | 62 | 91 | 64 | 45 |
| Access to better or more timely information | 53 | 64 | 60 | 41 |
| Reduction in costs | 47 | 45 | 56 | 36 |
| Increase(d) revenue | 16 | 27 | 16 | 9 |
| None or too soon to tell | 14 | 0 | 4 | 32 |
| Other | 2 | 0 | 0 | 5 |
| NOTES: This question was only posed to respondents who said they currently use AI or are planning to use it in the next 12 months. Depending on whether they are currently using AI or planning to use it, the question and response choices were adjusted between present or future tense. Executives from 36 exploration and production firms and 22 oil and gas support services firms answered this question during the survey collection period, June 12–20, 2024. Responses came from 25 small E&P firms and 11 large E&P firms. Percentages may not sum to 100 due to rounding.
SOURCE: Federal Reserve Bank of Dallas. |
||||
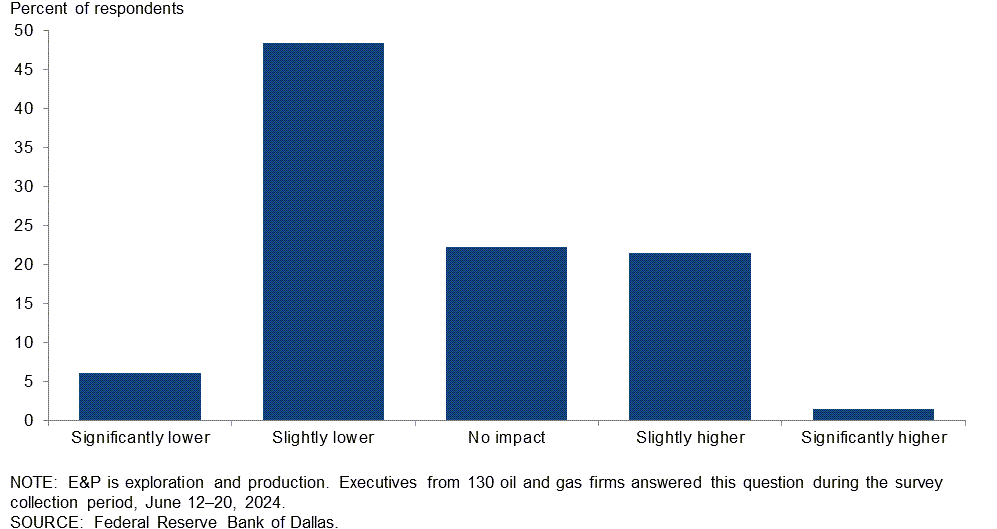
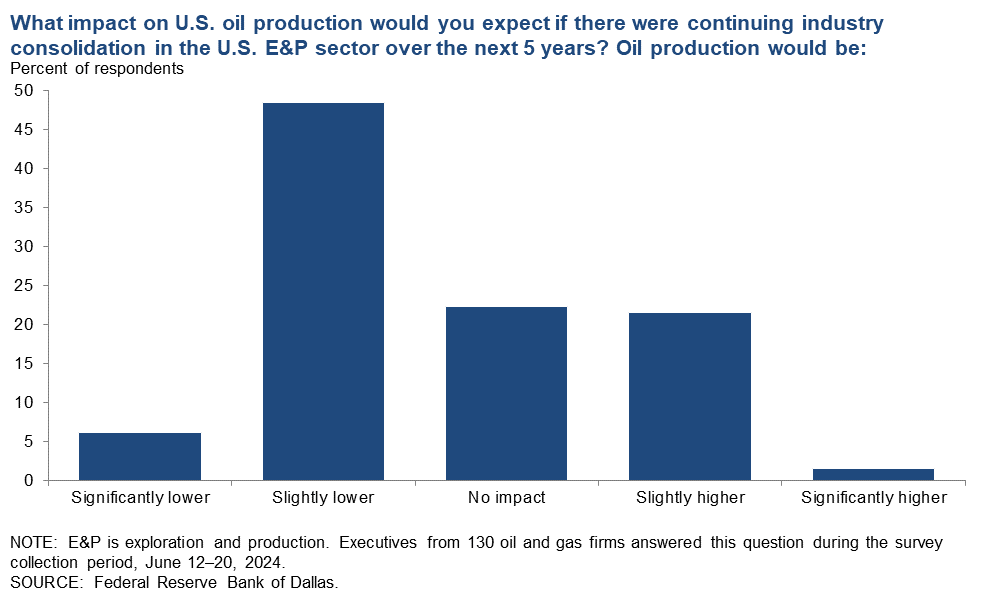
What impact on U.S. oil production would you expect if there were continuing industry consolidation in the U.S. E&P sector over the next 5 years? Oil production would be:
The most-selected response was "slightly lower" (48 percent of respondents) followed by “no impact” (22 percent of respondents) and “slightly higher” (22 percent of respondents). All executives from E&P firms that produce 100,000 b/d or more selected "no impact."
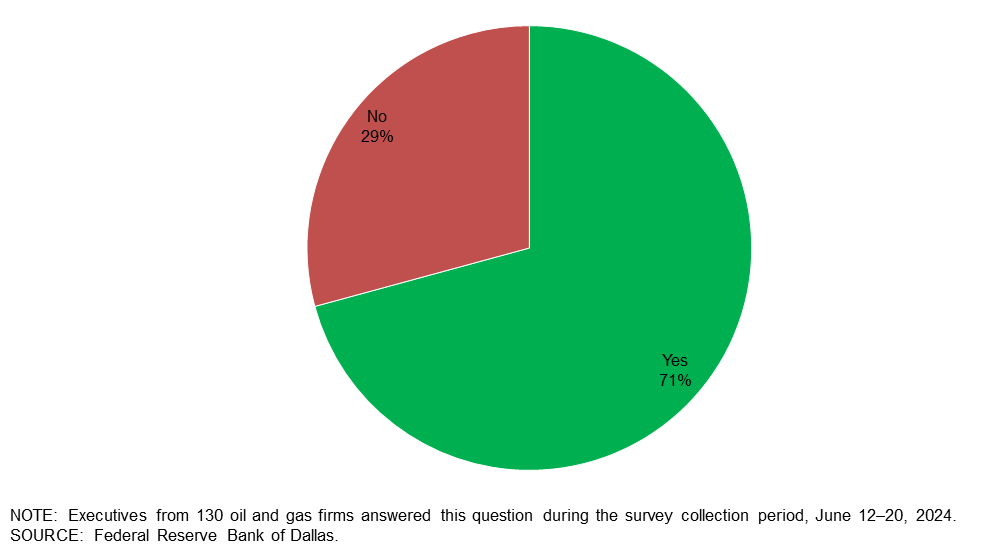
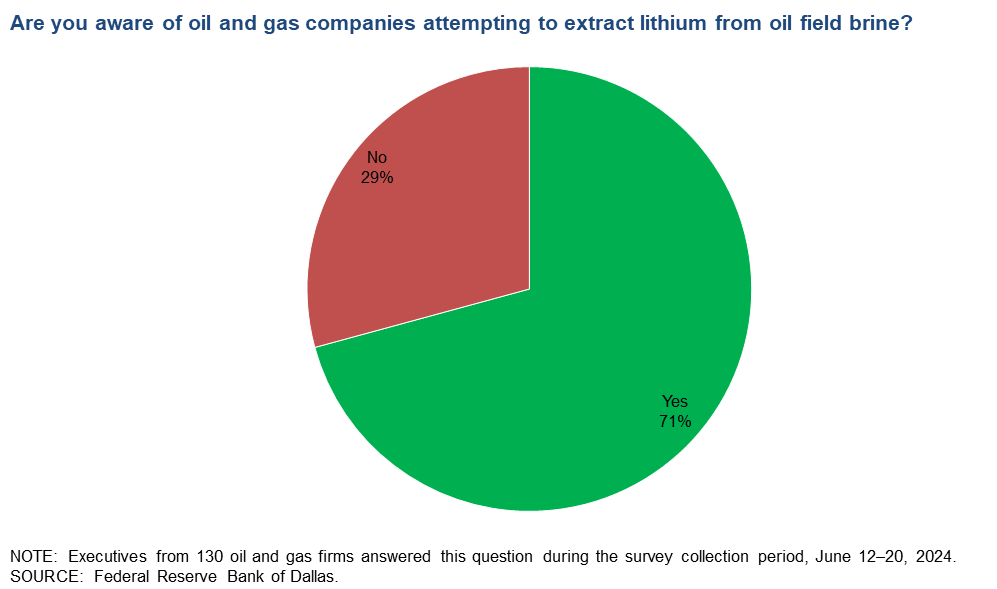
Are you aware of oil and gas companies attempting to extract lithium from oil field brine?
Seventy-one percent of executives said they are aware of oil and gas companies attempting to extract lithium from oil field brine.
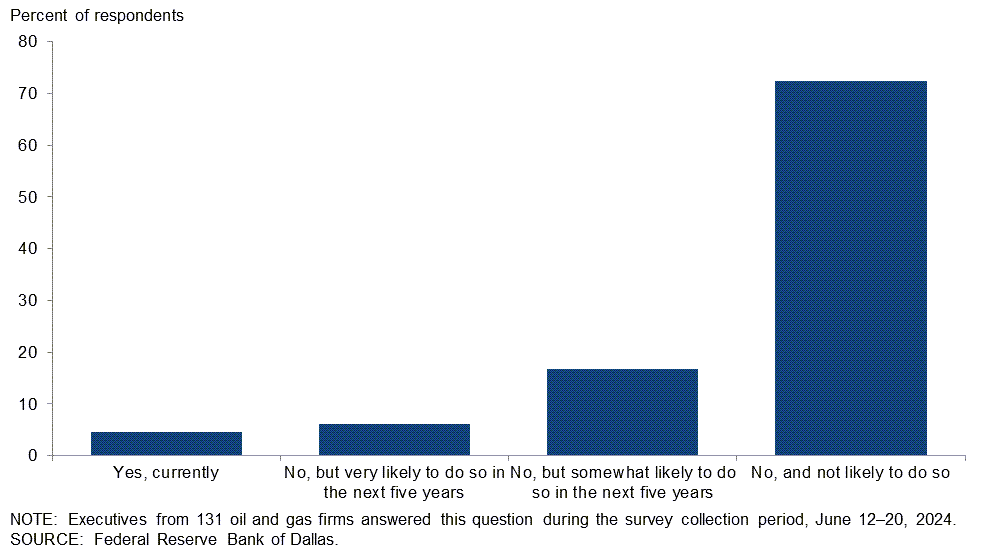
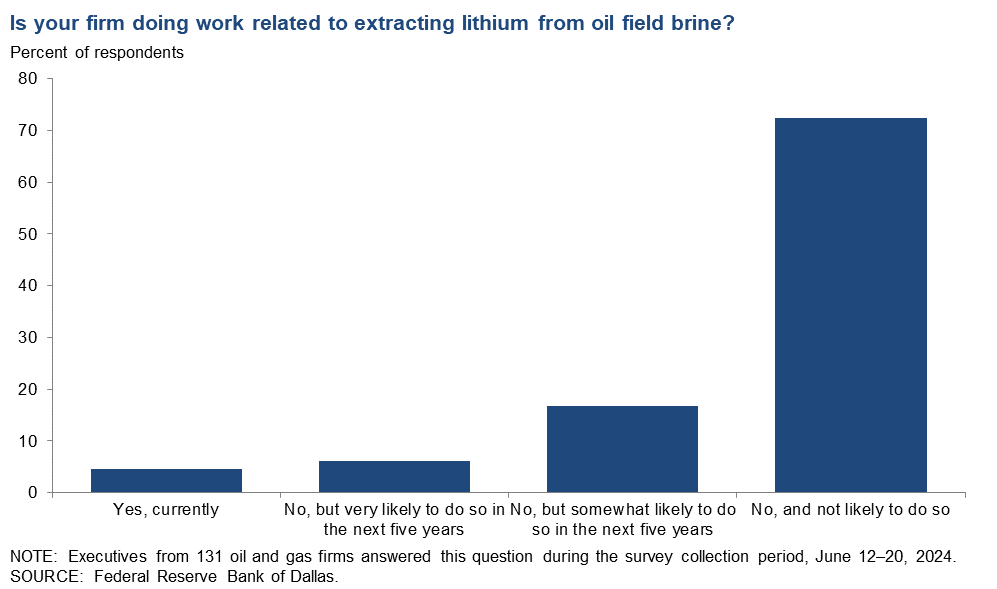
Is your firm doing work related to extracting lithium from oil field brine?
The majority of executives, 73 percent, said their firm is not doing work related to extracting lithium from oil field brine and is unlikely to do so in the future. Seventeen percent note their firm is not doing work related to extracting lithium from oil field brine but is somewhat likely to do so in the next five years. Five percent said their firm is doing work related to lithium extraction from oil field brine, and 6 percent said their firm is very likely to do work in this space over the next 5 years. A breakdown of the data by firm type can be found in the table below. (Percentages don’t sum to 100 due to rounding.)
| Response | Percent of respondents (among each group) | ||
| All firms | E&P | Services | |
| Yes, currently | 5 | 5 | 4 |
| No, but very likely to do so in the next five years | 6 | 3 | 11 |
| No, but somewhat likely to do so in the next five years | 17 | 10 | 29 |
| No, and not likely to do so | 73 | 81 | 56 |
| NOTE: Executives from 86 exploration and production firms and 45 oil and gas support services firms answered this question during the survey collection period, June 12–20, 2024.
SOURCE: Federal Reserve Bank of Dallas. |
|||
Exploration and production (E&P) firms
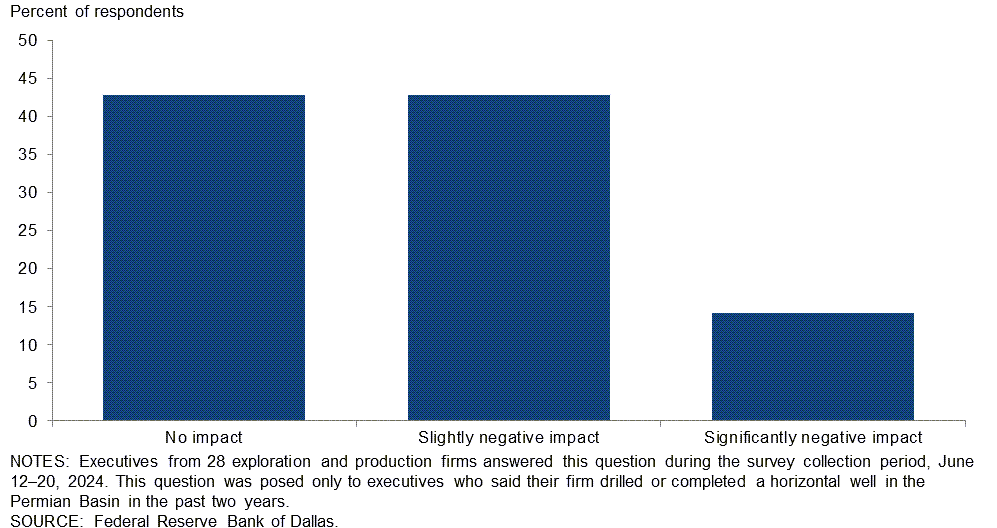
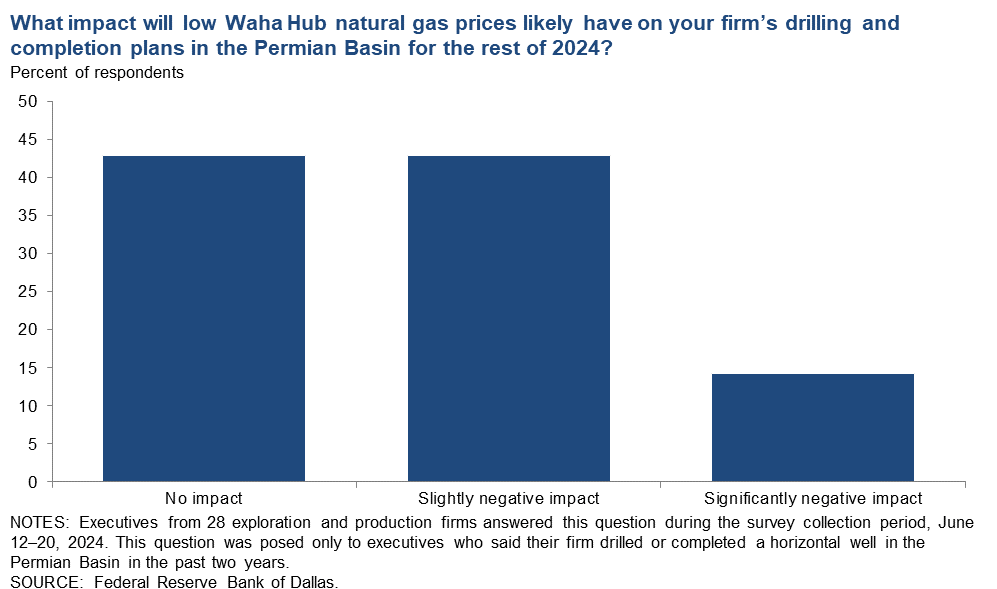
What impact will low Waha Hub natural gas prices likely have on your firm’s drilling and completion plans in the Permian for the rest of 2024?
The Waha Hub is a gathering location for natural gas in the Permian Basin that connects to major pipelines. Of the executives surveyed, 43 percent said low Waha Hub natural gas prices won’t likely affect their firm’s drilling and completion plans in the Permian for the rest of 2024. Meanwhile, 43 percent expect a slightly negative impact, and an additional 14 percent said the low Waha Hub prices will have a significantly negative impact on drilling and completion plans for the rest of this year in the Permian. Small E&P firms were more likely to expect negative impacts. A breakdown of the data is in the table below.
| Response | Percent of respondents (among each group) | ||
| All E&P | Large E&P | Small E&P | |
| No impact | 43 | 58 | 31 |
| Slightly negative impact | 43 | 33 | 50 |
| Significantly negative impact | 14 | 8 | 19 |
| NOTES: Executives from 28 exploration and production firms answered this question during the survey collection period, June 12–20, 2024. Responses came from 16 small firms and 12 large firms. This question was posed only to executives who said their firm drilled or completed a horizontal well in the Permian Basin in the past two years. SOURCE: Federal Reserve Bank of Dallas. |
|||
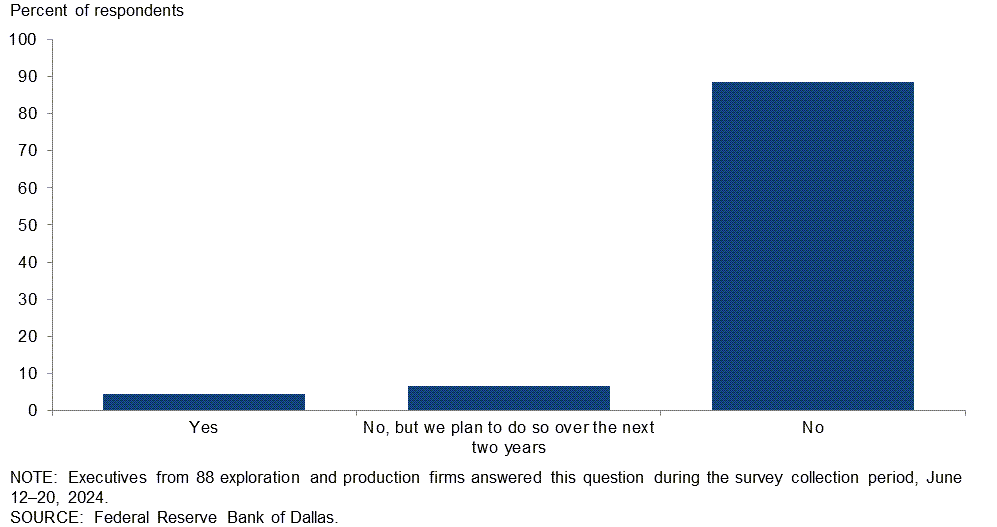
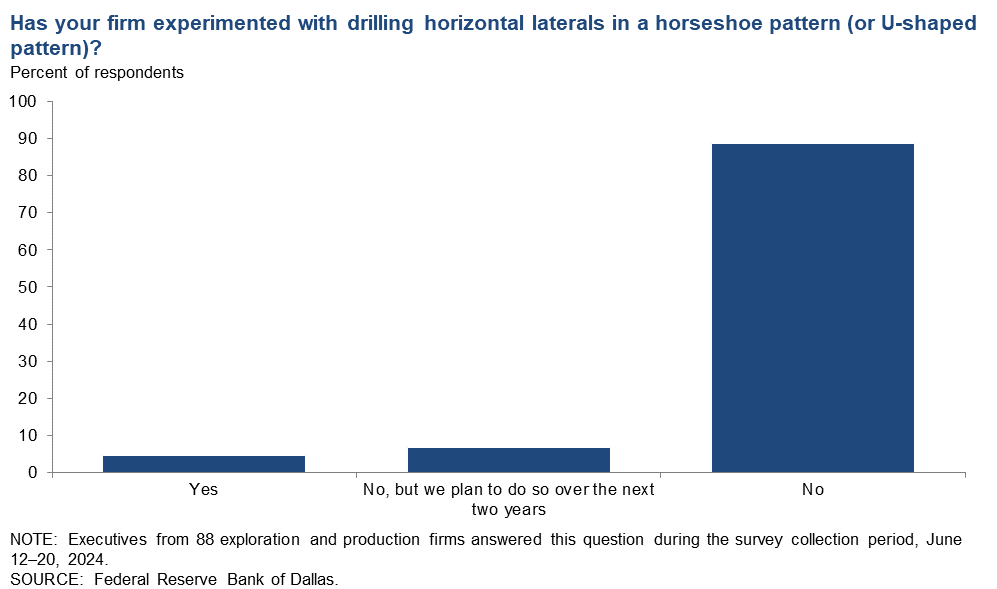
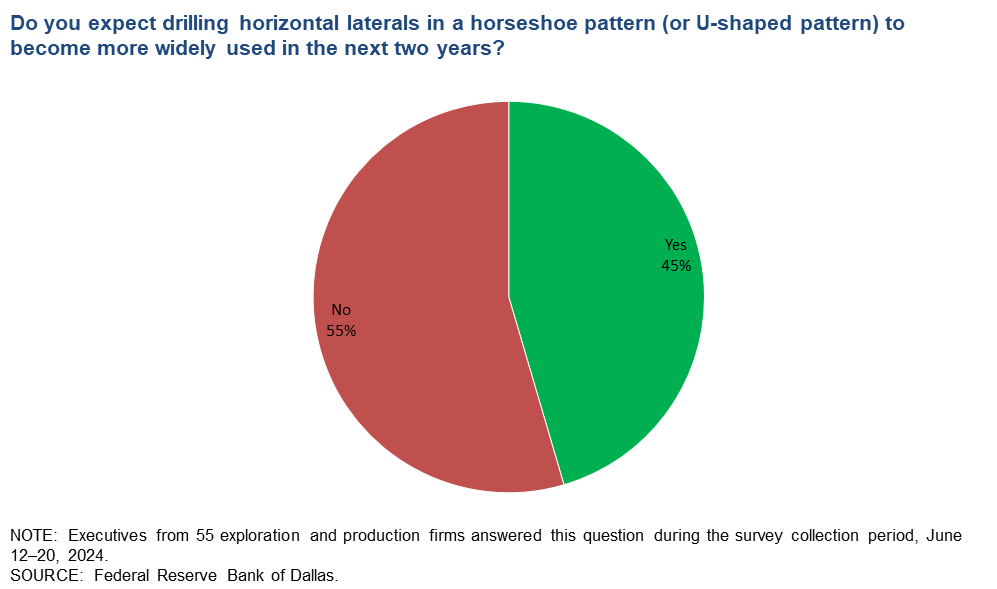
Has your firm experimented with drilling horizontal laterals in a horseshoe pattern (or U-shaped pattern)?
In specific drilling locations limited by the size of the acreage lease, drilling a horizontal lateral in a horseshoe pattern (or U-shaped pattern) provides the opportunity to drill a longer lateral while potentially saving time and reducing cost compared to drilling two wells with half the lateral length.
A majority of the executives surveyed, 89 percent, said their firm has not experimented with drilling horizontal laterals in a horseshoe pattern (or U-shaped pattern). Seven percent note their firm has not drilled a horizontal lateral in this pattern but plans to do so in the next two years. Five percent of executives said their firm has experimented with drilling horizontal laterals in a horseshoe pattern.
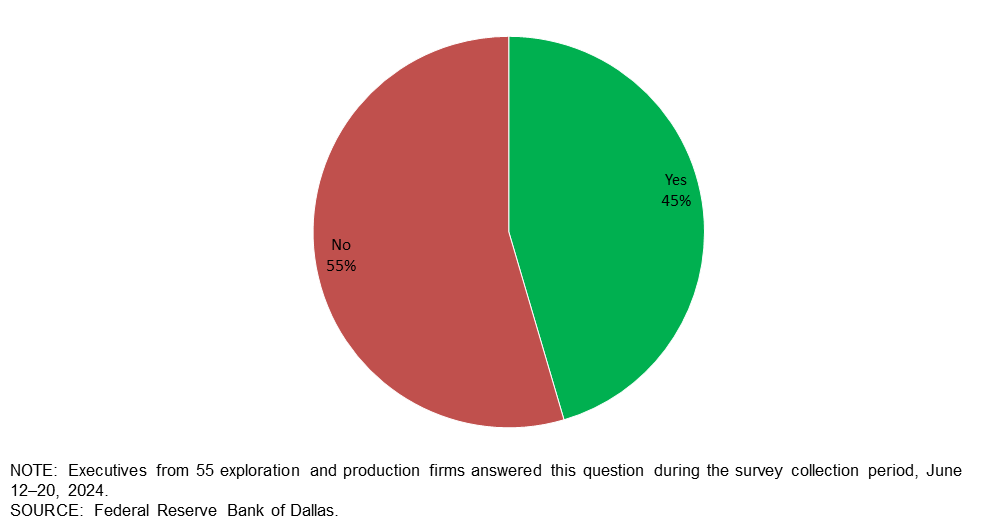
Do you expect drilling horizontal laterals in a horseshoe pattern (or U-shaped pattern) to become more widely used in the next two years?
Of the executives responding, 45 percent said they expect drilling horizontal laterals in a horseshoe pattern (or U-shaped pattern) to become more widely used in the next two years. The remaining 55 percent of executives don’t expect this to occur.
Oil and gas support services firms
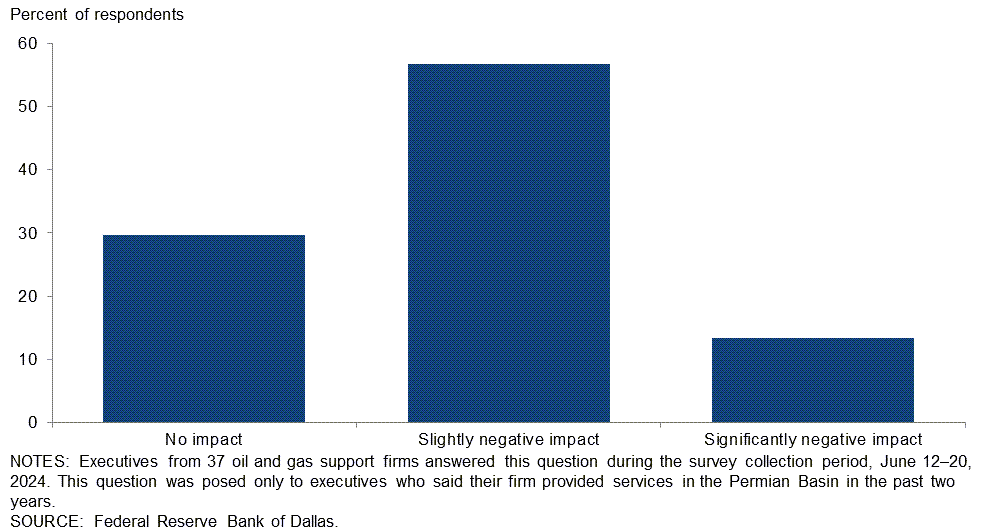
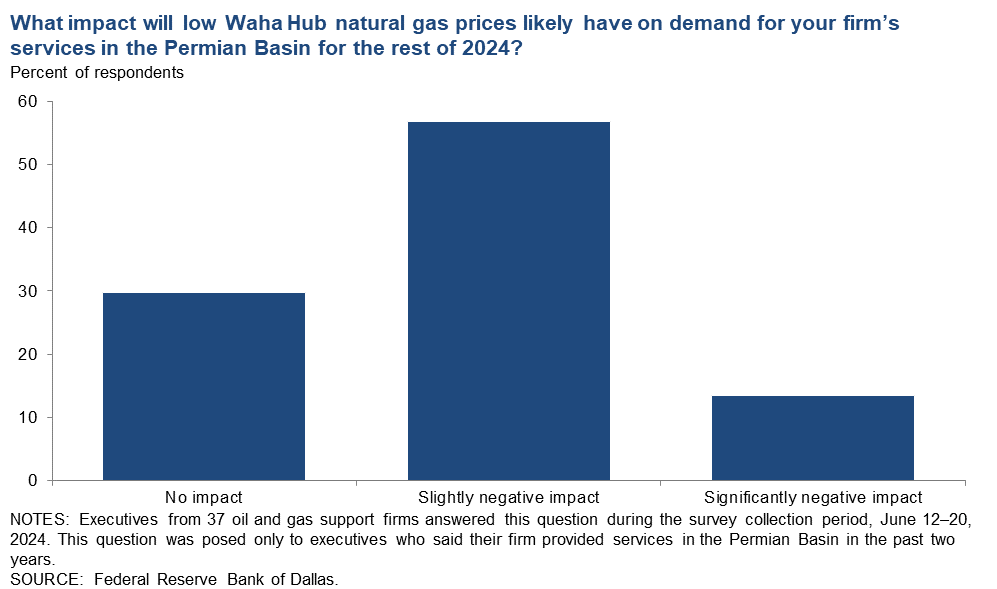
What impact will low Waha Hub natural gas prices likely have on demand for your firm’s services in the Permian for the rest of 2024?
The majority of executives surveyed, 57 percent, said low Waha Hub natural gas prices will likely have a slightly negative impact on demand for their firm’s services in the Permian Basin for the rest of 2024. Thirty percent note no impact, while 14 percent said the low Waha Hub prices will have a significantly negative impact on demand for their firm’s services in the basin for the rest of this year.
Special Questions Comments
Exploration and Production (E&P) Firms
- ERCOT’s West Texas region experienced new records in power consumption in May 2024, with power consumption well above last year's August peaks. This continues to suggest power costs will rise, and the availability of grid power will decline in the near-term years, as no new dispatchable power has been built in the West Texas region. Adding renewables is further disrupting grid stability for businesses that run consistently, 24 hours a day.
- Expensive U-shaped horizontal drilling will not be profitable under current market conditions and uncertainty.
Oil and Gas Support Services Firms
- We are just beginning to explore the full capabilities of artificial intelligence within our business. Within 12-18 months, we will utilize advanced analytics to create predictive models, automate decision-making and automate field operations as much as possible. Firms currently not exploring the capabilities of AI will soon struggle to compete on any metric other than price.
- Regarding AI, we try to understand and utilize the best technology and tools to advance our operations and the solutions we provide for our customers. We've migrated from statistical analysis to machine learning or basic AI, and we are now experimenting with generative and visual AI. We certainly see some opportunities to increase efficiencies of administrative tasks, and while we are in the early phases of experimentation, we see greater potential for improving internal business processes and our product offerings utilizing both generative and visual AI image recognition.
- E&P consolidation, the upcoming election, international turmoil and a lack of funding have made the oilfield services space challenging to survive, but we keep fighting on, hoping for a brighter future.
Additional Comments »
Historical data are available from first quarter 2016 to the most current release quarter.
Business Indicators: Quarter/Quarter
| Business Indicators: All Firms Current Quarter (versus previous quarter) | |||||
| Indicator | Current Index | Previous Index | % Reporting Increase | % Reporting No Change | % Reporting Decrease |
Level of Business Activity | 12.5 | 2.0 | 30.7 | 51.1 | 18.2 |
Capital Expenditures | 8.2 | 5.6 | 30.4 | 47.4 | 22.2 |
Supplier Delivery Time | –1.5 | –5.0 | 8.2 | 82.1 | 9.7 |
Employment | 2.9 | 3.4 | 15.3 | 72.3 | 12.4 |
Employee Hours | 8.1 | 6.9 | 18.4 | 71.3 | 10.3 |
Wages and Benefits | 24.0 | 32.8 | 25.5 | 73.0 | 1.5 |
| Indicator | Current Index | Previous Index | % Reporting Improved | % Reporting No Change | % Reporting Worsened |
Company Outlook | 10.0 | 12.0 | 29.2 | 51.5 | 19.2 |
| Indicator | Current Index | Previous Index | % Reporting Increase | % Reporting No Change | % Reporting Decrease |
Uncertainty | 24.1 | 24.1 | 33.6 | 56.9 | 9.5 |
| Business Indicators: E&P Firms Current Quarter (versus previous quarter) | |||||
| Indicator | Current Index | Previous Index | % Reporting Increase | % Reporting No Change | % Reporting Decrease |
Level of Business Activity | 14.5 | 4.2 | 27.8 | 58.9 | 13.3 |
Oil Production | 1.1 | –4.1 | 30.3 | 40.4 | 29.2 |
Natural Gas Wellhead Production | 2.3 | –17.0 | 25.0 | 52.3 | 22.7 |
Capital Expenditures | 10.2 | 0.0 | 31.8 | 46.6 | 21.6 |
Expected Level of Capital Expenditures Next Year | 16.9 | 36.5 | 36.0 | 44.9 | 19.1 |
Supplier Delivery Time | 1.1 | –7.5 | 9.1 | 83.0 | 8.0 |
Employment | 2.2 | 6.2 | 11.1 | 80.0 | 8.9 |
Employee Hours | 5.6 | 10.4 | 13.5 | 78.7 | 7.9 |
Wages and Benefits | 24.5 | 34.4 | 25.6 | 73.3 | 1.1 |
Finding and Development Costs | 15.7 | 24.2 | 25.8 | 64.0 | 10.1 |
Lease Operating Expenses | 23.6 | 33.7 | 31.5 | 60.7 | 7.9 |
| Indicator | Current Index | Previous Index | % Reporting Improved | % Reporting No Change | % Reporting Worsened |
Company Outlook | 16.8 | 15.6 | 32.5 | 51.8 | 15.7 |
| Indicator | Current Index | Previous Index | % Reporting Increase | % Reporting No Change | % Reporting Decrease |
Uncertainty | 18.9 | 21.1 | 30.0 | 58.9 | 11.1 |
| Business Indicators: O&G Support Services Firms Current Quarter (versus previous quarter) | |||||
| Indicator | Current Index | Previous Index | % Reporting Increase | % Reporting No Change | % Reporting Decrease |
Level of Business Activity | 8.5 | –2.0 | 36.2 | 36.2 | 27.7 |
Utilization of Equipment | 10.9 | –4.2 | 34.8 | 41.3 | 23.9 |
Capital Expenditures | 4.3 | 16.4 | 27.7 | 48.9 | 23.4 |
Supplier Delivery Time | –6.5 | 0.0 | 6.5 | 80.4 | 13.0 |
Lag Time in Delivery of Firm's Services | 4.4 | 4.0 | 13.3 | 77.8 | 8.9 |
Employment | 4.3 | –2.1 | 23.4 | 57.4 | 19.1 |
Employment Hours | 12.8 | 0.0 | 27.7 | 57.4 | 14.9 |
Wages and Benefits | 23.4 | 30.0 | 25.5 | 72.3 | 2.1 |
Input Costs | 42.2 | 31.2 | 44.4 | 53.3 | 2.2 |
Prices Received for Services | –4.4 | –6.2 | 13.0 | 69.6 | 17.4 |
Operating Margin | –13.0 | –35.4 | 19.6 | 47.8 | 32.6 |
| Indicator | Current Index | Previous Index | % Reporting Improved | % Reporting No Change | % Reporting Worsened |
Company Outlook | –2.1 | 4.5 | 23.4 | 51.1 | 25.5 |
| Indicator | Current Index | Previous Index | % Reporting Increase | % Reporting No Change | % Reporting Decrease |
Uncertainty | 34.0 | 30.0 | 40.4 | 53.2 | 6.4 |
Business Indicators: Year/Year
| Business Indicators: All Firms Current Quarter (versus same quarter a year ago) | |||||
| Indicator | Current Index | Previous Index | % Reporting Increase | % Reporting No Change | % Reporting Decrease |
Level of Business Activity | 16.7 | 1.5 | 45.5 | 25.8 | 28.8 |
Capital Expenditures | 10.1 | 7.7 | 41.1 | 27.9 | 31.0 |
Supplier Delivery Time | –5.4 | –12.8 | 14.6 | 65.4 | 20.0 |
Employment | 8.3 | 11.1 | 26.3 | 55.6 | 18.0 |
Employee Hours | 11.3 | 6.0 | 26.5 | 58.3 | 15.2 |
Wages and Benefits | 52.6 | 52.2 | 56.4 | 39.8 | 3.8 |
| Indicator | Current Index | Previous Index | % Reporting Improved | % Reporting No Change | % Reporting Worsened |
Company Outlook | 13.7 | 10.0 | 41.1 | 31.5 | 27.4 |
| Business Indicators: E&P Firms Current Quarter (versus same quarter a year ago) | |||||
| Indicator | Current Index | Previous Index | % Reporting Increase | % Reporting No Change | % Reporting Decrease |
Level of Business Activity | 18.6 | 7.8 | 43.0 | 32.6 | 24.4 |
Oil Production | 3.5 | –1.1 | 38.4 | 26.7 | 34.9 |
Natural Gas Wellhead Production | 2.3 | –18.4 | 34.9 | 32.6 | 32.6 |
Capital Expenditures | 1.2 | 2.3 | 33.3 | 34.5 | 32.1 |
Expected Level of Capital Expenditures Next Year | 10.3 | 26.1 | 37.9 | 34.5 | 27.6 |
Supplier Delivery Time | –7.0 | –18.4 | 11.8 | 69.4 | 18.8 |
Employment | 5.8 | 13.5 | 20.7 | 64.4 | 14.9 |
Employee Hours | 6.9 | 10.2 | 17.4 | 72.1 | 10.5 |
Wages and Benefits | 51.7 | 52.2 | 54.0 | 43.7 | 2.3 |
Finding and Development Costs | 11.6 | 28.0 | 30.2 | 51.2 | 18.6 |
Lease Operating Expenses | 38.0 | 38.6 | 50.6 | 36.8 | 12.6 |
| Indicator | Current Index | Previous Index | % Reporting Improved | % Reporting No Change | % Reporting Worsened |
Company Outlook | 15.0 | 14.4 | 40.0 | 35.0 | 25.0 |
| Business Indicators: O&G Support Services Firms Current Quarter (versus same quarter a year ago) | |||||
| Indicator | Current Index | Previous Index | % Reporting Increase | % Reporting No Change | % Reporting Decrease |
Level of Business Activity | 13.0 | –11.1 | 50.0 | 13.0 | 37.0 |
Utilization of Equipment | 9.1 | –11.1 | 45.5 | 18.2 | 36.4 |
Capital Expenditures | 26.7 | 18.6 | 55.6 | 15.6 | 28.9 |
Supplier Delivery Time | –2.2 | –2.2 | 20.0 | 57.8 | 22.2 |
Lag Time in Delivery of Firm's Services | 6.8 | 6.7 | 18.2 | 70.5 | 11.4 |
Employment | 13.1 | 6.6 | 37.0 | 39.1 | 23.9 |
Employment Hours | 19.6 | –2.2 | 43.5 | 32.6 | 23.9 |
Wages and Benefits | 54.4 | 52.2 | 60.9 | 32.6 | 6.5 |
Input Costs | 66.6 | 71.2 | 69.0 | 28.6 | 2.4 |
Prices Received for Services | 11.4 | 13.3 | 34.1 | 43.2 | 22.7 |
Operating Margin | –15.9 | –35.6 | 27.3 | 29.5 | 43.2 |
| Indicator | Current Index | Previous Index | % Reporting Improved | % Reporting No Change | % Reporting Worsened |
Company Outlook | 11.4 | 2.2 | 43.2 | 25.0 | 31.8 |
Activity Chart
Comments from Survey Respondents
These comments are from respondents’ completed surveys and have been edited for publication. Comments from the Special Questions survey can be found below the special questions.
Exploration and Production (E&P) Firms
- The LNG (liquefied natural gas) pause is a cause for concern. Another concern is how increased electricity demand will be met due to the increasing use of artificial intelligence and data center growth. Also, efficiency gains in capital spending have led to record production with fewer rigs, fracking operations and employees. However, rising operating costs is a major concern due to minimal efficiency improvements. The industry needs a step-change, sustainable reduction in operating costs.
- Potential financial assurance bonding requirements are a concern for our business.
- Regulations continue to take a toll. SEC (Securities and Exchange Commission) climate disclosure proposals, the Environmental Protection Agency Quad Ob/c and the revised Clean Power Plan raise our costs and burden of compliance.
- Permitting and bureaucratic or political roadblocks are the greatest impairments to our business currently.
- Operating expenses continue to escalate, and the lack of availability of experienced people is a real challenge.
- Politically driven environmental regulations have caused increased upstream costs of operating, securing drilling and development permits, etc. Intermediate and long-term cost of capital is becoming more difficult to forecast. Geopolitical risk continues to increase.
- Electricity costs are increasing and will continue to increase due to the need to decrease field combustion and methane emissions. Our transmission and distribution provider will continue to be a bottleneck to the electrification of field operations.
- Overregulation of our industry by the federal government is hurting our economy.
- Candidate Trump has promised to lower the price of oil. He may again seek the help of Saudi Arabia to do this. If so, then I will expect a lower oil price and another recession in the U.S. oil patch.
- New Mexico and U.S. government increased restrictions and regulations are affecting our business
- New regulations prevent short- and long-term planning on every level of business investment.
- Uncertainty of the economy's direction makes it a real challenge in making company policy.
- Increasing regulatory constraint has increased expenses. Unless there is a change in Washington along with a change in attitude, the outlook for my business is definitely on the downswing.
- Natural gas prices are improving, and therefore cash flow is forecasted to improve. We are seeing more authorization-for-expenditure for drilling in-fill wells, which had been stalled for the past year or two.
- WTI (West Texas Intermediate) crude and Henry Hub natural gas pricing directly affects our business as we are operating existing wells and providing cash flow to investors. The prior quarter saw a significant improvement to Henry Hub natural gas pricing and also a more stable oil market that exceeded expectations at the end of the last quarter for this quarter of pricing.
- I hate to sound like a broken record, but federal intervention in the energy markets has confused everyone. Raising capital is really tough when so much uncertainty is being injected into the market. The constant drone of ''we don't need fossil fuels'' is taking its toll, the effects of which will someday be realized by the market, and it won't be pretty. The new methane tax is another headwind which will be absorbed by the producer. What a lot of people don't realize is that we are in a business which cannot simply pass on the additional costs to consumers. This is how you lose a very important segment of the energy supply chain, because they simply go out of business. The long-term economic impact of market interference will, in time, destabilize the overall economy.
- The last few years of mergers and acquistions have decreased activity in the oil patch. The majors are not going to exhaust reserves to raise domestic production until supply and demand curves meet their goals. They do not have to participate in treadmill drilling to keep incomes at a pace to develop reserves and pay back loans.
Oil and Gas Support Services Firms
- Industry consolidation is the main driver of change in the industry currently. Many competitors are extremely consolidated in their work profile and customer base. As consolidation occurs, often the acquiring company will not pick up the existing service companies. Once cut loose, these companies are searching for a lifeline and in many instances willing to work for negative margin rates, doing whatever they can to put money toward fixed period costs. We are experiencing very little flexibility in pricing to drive margin growth.
- Political and policy uncertainty remains the largest obstacle for the oil and gas industry. Our customers continue to defer or cancel planned drilling programs due to ongoing impacts of the stranded associated natural gas production in West Texas. Additionally, oil and gas operator consolidation is squeezing an over-supplied vendor market for all services, which will require consolidation or extensive bankruptcy in the vendor pool to rightsize the market. While this consolidation is ultimately good for the consumer as the larger oil companies operate much more efficiently, the service companies will suffer until the service market shrinks to match fewer operators more efficiently operating. Unfortunately, economics 101 is at play for the oil and gas service industry.
- Consolidation by E&P firms has curtailed investment in exploration. Our hope is that it’s a temporary situation that will work itself out as the integration is completed.
- North American onshore activity is flat, with all growth in activity coming from international offshore.
- The uncertainty of regulatory policy between the Democratic and Republican parties makes us stop new capital spending commitments. Lead times and costs for electrical components needed for “the electrification of everything” increased dramatically. Regulatory bottlenecks in Texas with the Electric Reliability Council of Texas, the Public Utility Commission and utility reviews have dramatically stymied timely development of much needed electrical infrastructure.
- Consolidation of the E&P sector in the Permian Basin continues to impact our business. Too many equipment providers are chasing too few E&P customers. Without consolidation within service or equipment providers, it will be a race to the bottom for pricing. The continued approval of these mergers by the Federal Trade Commission is surprising and will ultimately harm the Permian Basin.
- Our business, as oil and gas service companies, saw rollover business from the fourth quarter of 2023 being completed in the first quarter of 2024, which kept our numbers fairly constant. Toward the end of that quarter and throughout the second quarter, however, it seems there was an overall pullback of business as our customers were uncertain what the balance of 2024 was going to be like, especially with the upcoming election. There is still a prevailing feeling that this administration does not fully understand our business or the ramifications the policies they are pushing will have on the overall economy, not only in the short term but for years to come. Fossil fuels have been around for ages, and to think you can make this type of sweeping change virtually overnight is not only shortsighted, but next to impossible. I can only speak for our infinitesimal part of the industry, but the word of the day should be compromise, not utter destruction.
- Low natural gas prices and increasing consolidation of E&P companies combined with fiscal discipline on their part is leading to a decreased rig count as the second quarter of 2024 plays out.
- Activity and activity outlook have increased for the second half of 2024 versus the first half of 2024, but levels are still less than the first half of 2023. We are looking forward to the divestiture of non-core assets resulting from the M&A bonanza, but we don't expect those deals to result in new work with smaller operators until 2025.
- While business is still improving, North America continues to slow, which is more than offset by better activity in international and offshore markets.
- Our land and title services are fully contracted.
Questions regarding the Dallas Fed Energy Survey can be addressed to Michael Plante at Michael.Plante@dal.frb.org or Kunal Patel at Kunal.Patel@dal.frb.org.
Sign up for our email alert to be automatically notified as soon as the latest Dallas Fed Energy Survey is released on the web.