Dallas Fed Energy Survey

Oil and Gas Activity Continues Expanding; Outlook Improves Further
Special questions this quarter ask about expectations for a global crude oil supply gap, current and expected investments in renewables by oil and gas firms, firm-level cybersecurity, and the relative effectiveness of a carbon tax versus tax credits in reducing emissions.
Activity in the oil and gas sector continued growing strongly in second quarter 2021, according to oil and gas executives responding to the Dallas Fed Energy Survey. The business activity index—the survey’s broadest measure of conditions facing Eleventh District energy firms—remained elevated at 53.0, essentially unchanged from its first-quarter reading.
Oil and gas production increased, according to executives at exploration and production (E&P) firms. The oil production index rose from 16.3 in the first quarter to 35.0 in the second quarter—its second-highest reading since the survey’s inception in 2016. Similarly, the natural gas production index increased 19 points to 35.0.
The index for capital expenditures increased from 31.0 to 42.4, indicating an acceleration in capital spending among E&P firms. Additionally, the index for the expected level of capital expenditures next year came in at 53.0, up from 49.5 in the first quarter.
Costs are rising. Among oilfield services firms, the index for input costs rose notably, from 36.0 to 56.0—a record high and suggestive of significant cost pressures. No oilfield services firms reported a decrease in input costs this quarter. Among E&P firms, the index for finding and development costs jumped from 3.9 in the first quarter to 28.3 in the second. Additionally, the index for lease operating expenses also increased, from -5.9 to 23.4.
Oilfield services firms reported improvement across all indicators. The equipment utilization index remained positive, though slipping from 63.2 in the first quarter to 42.0 in the second. Operating margins improved further, with the index increasing from 14.0 to 22.5. The index of prices received for services rose from 20.0 to 30.0.
The aggregate employment index posted a second consecutive positive reading, edging up from 8.4 to 9.9. Employment growth continues to be driven primarily by oilfield services firms. The employment index was 25.5 for services firms versus 2.0 for E&P firms. The aggregate employee hours index edged up from 22.8 to 24.0. The aggregate wages and benefits index also increased, from 14.8 to 20.6.
Six-month outlooks improved notably, with the index moving up from 70.6 last quarter to 71.9—the highest reading in the survey’s five-year history. While uncertainty continued to decline, the aggregate index increased three points to -19.6.
On average, respondents expect a West Texas Intermediate (WTI) oil price of $70 per barrel by year-end 2021; responses ranged from $49 to $85 per barrel. Survey participants expect Henry Hub natural gas prices of $3.10 per million British thermal units (MMBtu) at year-end. For reference, WTI spot prices averaged $71 per barrel during the survey collection period, and Henry Hub spot prices averaged $3.24 per MMBtu.
Next release: September 29, 2021
Data were collected March 10–18, and 155 energy firms responded. Of the respondents, 104 were exploration and production firms and 51 were oilfield services firms.
Data were collected June 9–17, and 152 energy firms responded. Of the respondents, 101 were exploration and production firms and 51 were oilfield services firms.
The Dallas Fed conducts the Dallas Fed Energy Survey quarterly to obtain a timely assessment of energy activity among oil and gas firms located or headquartered in the Eleventh District. Firms are asked whether business activity, employment, capital expenditures and other indicators increased, decreased or remained unchanged compared with the prior quarter and with the same quarter a year ago. Survey responses are used to calculate an index for each indicator. Each index is calculated by subtracting the percentage of respondents reporting a decrease from the percentage reporting an increase. When the share of firms reporting an increase exceeds the share reporting a decrease, the index will be greater than zero, suggesting the indicator has increased over the previous quarter. If the share of firms reporting a decrease exceeds the share reporting an increase, the index will be below zero, suggesting the indicator has decreased over the previous quarter.
Price Forecasts
West Texas Intermediate Crude
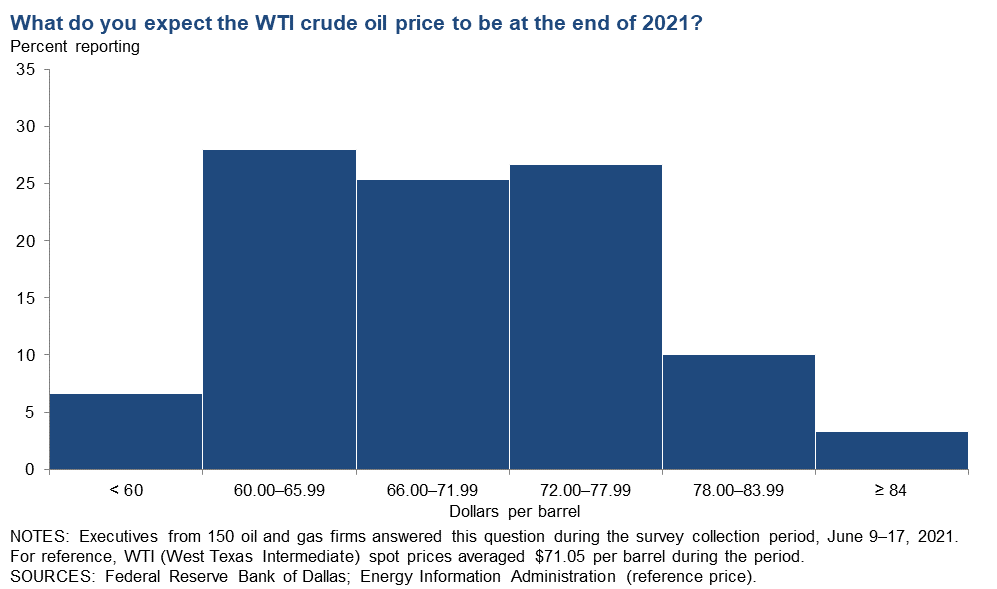
| West Texas Intermediate crude oil price (dollars per barrel), year-end 2022 | ||||
| Indicator | Survey Average | Low Forecast | High Forecast | Price During Survey |
Current quarter | $69.71 | $49.00 | $85.00 | $71.05 |
Prior quarter | $61.13 | $45.00 | $85.00 | $64.39 |
| NOTE: Price during survey is an average of daily spot prices during the survey collection period. SOURCES: Energy Information Administration; Federal Reserve Bank of Dallas. | ||||
Henry Hub Natural Gas
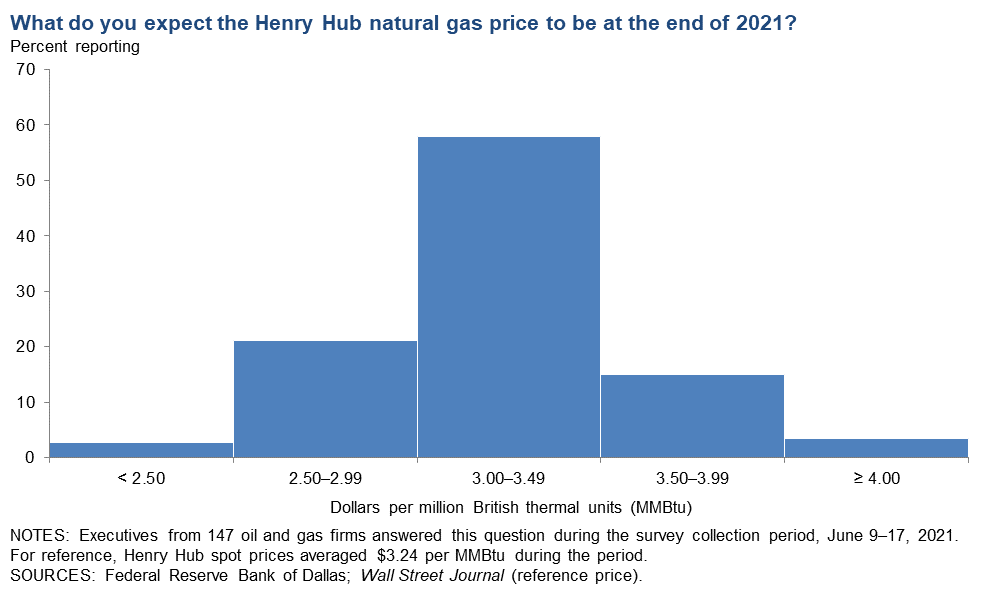
| Henry Hub natural gas price (dollars per MMBtu), year-end 2022 | ||||
| Indicator | Survey Average | Low Forecast | High Forecast | Price During Survey |
Current quarter | $3.10 | $2.20 | $5.00 | $3.24 |
Prior quarter | $2.80 | $2.00 | $4.00 | $2.59 |
| NOTE: Price during survey is an average of daily spot prices during the survey collection period. SOURCES: Federal Reserve Bank of Dallas; Wall Street Journal. | ||||
Special Questions
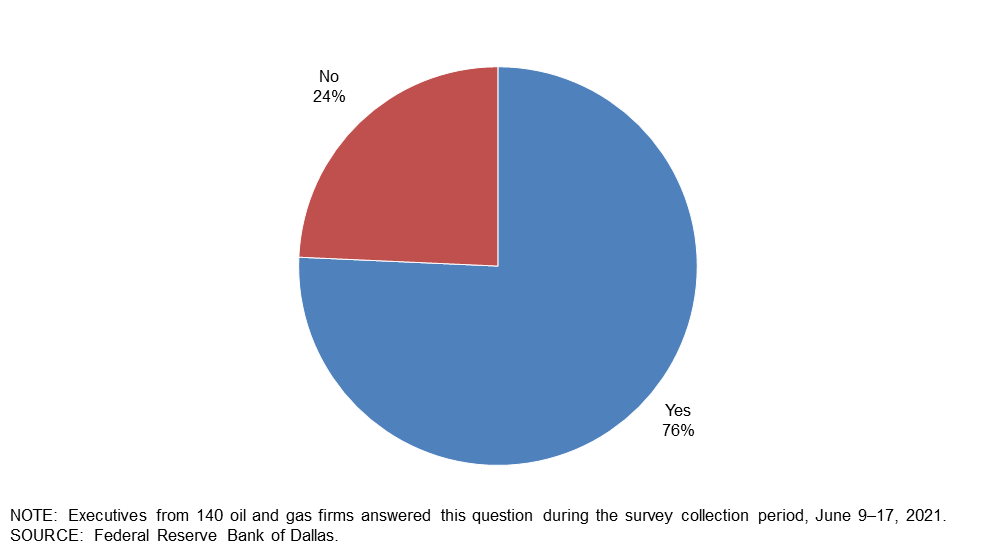
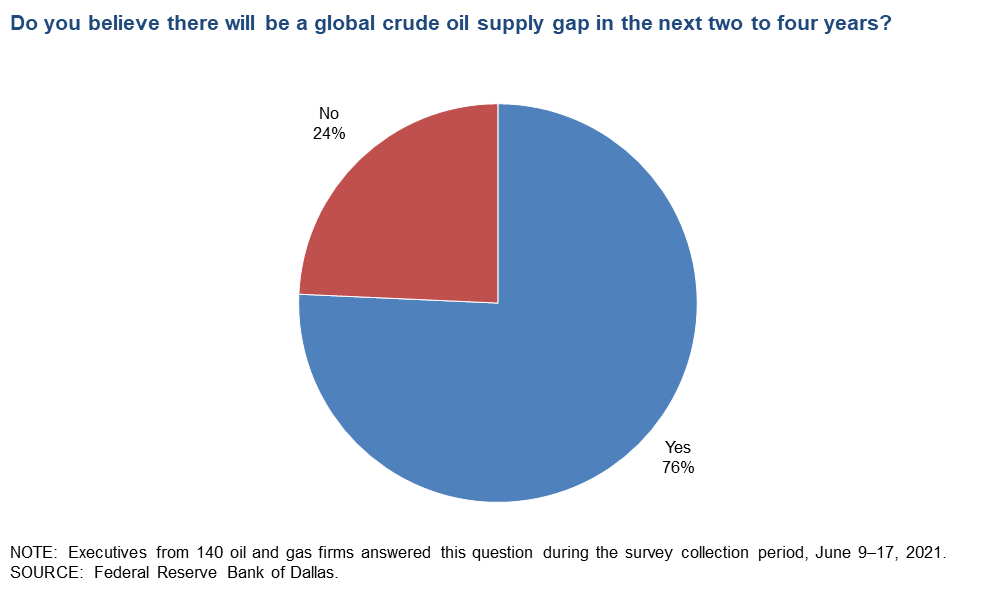
Data were collected June 9–17; 152 oil and gas firms responded to the special questions survey.
Do you believe there will be a global crude oil supply gap in the next two to four years?
Seventy-six percent of executives said they believe there will be a global crude oil supply gap in the next two to four years.
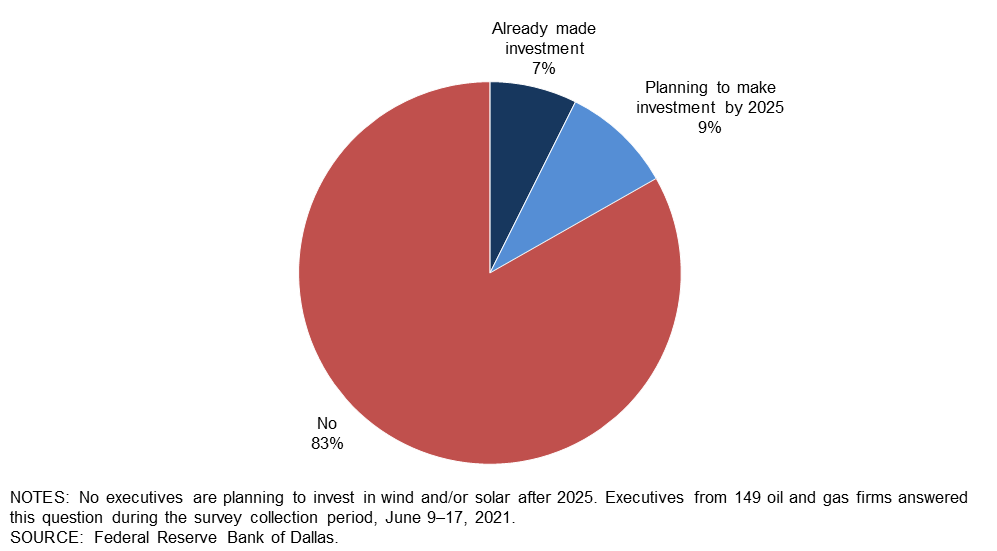
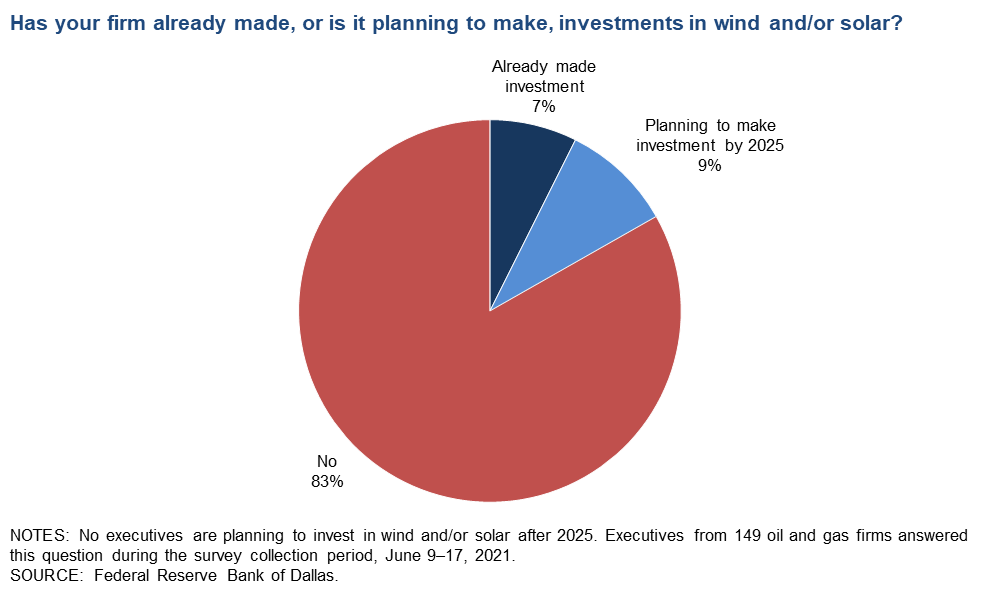
Has your firm already made, or is it planning to make, investments in wind and/or solar?
The majority of the executives—83 percent—said they don’t have investments in wind and/or solar. Seven percent note they already have an investment, and 9 percent are planning to make an investment by 2025. (Percentages don’t sum to 100 due to rounding.)
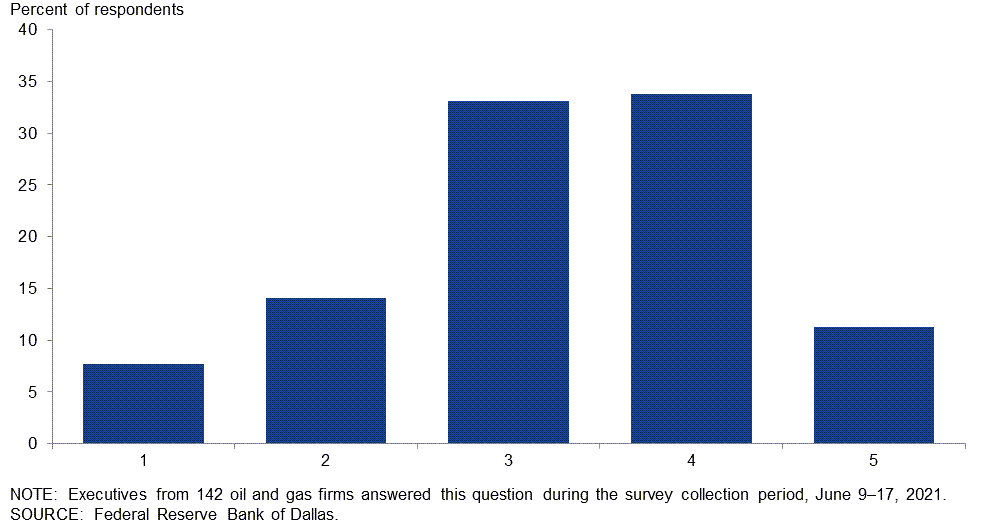
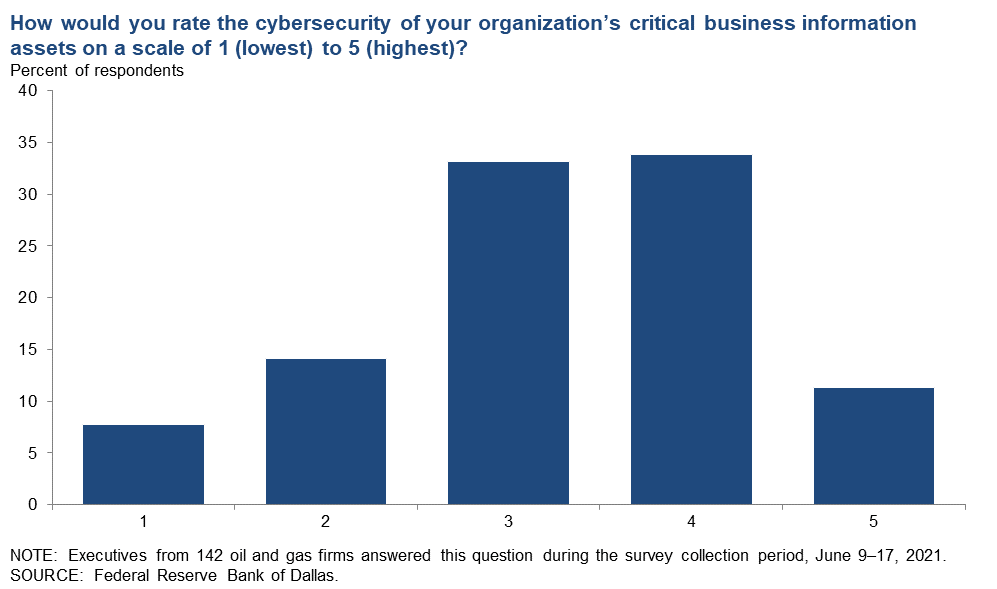
How would you rate the cybersecurity of your organization’s critical business information assets on a scale of 1 (lowest) to 5 (highest)?
The most-selected responses were 4, chosen by 34 percent of executives, and 3, chosen by 33 percent. Next were 2, chosen by 14 percent; 5, chosen by 11 percent; and 1, chosen by 8 percent. The average across all responses was 3.3.
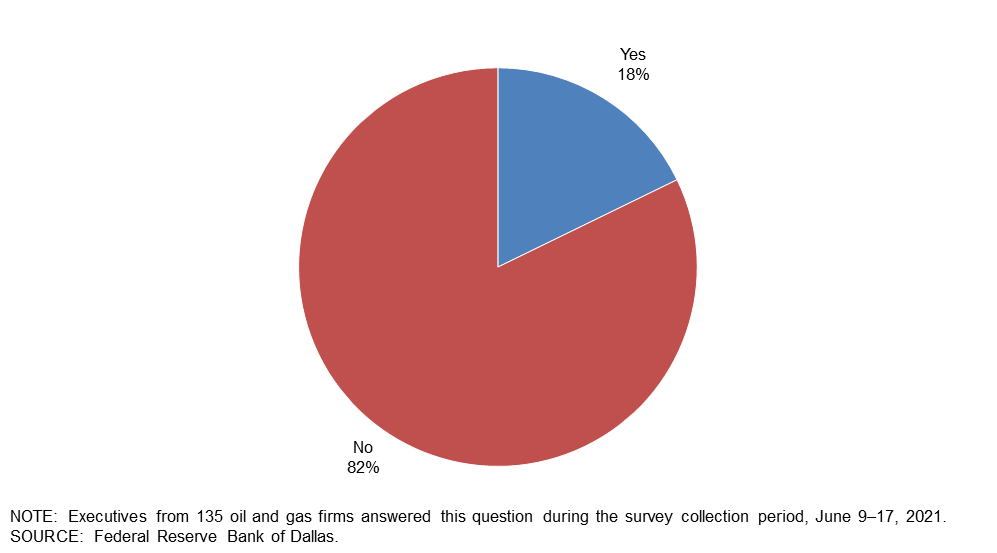
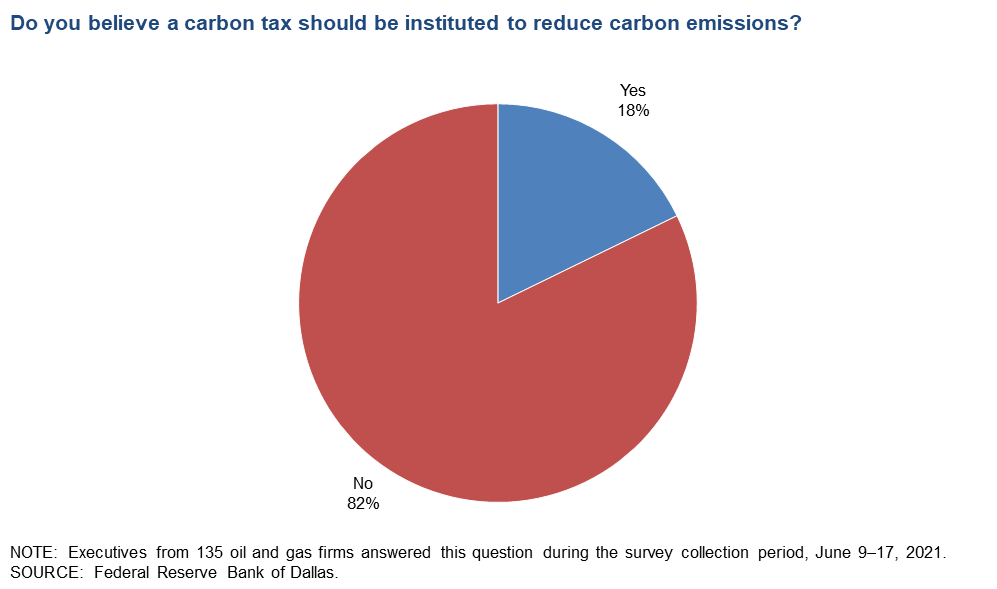
Do you believe a carbon tax should be instituted to reduce carbon emissions?
Eighty-two percent of executives believe a carbon tax shouldn’t be instituted to reduce carbon emissions. The remaining 18 percent believe a carbon tax should be instituted for that purpose.
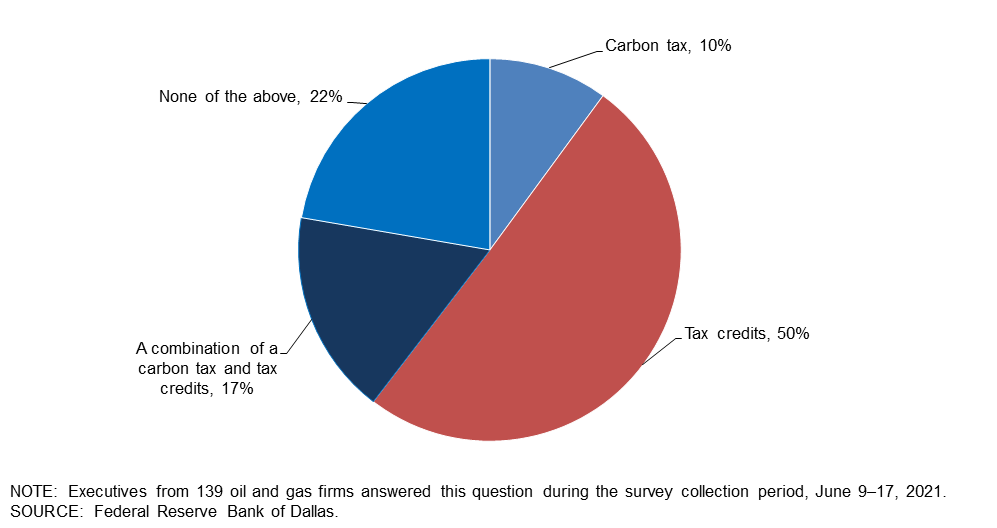
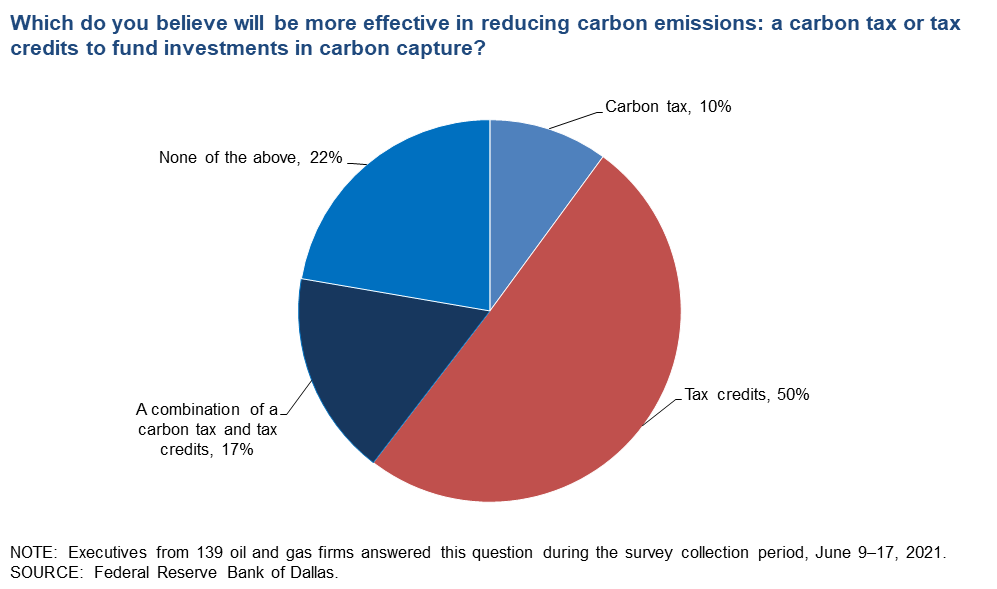
Which do you believe will be more effective in reducing carbon emissions: a carbon tax or tax credits to fund investments in carbon capture?
Fifty percent of executives believe tax credits to fund investments in carbon capture will be more effective in reducing carbon emissions than a carbon tax. Ten percent believe a carbon tax will be more effective. Those who did not choose between the options were allowed to answer “None of the above” (22 percent) or “A combination of a carbon tax and tax credits” (17 percent). (Percentages don’t sum to 100 due to rounding.)
Special Questions Comments
Exploration and Production (E&P) Firms
- I’m extremely curious about the western world’s reaction if carbon capture and sequestration (CCS) become viable at scale. I believe there is a (negative) visceral reaction to the oil and gas industry at large in the western world. If CCS works at scale, does the negative sentiment around the traditional energy sector abate? I’m skeptical.
- We will likely be investing in natural gas co-generation facilities to sell electricity and for carbon capture for reinjection to enhance recovery. Solar and wind are not competitive with our other options. Tax credits and a carbon tax are both effective tools, but the current political tenor, which is effectively bashing oil and gas entities in all aspects while showering grants, tax benefits and other subsidies on perceived “green” energies, is not a good step. The very entities that can have an immediate and permanent effect on capturing, reinjection and sequestration are the ones being bashed daily. A cooperative approach, bringing incentives to all industries to “green up” a bit, is an approach that most would approve. All modeling shows natural gas and oil play an important part in any future energy supply for the country and for the world. Our industry should be partners in the “greening” process and be encouraged rather than bashed at all opportunities.
- Labor and capital will be the critical limitations on U.S. producers’ ability to grow oil production.
- Investors want to say they are contrarian, but they follow the herd. The amount of money being thrown at renewables will crater the price of another commodity (electricity). Intermittency makes these electrons lower value than dispatchable electrons. Areas of high wind and solar resources are large distances from population centers, with no transmission. Think of the economic rent extracted by pipelines in the Marcellus or trains in North Dakota to get the product to market. Wholesale electric prices are already negative sometimes in the wind corridor of West Texas and Oklahoma. How, you might ask? Production tax credits incentivize producers to pay someone to take the electricity, so they get the tax credit. Economics!
- Carbon taxes, tax credits and the like are just taxes. It’s politics and does nothing except to give the politicians more power.
- Why do specific members of the government continue to fly their private jets but at the same time promote the Green New Deal [climate change proposals]. When they demonstrate to the public that they are not using jet fuel and gasoline completely, then they can promote wind and solar. Isn’t it kind of hard to fly an airplane on wind or solar? Oil has more energy than wind and solar. I am not against wind and solar but do realize that the public is not willing to give up the consumption they use in oil. Can they live without their cellphones, clothes and cars which rely heavily on oil and gas? No, the public cannot give that up easily. Natural gas is a clean fuel, and if you get rid of oil, then you need gas to fuel the electric grid.
- I haven’t seen a good plan on a rollout of a “carbon tax”—i.e., how it would be applied, what industries, what levels, who collects it, who administers it, who actually pays for it and where, and what will become of the tremendous funds collected. Logic says the most ineffective player (U.S. government) will be the collector, with the leakage spilling out to fund political action groups that have absolutely no connection to energy in the first place. Otherwise, the smallest carbon tax pricing I’ve seen in the press has been only $25.00 per ton of CO2 emissions equivalent. Further readings indicate this converts to approximately $10.75 per barrel, considering a range of U.S.-produced crude oils. I have seen some politicians proposing a $60.00 or more per-ton initial carbon tax, with annual escalations. That’s $25.80 per barrel if assessed at the wellhead for U.S. production. What a great way to absolutely cripple the U.S. oil and gas industry. Question: How many of our economic competitor nations around the world will willingly shoot themselves in the foot with a carbon tax like this and yet, simultaneously, try to compete against China, India and Russia? Are they going to do this to themselves? You know the answer is no.
- Global warming is a tool for control and taxation. The earth is not running on a thermostat. It’s dynamic. If carbon increases in the air, then plants will benefit and increase the oxygen in the air.
- Once the consumer is confronted with the cost of carbon emission in daily life, there will be real progress in making the energy transition to lower-carbon fuels. Simply trying to choke off supply by regulation and fiat will not provide a sustainable solution.
Oil and Gas Support Services Firms
- I have worked in the upstream segment of the E&P industry for 35 years and have worked on several CO2 tertiary floods during that period. Most of us in the technical side of the business recognize carbon capture exists somewhere between difficult-to-implement and a complete charade.
- The climate targets set by the U.S. government are completely unrealistic. There will be more internal combustion engine vehicles on the road in 2030 than there are now. There is no way we can hit the 2030 target. The U.S. public will reject the Green New Deal as soon as they understand the personal impact to them in transportation, home utilities, cost inflation, etc.
Additional Comments »
Historical data are available from first quarter 2016 to the most current release quarter.
Business Indicators: Quarter/Quarter
| Business Indicators: All Firms Current Quarter (versus previous quarter) | |||||
| Indicator | Current Index | Previous Index | % Reporting Increase | % Reporting No Change | % Reporting Decrease |
Level of Business Activity | 53.0 | 53.6 | 58.3 | 36.4 | 5.3 |
Capital Expenditures | 36.6 | 30.0 | 47.3 | 42.0 | 10.7 |
Supplier Delivery Time | 7.3 | 7.8 | 21.3 | 64.7 | 14.0 |
Employment | 9.9 | 8.4 | 20.5 | 68.9 | 10.6 |
Employee Hours | 24.0 | 22.8 | 28.0 | 68.0 | 4.0 |
Wages and Benefits | 20.6 | 14.8 | 25.2 | 70.2 | 4.6 |
| Indicator | Current Index | Previous Index | % Reporting Improved | % Reporting No Change | % Reporting Worsened |
Company Outlook | 71.9 | 70.6 | 78.2 | 15.5 | 6.3 |
| Indicator | Current Index | Previous Index | % Reporting Increase | % Reporting No Change | % Reporting Decrease |
Uncertainty | –19.6 | –22.2 | 23.6 | 33.1 | 43.2 |
| Business Indicators: E&P Firms Current Quarter (versus previous quarter) | |||||
| Indicator | Current Index | Previous Index | % Reporting Increase | % Reporting No Change | % Reporting Decrease |
Level of Business Activity | 50.0 | 47.1 | 55.0 | 40.0 | 5.0 |
Oil Production | 35.0 | 16.3 | 44.0 | 47.0 | 9.0 |
Natural Gas Wellhead Production | 35.0 | 15.9 | 43.0 | 49.0 | 8.0 |
Capital Expenditures | 42.4 | 31.0 | 51.5 | 39.4 | 9.1 |
Expected Level of Capital Expenditures Next Year | 53.0 | 49.5 | 59.0 | 35.0 | 6.0 |
Supplier Delivery Time | 4.0 | 4.8 | 18.0 | 68.0 | 14.0 |
Employment | 2.0 | 1.0 | 13.0 | 76.0 | 11.0 |
Employee Hours | 12.0 | 11.6 | 17.0 | 78.0 | 5.0 |
Wages and Benefits | 17.0 | 7.7 | 20.0 | 77.0 | 3.0 |
Finding and Development Costs | 28.3 | 3.9 | 32.3 | 63.6 | 4.0 |
Lease Operating Expenses | 23.4 | –5.9 | 31.6 | 60.2 | 8.2 |
| Indicator | Current Index | Previous Index | % Reporting Improved | % Reporting No Change | % Reporting Worsened |
Company Outlook | 71.3 | 69.6 | 77.7 | 16.0 | 6.4 |
| Indicator | Current Index | Previous Index | % Reporting Increase | % Reporting No Change | % Reporting Decrease |
Uncertainty | –22.7 | –21.4 | 23.7 | 29.9 | 46.4 |
| Business Indicators: O&G Support Services Firms Current Quarter (versus previous quarter) | |||||
| Indicator | Current Index | Previous Index | % Reporting Increase | % Reporting No Change | % Reporting Decrease |
Level of Business Activity | 58.8 | 66.7 | 64.7 | 29.4 | 5.9 |
Utilization of Equipment | 42.0 | 63.2 | 52.0 | 38.0 | 10.0 |
Capital Expenditures | 25.5 | 28.0 | 39.2 | 47.1 | 13.7 |
Supplier Delivery Time | 14.0 | 14.3 | 28.0 | 58.0 | 14.0 |
Lag Time in Delivery of Firm's Services | 10.2 | 18.8 | 18.4 | 73.5 | 8.2 |
Employment | 25.5 | 23.5 | 35.3 | 54.9 | 9.8 |
Employment Hours | 48.0 | 45.1 | 50.0 | 48.0 | 2.0 |
Wages and Benefits | 27.5 | 29.4 | 35.3 | 56.9 | 7.8 |
Input Costs | 56.0 | 36.0 | 56.0 | 44.0 | 0.0 |
Prices Received for Services | 30.0 | 20.0 | 30.0 | 70.0 | 0.0 |
Operating Margin | 22.5 | 14.0 | 34.7 | 53.1 | 12.2 |
| Indicator | Current Index | Previous Index | % Reporting Improved | % Reporting No Change | % Reporting Worsened |
Company Outlook | 72.9 | 72.6 | 79.2 | 14.6 | 6.3 |
| Indicator | Current Index | Previous Index | % Reporting Increase | % Reporting No Change | % Reporting Decrease |
Uncertainty | –13.8 | –24.0 | 23.5 | 39.2 | 37.3 |
Business Indicators: Year/Year
| Business Indicators: All Firms Current Quarter (versus same quarter a year ago) | |||||
| Indicator | Current Index | Previous Index | % Reporting Increase | % Reporting No Change | % Reporting Decrease |
Level of Business Activity | 68.1 | 17.3 | 78.0 | 12.1 | 9.9 |
Capital Expenditures | 46.5 | 8.7 | 60.6 | 25.4 | 14.1 |
Supplier Delivery Time | 20.7 | 9.0 | 36.4 | 47.9 | 15.7 |
Employment | 6.4 | –16.7 | 29.6 | 47.2 | 23.2 |
Employee Hours | 29.0 | 2.1 | 42.0 | 44.9 | 13.0 |
Wages and Benefits | 29.8 | –2.0 | 41.1 | 47.5 | 11.3 |
| Indicator | Current Index | Previous Index | % Reporting Improved | % Reporting No Change | % Reporting Worsened |
Company Outlook | 84.4 | 53.6 | 89.1 | 6.3 | 4.7 |
| Business Indicators: E&P Firms Current Quarter (versus same quarter a year ago) | |||||
| Indicator | Current Index | Previous Index | % Reporting Increase | % Reporting No Change | % Reporting Decrease |
Level of Business Activity | 66.7 | 25.0 | 76.7 | 13.3 | 10.0 |
Oil Production | 37.3 | –3.9 | 57.1 | 23.1 | 19.8 |
Natural Gas Wellhead Production | 38.9 | 3.0 | 55.6 | 27.8 | 16.7 |
Capital Expenditures | 51.6 | 13.0 | 65.9 | 19.8 | 14.3 |
Expected Level of Capital Expenditures Next Year | 64.8 | 35.0 | 73.6 | 17.6 | 8.8 |
Supplier Delivery Time | 18.9 | 7.2 | 33.3 | 52.2 | 14.4 |
Employment | –3.3 | –13.2 | 19.8 | 57.1 | 23.1 |
Employee Hours | 19.5 | 11.2 | 33.3 | 52.9 | 13.8 |
Wages and Benefits | 23.4 | –4.0 | 35.6 | 52.2 | 12.2 |
Finding and Development Costs | 30.3 | –12.0 | 40.4 | 49.4 | 10.1 |
Lease Operating Expenses | 28.9 | –20.2 | 41.1 | 46.7 | 12.2 |
| Indicator | Current Index | Previous Index | % Reporting Improved | % Reporting No Change | % Reporting Worsened |
Company Outlook | 84.0 | 59.1 | 88.9 | 6.2 | 4.9 |
| Business Indicators: O&G Support Services Firms Current Quarter (versus same quarter a year ago) | |||||
| Indicator | Current Index | Previous Index | % Reporting Increase | % Reporting No Change | % Reporting Decrease |
Level of Business Activity | 70.6 | 2.0 | 80.4 | 9.8 | 9.8 |
Utilization of Equipment | 58.0 | 4.3 | 70.0 | 18.0 | 12.0 |
Capital Expenditures | 37.3 | 0.0 | 51.0 | 35.3 | 13.7 |
Supplier Delivery Time | 24.0 | 12.8 | 42.0 | 40.0 | 18.0 |
Lag Time in Delivery of Firm's Services | 22.5 | 6.3 | 32.7 | 57.1 | 10.2 |
Employment | 23.6 | –24.0 | 47.1 | 29.4 | 23.5 |
Employment Hours | 45.1 | –16.0 | 56.9 | 31.4 | 11.8 |
Wages and Benefits | 41.2 | 2.1 | 51.0 | 39.2 | 9.8 |
Input Costs | 65.3 | 20.4 | 67.3 | 30.6 | 2.0 |
Prices Received for Services | 26.6 | –24.5 | 38.8 | 49.0 | 12.2 |
Operating Margin | 24.0 | –28.0 | 44.0 | 36.0 | 20.0 |
| Indicator | Current Index | Previous Index | % Reporting Improved | % Reporting No Change | % Reporting Worsened |
Company Outlook | 85.1 | 42.5 | 89.4 | 6.4 | 4.3 |
Activity Chart

Comments from Survey Respondents
These comments are from respondents’ completed surveys and have been edited for publication. Comments from the Special Questions survey can be found below the special questions.
Exploration and Production (E&P) Firms
- The administration’s efforts to curtail fossil fuel development is creating a larger gap between supply and demand, therefore causing an increase in commodity prices and drilling activity.
- We are closely monitoring potential changes to the tax code that could negatively impact the oil and gas industry. We are especially concerned about the elimination of intangible drilling cost deductions and flow-through entity taxation.
- We have relationships with approximately 400 institutional investors and close relationships with 100. Approximately one is willing to give new capital to oil and gas investment. The story is the same for public companies and international exploration. This underinvestment coupled with steep shale declines will cause prices to rocket in the next two to three years. I don’t think anyone is really prepared for it, but U.S. producers cannot increase capital expenditures: the OPEC+ sword of Damocles still threatens another oil price collapse the instant that large publics announce capital expenditure increases.
- The inability to access credit from reserve-based lending is a current issue affecting our business.
- The New Mexico regulatory climate is worsening toward oil and gas producers to the point where the outlook is grim.
- Don’t take the bait, drillers: Stay capital disciplined and enjoy the higher prices for your product.
- A large part of our uptick in activity is due to successfully completing an acquisition, effective Jan. 1, 2021, that has been in the works for six years. Our increased activity and positive outlook are not so much influenced by the improvement of oil prices as our ability to prudently manage and move the development forward. Obviously, strong prices help but are not the drivers for our ongoing work.
- Our biggest fear is the administration’s executive actions. Inflation will cause higher oil prices. That will hurt demand over time. Dollar values will help domestic producers. Our foreign policy looks very weak. That may create issues that invite higher oil prices.
- We are currently looking for projects, but we have found that quality projects are limited unless you’re looking for large mergers.
- The Fed [Federal Reserve] leaning on banks to address climate change in their lending decisions is not helpful. Despite some healing in the high-yield bond market, the banks remain severely strained and price decks, advance rates and assumptions are all working to limit borrowing bases. All of this will work to constrain capital flows to develop resources and stem decline curves in the industry, ultimately leading to higher prices.
- We are cautiously optimistic that the natural gas price will be above $3 per million cubic feet for much of the rest of 2021 and for 2022. The oil price appears much less certain and now dependent on Middle East and Russian politics. Despite the current high oil price, we are tilting our production toward natural gas.
- The current mess in Washington adds an unacceptable and adolescent level of challenge to strategic planning. Considering the administration’s attitude toward oil and gas, it is obvious that there is no basic understanding of the fact that, for the present and near term, the economy is absolutely dependent on the oil and gas industry to provide the energy to fuel the economy. Contrary to the current fiction, that fact will survive far into the conversion to renewables, and it will be tragic and expensive to believe to the contrary.
- The uncertainty has decreased, but it is still very high.
- I’m getting more and more uncomfortable with what is starting to be forced on American businesses—the oil and gas industry in particular. With the environmental, social and governance “green” stuff—and now the federal government using the Treasury department, the Commodity Futures Trading Commission, the Office of the Comptroller of the Currency and others to essentially “wage war” against a legitimate and legal American industry—I’m pulling back on all investments in all businesses. I am beginning to take all of my chips off the table and sit this out as I do not like what I see Washington doing and planning on doing more of against the free-enterprise system. Rather than growing my businesses and hiring, I will not be hiring during this administration and will just maintain. I will not be investing in any industry during the rest of this administration. We’ll be spectators and start enjoying time that otherwise would have been put into growing our portion of the American economy.
- Drilling costs remain low, and we have little competition from the “bigs.” It is a great time to be independent without debt!
- Continued delays in electrical power infrastructure remain a key hurdle to capital deployment. This has been a consistent issue for over two years, and now repairs to electrical infrastructure for transmission and distribution providers are further delaying new power connections. This is materially impacting operating options and expense at a time when, otherwise, capital development would tend to grow further.
- New Mexico state regulations on methane emissions could cause low-volume “legacy” wells and leases to be shut-in or plugged. Federal Bureau of Land Management regulations are increasing overhead costs as well. The bottom line is that the oil and gas industry is being held responsible for climate change, and that the politics of energy has changed from transitioning with alternative energy to eliminating carbon energy and replacing it with alternative energies.
- The federal leasing ban that the administration put in is very detrimental to the country. With no leasing, the federal government will lose all the revenue from the leasing and revenue from drilling on those leases. Many jobs were terminated. The canceling of the Keystone XL pipeline created a very detrimental effect to our country. Many jobs were lost. It does not make sense to be shipping that oil by railroad instead of a pipeline.
- Policies focused on limiting oil and gas growth, restrained capital budgets in favor of free-cash-flow generation, and continued consolidation could lead to an undersupply for growing demand. OPEC is back in the driver’s seat; if they can balance market share with high prices, they’ll take it.
Oil and Gas Support Services Firms
- Cost inflation is killing us. It is almost impossible to find drivers with a commercial driver’s license who can pass motor vehicle record and criminal background checks and will work for wages we can pay at the service prices we have. We are trying to raise prices, but there is still too much supply for the current level of activity. We hope this will change when there are another 50 rigs added.
- The administration has not been a friend to the petroleum industry.
- As a lower-middle-market energy services firm, our main concerns are finding working capital, moving projects that we have won at the desired speed, and winning new jobs. Some of the offshore projects in our sales pipeline are moving slower than expected.
- My company is barely hanging on. I own one Ford F-350 truck and 28-foot flatbed trailer. I have had one call since January. Most companies are demanding more insurance, and my expenses haven’t changed. I applied for loans without luck.
- With the improvement in commodity pricing, I would have thought that our seismic activity would have improved. It has not improved significantly, but we remain hopeful.
- While things are picking up in our areas of work, there is still much uncertainty as to “will this last?” It’s hard to believe we are questioning how things are going with oil over $70 per barrel.
Questions regarding the Dallas Fed Energy Survey can be addressed to Michael Plante at Michael.Plante@dal.frb.org or Kunal Patel at Kunal.Patel@dal.frb.org.
Sign up for our email alert to be automatically notified as soon as the latest Dallas Fed Energy Survey is released on the web.