Dallas Fed Energy Survey

Expansion Continues in Oil and Gas Activity; Cost Pressures Building
Special questions this quarter ask about expectations for U.S. electric vehicle sales, purchases of carbon credits and/or carbon offsets, COVID-19-related operational delays and hiring challenges.
Solid oil and gas sector growth continued in third quarter 2021, according to oil and gas executives responding to the Dallas Fed Energy Survey. The business activity index—the survey’s broadest measure of conditions facing Eleventh District energy firms—remained elevated but moved down from 53.0 in the second quarter to 44.3 in the third quarter.
Oil production increased but at a significantly slower pace, according to executives at exploration and production (E&P) firms. The oil production index remained positive but fell from 35.0 in the second quarter to 10.7 in the third. Similarly, the natural gas production index fell 16 points to 19.3.
For a second quarter in a row, costs rose sharply. Among oilfield services firms, the index for input costs increased to 60.8, a record high and indicative of significant cost pressures. Only one of the 47 responding oilfield services firms reported lower input costs this quarter. Among E&P firms, the index for finding and development costs advanced from 28.3 in the second quarter to 33.0 in the third. Additionally, the index for lease operating expenses increased, from 23.4 to 29.4.
It is also taking longer for companies to receive inputs. Among oilfield services firms, the index for supplier delivery time increased from 14.0 in the second quarter to 26.7 in the third, the highest reading since the survey’s inception in 2016. The index measuring delays in deliveries increased to 26.7, also a record high. Similarly, among E&P firms, the index for supplier delivery time increased from 4.0 to 10.5.
The equipment utilization index of oilfield services firms rose from 42.0 in the second quarter to 47.8 in the third. Operating margins continued to widen, with the index remaining positive at 21.8. The index of prices received for services rose from 30.0 to 42.2.
Labor market indicators improved in the third quarter. The aggregate employment index posted a third consecutive positive reading, increasing from 9.9 to 14.0. Employment growth continues to be driven primarily by oilfield services firms. The employment index was 25.5 for services firms versus 8.4 for E&P firms. The aggregate employee hours index remained positive but dipped from 24.0 to 19.0. The aggregate wages and benefits index increased, from 20.6 to 30.3.
Six-month outlooks improved, with the index remaining positive but declining from 71.9 last quarter to 58.9. After two quarters of declining uncertainty, the uncertainty index moved up from -19.6 to 4.3, suggesting a slight rise in uncertainty this quarter.
On average, respondents expect a West Texas Intermediate (WTI) oil price of $70 per barrel by year-end 2021; responses ranged from $42 to $90 per barrel. Survey respondents expect Henry Hub natural gas prices of $4.74 per million British thermal units (MMBtu) at year-end. For reference, WTI spot prices averaged $72 per barrel during the survey collection period, and Henry Hub spot prices averaged $5.22 per MMBtu.
Next release: December 29, 2021
Data were collected March 10–18, and 155 energy firms responded. Of the respondents, 104 were exploration and production firms and 51 were oilfield services firms.
Data were collected Sept. 15–23, and 142 energy firms responded. Of the respondents, 101 were exploration and production firms and 51 were oilfield services firms.
The Dallas Fed conducts the Dallas Fed Energy Survey quarterly to obtain a timely assessment of energy activity among oil and gas firms located or headquartered in the Eleventh District. Firms are asked whether business activity, employment, capital expenditures and other indicators increased, decreased or remained unchanged compared with the prior quarter and with the same quarter a year ago. Survey responses are used to calculate an index for each indicator. Each index is calculated by subtracting the percentage of respondents reporting a decrease from the percentage reporting an increase. When the share of firms reporting an increase exceeds the share reporting a decrease, the index will be greater than zero, suggesting the indicator has increased over the previous quarter. If the share of firms reporting a decrease exceeds the share reporting an increase, the index will be below zero, suggesting the indicator has decreased over the previous quarter.
Price Forecasts
West Texas Intermediate Crude
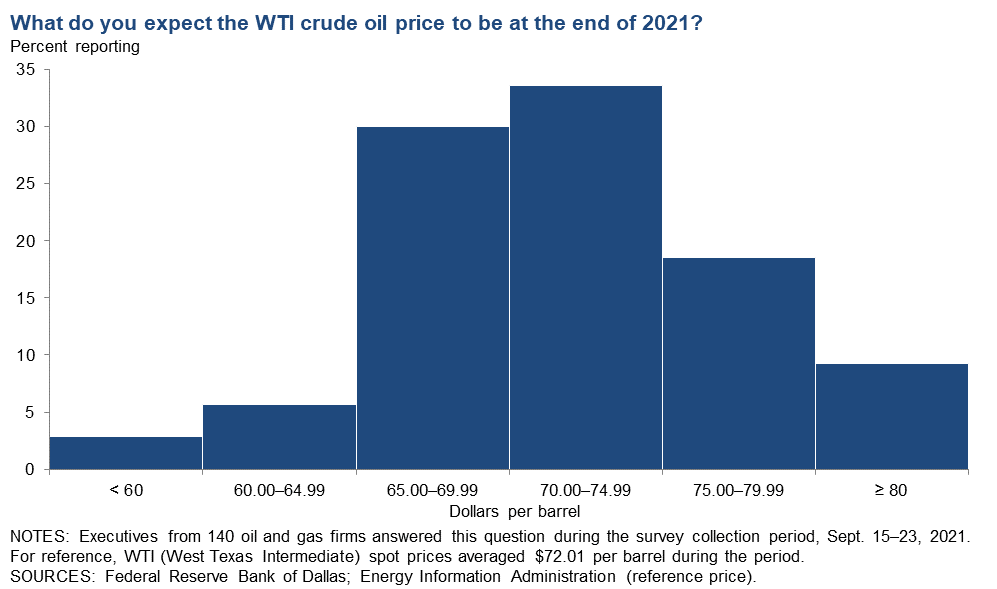
| West Texas Intermediate crude oil price (dollars per barrel), year-end 2022 | ||||
| Indicator | Survey Average | Low Forecast | High Forecast | Price During Survey |
Current quarter | $69.99 | $42.00 | $90.00 | $72.01 |
Prior quarter | $69.71 | $49.00 | $85.00 | $71.05 |
| NOTE: Price during survey is an average of daily spot prices during the survey collection period. SOURCES: Energy Information Administration; Federal Reserve Bank of Dallas. | ||||
Henry Hub Natural Gas
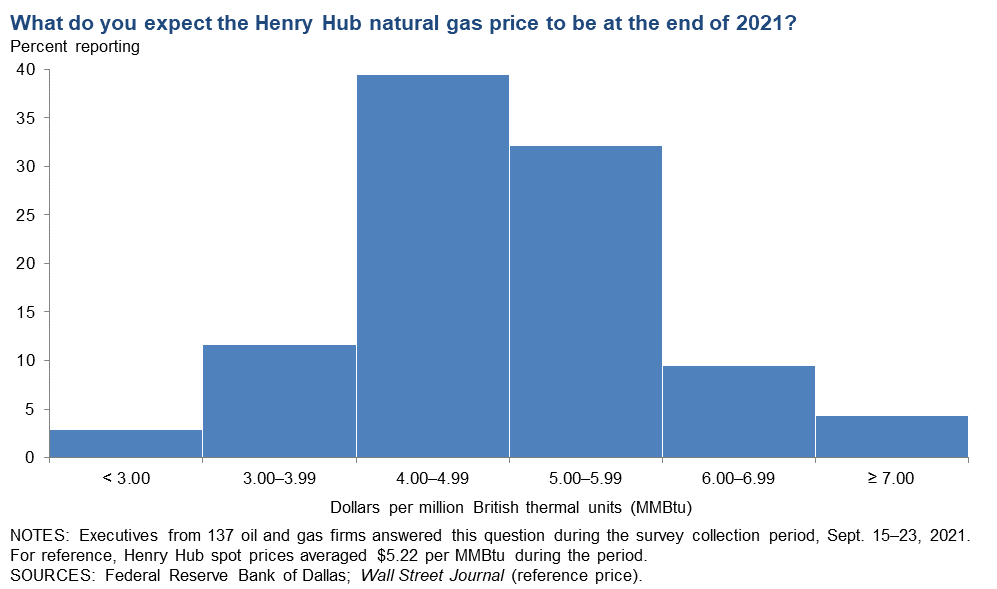
| Henry Hub natural gas price (dollars per MMBtu), year-end 2022 | ||||
| Indicator | Survey Average | Low Forecast | High Forecast | Price During Survey |
Current quarter | $4.74 | $2.11 | $9.50 | $5.22 |
Prior quarter | $3.10 | $2.20 | $5.00 | $3.24 |
| NOTE: Price during survey is an average of daily spot prices during the survey collection period. SOURCES: Federal Reserve Bank of Dallas; Wall Street Journal. | ||||
Special Questions
Data were collected Sept. 15–23; 142 oil and gas firms responded to the special questions survey.
All Firms
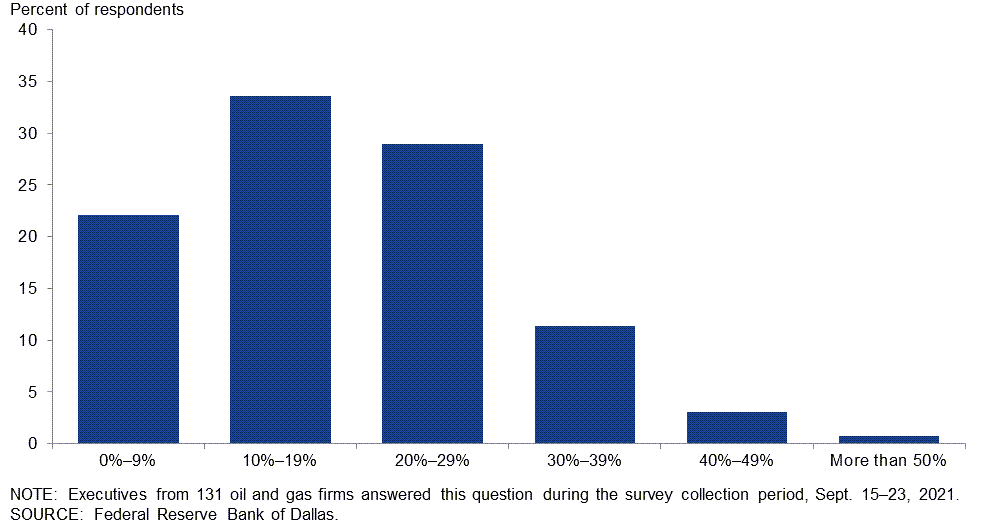
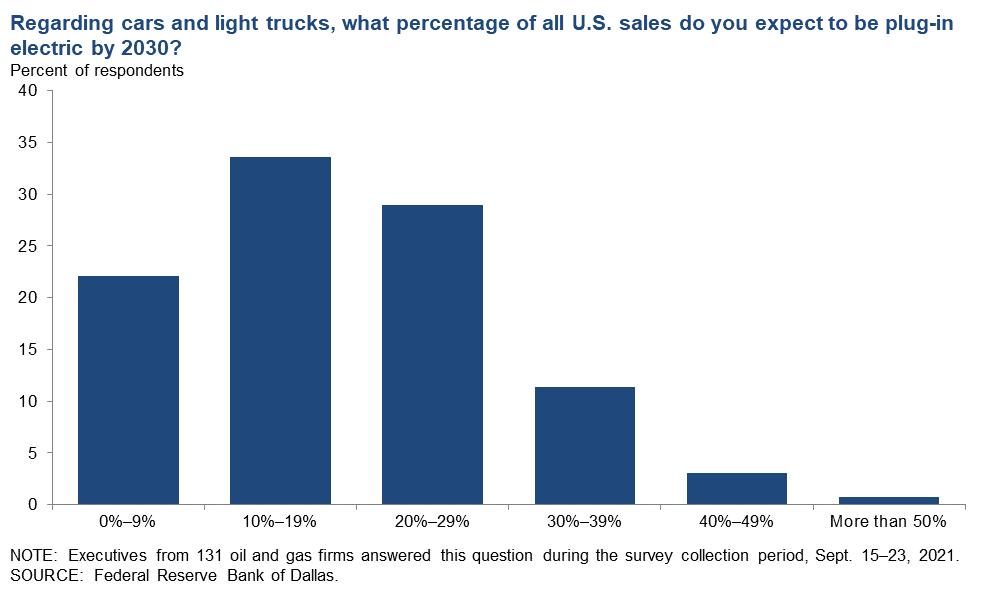
Regarding cars and light trucks, what percentage of all U.S. sales do you expect to be plug-in electric by 2030?
The most-selected response was 10‒19 percent, chosen by 34 percent of executives. Twenty-nine percent of executives said they expect 20‒29 percent of U.S. sales to be plug-in electric by 2030, while 22 percent said 0‒9 percent. Fourteen percent expect 30‒49 percent of all U.S. sales to be plug-in electric, and 1 percent expect sales to exceed 50 percent. For reference purposes, 2 percent of U.S. sales were plug-in electric in 2020, according to the International Energy Agency.
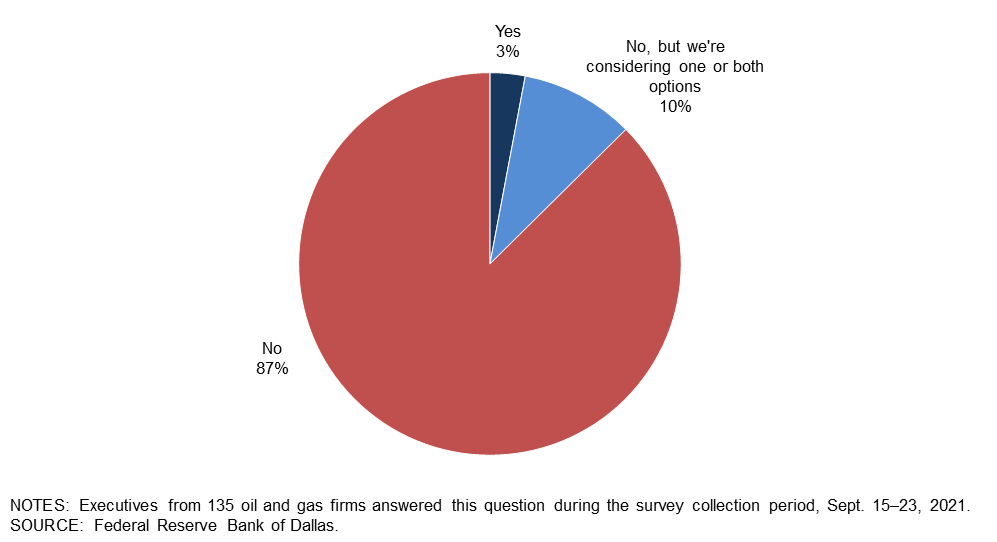
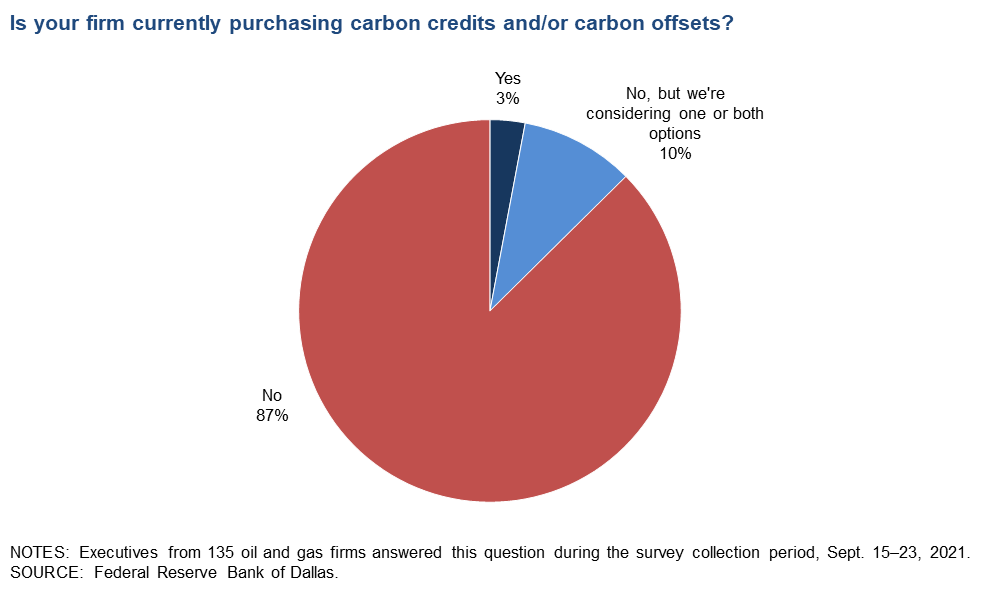
Is your firm currently purchasing carbon credits and/or carbon offsets?
A majority of executives—87 percent—said their firms are not purchasing carbon credits and/or carbon offsets. Ten percent said they are purchasing neither but are considering purchasing one or both options. The remaining 3 percent said their firms are purchasing carbon credits and/or offsets.
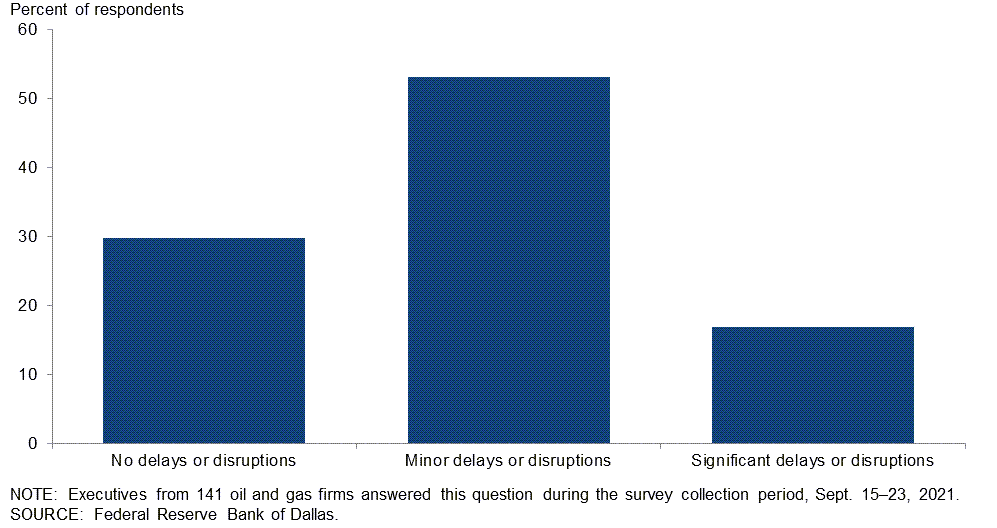
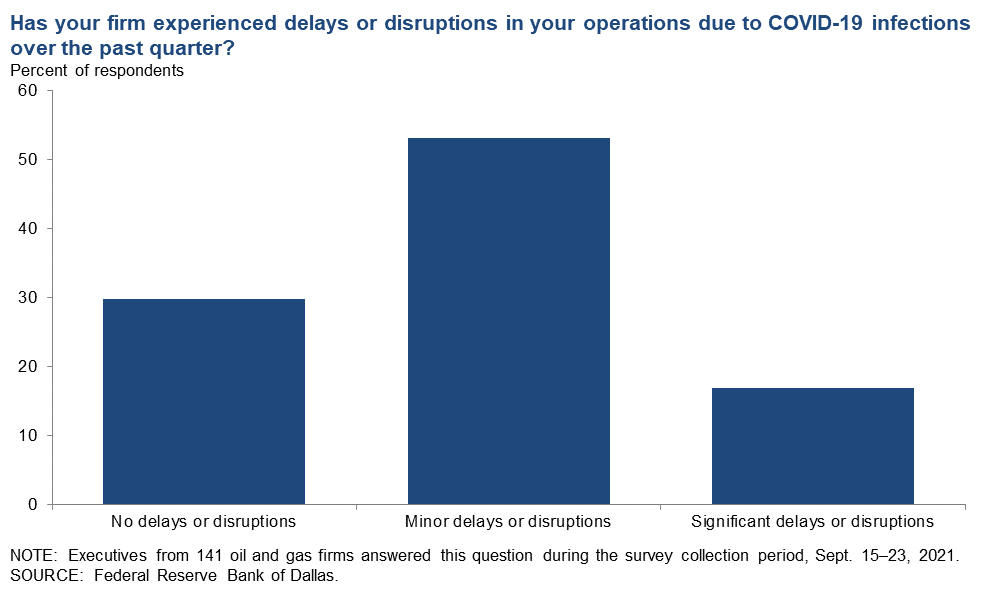
Has your firm experienced delays or disruptions in your operations due to COVID-19 infections over the past quarter?
Slightly more than half of the executives—53 percent—said COVID-19 caused minor delays or disruptions in operations in the past quarter. Thirty percent noted no delays or disruptions, while 17 percent encountered significant delays or disruptions.
Oil and Gas Support Services
Over the past quarter, have you had difficulty hiring workers at your firm?
This question was only posed to executives at oil and gas support services firms. Slightly more than half of the executives—51 percent—said they had difficulty hiring workers over the past quarter. Twenty-four percent said they did not have difficulty. Another 24 percent stated they didn’t have any job openings this past quarter. (Percentages don’t sum to 100 due to rounding.)
| Response | Percent of respondents |
| We have not had any job openings this quarter | 24 |
| No, we have been able to hire without difficulty | 24 |
| Yes, we have had difficulty hiring workers | 51 |
| NOTE: Executives from 45 oil and gas support services firms answered this question during the survey collection period, Sept. 15–23, 2021. SOURCE: Federal Reserve Bank of Dallas. |
|
If yes, what impediments is your firm facing when hiring or recalling workers? Please select all that apply.
Of those who responded that their firm experienced difficulty hiring, 70 percent noted a lack of qualified applicants, followed by 39 percent who cited workers looking for more pay than is offered. If “other” was selected, executives could provide a specific reason. Some of those responses included generous government unemployment benefits, customers of the firm requiring employees to be vaccinated, applicants looking for work-from-home flexibility, and people unwilling to work.
| Response | Percent of respondents |
| A lack of qualified applicants | 70 |
| Workers looking for more pay than is offered | 39 |
| Applicants have failed or refused drug tests | 17 |
| Other | 35 |
| NOTE: Executives from 23 oil and gas support services firms answered this question during the survey collection period, Sept. 15–23, 2021. SOURCE: Federal Reserve Bank of Dallas. |
|
Special Questions Comments
Exploration and Production (E&P) Firms
- The more I become educated on EVs [electric vehicles] and the charging and battery disposal problems, the more I think they will have little effect on the market in the future. My investigation turns more toward the hydrogen cell as the long-term solution.
- Disruptions are due to government payments to the workforce. Possible workers are being paid very well not to work by our government. This policy must change if we want a stable workforce in the U.S.
- In order to pursue the climate goals of the U.S., we must incorporate traditional energy producers and industrial firms in the conversation. Labeling these firms as "the enemy" will not accelerate the energy transition or get buy-in from stakeholders across the South. The South has accounted for a large majority of energy-related CO2 growth in the past 30 years—it has been the engine of industrial growth in the U.S. If you desire to have an impact on carbon, you can catch more flies with honey than vinegar. There is no amount of electrification (or carbon taxation) that will create plastics, cement or fertilizer. It is time for incentives like 45Q [tax credit for carbon dioxide sequestration] to be expanded and extended.
- The macho individualist in the oilfield has come face-to-face with a deadly virus. Our company has lost two employees, and the oilfield service company has lost three men just due to sheer stupidity. It is a tragedy for their families.
- We have had issues with contractors who are not vaccinated getting COVID-19 and then using federal-government-subsidized treatments in the hospital.
- Access to capital remains an issue. The Fed [Federal Reserve] picking winners and encouraging "green" with no real standards is problematic. The move to intermittent energy will have real, nontransitory impacts on consumer and/or business costs and inflation.
- My company is very small. I have made the decision to transition the work done by my employees to fully at home. I believe this serves as motivation to stay with my company and a benefit I can offer without increasing wages. Commuting times are becoming a significant complaint by my employees. Also, the expense of office rent can be eliminated.
- Our company is a nonoperator, so we rely upon our operators. They’re struggling with “work from home,” and everything is delayed. The resolution time for problems is greatly elongated. Responses to proposals are also greatly delayed. Invoicing and bill-paying by others have been delayed.
- Labor is a prime problem. Our work ethic is being destroyed. We exported our jobs of value. We are now importing labor with no skills. Dependency is seductive. It is a horrible way to kill the beacon of hope in this world. Our economy and capitalism are dying. I lived the best years of this country’s life.
- We're planning to sell carbon offsets, not buy them.
Oil and Gas Support Services Firms
- Our business is to provide seismic data to E&P clients, or at least it used to be. We are increasingly seeing new customers who are interested in using seismic data to assist them in carbon-capture use and storage projects. It appears that regulatory bottlenecks and/or delays are slowing the potential for many of these carbon-capture projects.
Additional Comments »
Historical data are available from first quarter 2016 to the most current release quarter.
Business Indicators: Quarter/Quarter
| Business Indicators: All Firms Current Quarter (versus previous quarter) | |||||
| Indicator | Current Index | Previous Index | % Reporting Increase | % Reporting No Change | % Reporting Decrease |
Level of Business Activity | 44.3 | 53.0 | 52.8 | 38.7 | 8.5 |
Capital Expenditures | 37.1 | 36.6 | 47.1 | 42.9 | 10.0 |
Supplier Delivery Time | 15.7 | 7.3 | 30.7 | 54.3 | 15.0 |
Employment | 14.0 | 9.9 | 23.2 | 67.6 | 9.2 |
Employee Hours | 19.0 | 24.0 | 27.5 | 64.1 | 8.5 |
Wages and Benefits | 30.3 | 20.6 | 34.5 | 61.3 | 4.2 |
| Indicator | Current Index | Previous Index | % Reporting Improved | % Reporting No Change | % Reporting Worsened |
Company Outlook | 58.9 | 71.9 | 67.9 | 23.1 | 9.0 |
| Indicator | Current Index | Previous Index | % Reporting Increase | % Reporting No Change | % Reporting Decrease |
Uncertainty | 4.3 | –19.6 | 29.8 | 44.7 | 25.5 |
| Business Indicators: E&P Firms Current Quarter (versus previous quarter) | |||||
| Indicator | Current Index | Previous Index | % Reporting Increase | % Reporting No Change | % Reporting Decrease |
Level of Business Activity | 38.9 | 50.0 | 48.4 | 42.1 | 9.5 |
Oil Production | 10.7 | 35.0 | 33.3 | 44.1 | 22.6 |
Natural Gas Wellhead Production | 19.3 | 35.0 | 38.7 | 41.9 | 19.4 |
Capital Expenditures | 36.6 | 42.4 | 49.5 | 37.6 | 12.9 |
Expected Level of Capital Expenditures Next Year | 48.9 | 53.0 | 56.5 | 35.9 | 7.6 |
Supplier Delivery Time | 10.5 | 4.0 | 26.3 | 57.9 | 15.8 |
Employment | 8.4 | 2.0 | 15.8 | 76.8 | 7.4 |
Employee Hours | 8.4 | 12.0 | 15.8 | 76.8 | 7.4 |
Wages and Benefits | 19.0 | 17.0 | 23.2 | 72.6 | 4.2 |
Finding and Development Costs | 33.0 | 28.3 | 36.2 | 60.6 | 3.2 |
Lease Operating Expenses | 29.4 | 23.4 | 37.0 | 55.4 | 7.6 |
| Indicator | Current Index | Previous Index | % Reporting Improved | % Reporting No Change | % Reporting Worsened |
Company Outlook | 61.0 | 71.3 | 69.0 | 23.0 | 8.0 |
| Indicator | Current Index | Previous Index | % Reporting Increase | % Reporting No Change | % Reporting Decrease |
Uncertainty | 0.0 | –22.7 | 27.7 | 44.7 | 27.7 |
| Business Indicators: O&G Support Services Firms Current Quarter (versus previous quarter) | |||||
| Indicator | Current Index | Previous Index | % Reporting Increase | % Reporting No Change | % Reporting Decrease |
Level of Business Activity | 55.3 | 58.8 | 61.7 | 31.9 | 6.4 |
Utilization of Equipment | 47.8 | 42.0 | 54.3 | 39.1 | 6.5 |
Capital Expenditures | 38.3 | 25.5 | 42.6 | 53.2 | 4.3 |
Supplier Delivery Time | 26.7 | 14.0 | 40.0 | 46.7 | 13.3 |
Lag Time in Delivery of Firm's Services | 26.7 | 10.2 | 31.1 | 64.4 | 4.4 |
Employment | 25.5 | 25.5 | 38.3 | 48.9 | 12.8 |
Employment Hours | 40.5 | 48.0 | 51.1 | 38.3 | 10.6 |
Wages and Benefits | 53.1 | 27.5 | 57.4 | 38.3 | 4.3 |
Input Costs | 60.8 | 56.0 | 63.0 | 34.8 | 2.2 |
Prices Received for Services | 42.2 | 30.0 | 44.4 | 53.3 | 2.2 |
Operating Margin | 21.8 | 22.5 | 37.0 | 47.8 | 15.2 |
| Indicator | Current Index | Previous Index | % Reporting Improved | % Reporting No Change | % Reporting Worsened |
Company Outlook | 55.4 | 72.9 | 66.0 | 23.4 | 10.6 |
| Indicator | Current Index | Previous Index | % Reporting Increase | % Reporting No Change | % Reporting Decrease |
Uncertainty | 12.7 | –13.8 | 34.0 | 44.7 | 21.3 |
Business Indicators: Year/Year
| Business Indicators: All Firms Current Quarter (versus same quarter a year ago) | |||||
| Indicator | Current Index | Previous Index | % Reporting Increase | % Reporting No Change | % Reporting Decrease |
Level of Business Activity | 66.7 | 68.1 | 76.8 | 13.0 | 10.1 |
Capital Expenditures | 55.5 | 46.5 | 65.9 | 23.7 | 10.4 |
Supplier Delivery Time | 19.3 | 20.7 | 37.8 | 43.7 | 18.5 |
Employment | 18.9 | 6.4 | 34.1 | 50.7 | 15.2 |
Employee Hours | 27.1 | 29.0 | 38.0 | 51.1 | 10.9 |
Wages and Benefits | 44.6 | 29.8 | 50.4 | 43.8 | 5.8 |
| Indicator | Current Index | Previous Index | % Reporting Improved | % Reporting No Change | % Reporting Worsened |
Company Outlook | 77.0 | 84.4 | 84.9 | 7.1 | 7.9 |
| Business Indicators: E&P Firms Current Quarter (versus same quarter a year ago) | |||||
| Indicator | Current Index | Previous Index | % Reporting Increase | % Reporting No Change | % Reporting Decrease |
Level of Business Activity | 61.3 | 66.7 | 73.1 | 15.1 | 11.8 |
Oil Production | 21.7 | 37.3 | 47.8 | 26.1 | 26.1 |
Natural Gas Wellhead Production | 28.6 | 38.9 | 48.4 | 31.9 | 19.8 |
Capital Expenditures | 52.3 | 51.6 | 66.7 | 18.9 | 14.4 |
Expected Level of Capital Expenditures Next Year | 61.3 | 64.8 | 69.3 | 22.7 | 8.0 |
Supplier Delivery Time | 13.0 | 18.9 | 32.6 | 47.8 | 19.6 |
Employment | 9.7 | –3.3 | 23.7 | 62.4 | 14.0 |
Employee Hours | 16.3 | 19.5 | 25.0 | 66.3 | 8.7 |
Wages and Benefits | 34.8 | 23.4 | 40.2 | 54.3 | 5.4 |
Finding and Development Costs | 42.2 | 30.3 | 48.9 | 44.4 | 6.7 |
Lease Operating Expenses | 43.7 | 28.9 | 52.9 | 37.9 | 9.2 |
| Indicator | Current Index | Previous Index | % Reporting Improved | % Reporting No Change | % Reporting Worsened |
Company Outlook | 77.8 | 84.0 | 85.2 | 7.4 | 7.4 |
| Business Indicators: O&G Support Services Firms Current Quarter (versus same quarter a year ago) | |||||
| Indicator | Current Index | Previous Index | % Reporting Increase | % Reporting No Change | % Reporting Decrease |
Level of Business Activity | 77.7 | 70.6 | 84.4 | 8.9 | 6.7 |
Utilization of Equipment | 70.5 | 58.0 | 77.3 | 15.9 | 6.8 |
Capital Expenditures | 62.2 | 37.3 | 64.4 | 33.3 | 2.2 |
Supplier Delivery Time | 32.5 | 24.0 | 48.8 | 34.9 | 16.3 |
Lag Time in Delivery of Firm's Services | 30.2 | 22.5 | 37.2 | 55.8 | 7.0 |
Employment | 37.8 | 23.6 | 55.6 | 26.7 | 17.8 |
Employment Hours | 48.8 | 45.1 | 64.4 | 20.0 | 15.6 |
Wages and Benefits | 64.4 | 41.2 | 71.1 | 22.2 | 6.7 |
Input Costs | 72.7 | 65.3 | 75.0 | 22.7 | 2.3 |
Prices Received for Services | 55.8 | 26.6 | 60.5 | 34.9 | 4.7 |
Operating Margin | 37.2 | 24.0 | 53.5 | 30.2 | 16.3 |
| Indicator | Current Index | Previous Index | % Reporting Improved | % Reporting No Change | % Reporting Worsened |
Company Outlook | 75.5 | 85.1 | 84.4 | 6.7 | 8.9 |
Activity Chart

Comments from Survey Respondents
These comments are from respondents’ completed surveys and have been edited for publication. Comments from the Special Questions survey can be found below the special questions.
Exploration and Production (E&P) Firms
- OPEC+ seems to have settled in with a target price for crude oil of greater than $65 per barrel.
- The administration's efforts to constrict the oil and gas industry seem to have had the opposite effect. The demand for oil is still there and growing, and the supply of crude oil is required. Therefore, drilling and completion activity have increased as commodity prices have increased.
- Oil, natural gas and natural gas liquids prices are greatly improved and appear to be sustainable for the coming months. The greatest headwind is skilled labor supply and access to expanding credit on our reserve base loan. Initial conversations with regional energy banks show increasing interest in advancing incremental credit. The money center banks continue to seek to reduce their commitments to oil and gas borrowers.
- We are encouraged by the restraint shown by U.S. upstream operators. By restricting capital expenditure, we are healing historic overproduction of both oil and natural gas. We believe investors will be attracted back into the E&P space if, as an industry, we continue on this path for at least a year or two more to deleverage balance sheets and return capital to investors.
- Increased activities by private E&P firms is leading to cost inflation. Continued oilfield services consolidation may contribute to it further.
- As an industry, we have to support vaccine mandates in order to enable people to safely increase economic activity and get back to the "before times." Without Americans getting vaccinated at greater-than-80-percent levels, demand for oil and natural gas will be suppressed.
- I am concerned about the enactment of regulations that will result in higher operational (finding and production) costs for producers who attempt to remain compliant.
- We have pivoted to producing more natural gas and less crude oil. The decrease in our oil production compared to last year is the result of a sale of oil properties. We are bullish on natural gas for the next few years.
- Political stances are not reflecting a comprehensive strategy regarding hydrocarbons, emissions (of all industries) or climate issues. Polarization rather than leadership seems to be the motive of politics from the president down through each state. No one is making "apples to apples" comparisons of real costs and real pollution issues associated with certain anointed and ordained perceived "green" energy sources rather than demonstrating a real in-depth understanding of the overall needs for energy growth from multiple sources through the coming decades.
- The delivery of electrical power remains among the largest deterrents of investment in the Permian Basin. Power suppliers are generally more than a year in the future from connecting to a new site and even then are unreliable on their date of delivery. This leaves operators less able to invest confidently.
- The rally in oil prices has a very unsustainable feel to it. This is probably because of the price roller coaster of the last seven years. The projects I am doing are ones that were postponed for 18 months due to the downturn. I have not, as of yet, taken on anything new.
- We are finally getting the benefit of increased natural gas prices in checks. It takes a while as more operators are taking over the distribution of revenues role from the actual oil and gas purchasers as another means of getting revenues and holding on to other people’s money for an extra month. This also introduces more errors in checks, translating purchaser’s volumes, revenues and prices to the operator’s database; when the interest owner does detect these errors, it takes months more to get the missing revenue released. All the errors seem to go one way. This is another dark avenue for operators with “situational ethics.” COVID-19 continues to cause delays as many people are working from home, causing businesses to take longer to address every situation.
- The lack of traditional capital sources in upstream oil and gas is a current issue affecting our business.
- Production and capital spending are down for our firm, as we sold all of our assets. We are actively seeking to redeploy capital in new ones.
- The lack of leadership, consistency and apparent understanding of basic economics from and by the administration in virtually all areas make any confidence in assessing the political climate a fool's game in terms of impact on the energy industry. Whatever planning we undertake today has to be with the assumption that our industry is rapidly becoming unwanted and we are planning on leaning heavily in favor of careful and limited strategic capital commitments that are not made with rational assessment of near-term capital recovery.
Oil and Gas Support Services Firms
- Labor is causing major problems in staffing for the increase in activity. Wages are up 20 percent, and companies are poaching employees from competitors. We are finding it difficult to increase prices to match our increase in costs.
- Cash flow from E&P clients is still not translating into increased activity. The Gulf of Mexico remains slow, and recent storms will push more work out into 2022 for that region.
- The administration’s policies and rhetoric continue to lead to uncertainty even with prices where they are. While I support lessening our dependence on fossil fuels, it must be done in a calm and systematic way.
- We continue to have incredible growth in our electric-driven natural gas compression business. Labor continues to be a struggle, and wages are at an all-time high because of inflation and printing too much money with all of the free giveaways. We are all going to have to pay for this sooner or later.
- We are seeing a slight improvement in business activity but are struggling to hire enough qualified drivers with a commercial driver's license.
- There is plenty of development drilling, but exploration has stalled.
- I have a small one-truck woman-owned business. The companies that I used to get runs within the oil and gas industries are making it impossible to continue my business. I plan that if it doesn't improve by the end of the year, I will finally have to close my doors. I have used all of my revenue. I am at a loss on what to do.
- We are having difficulty hiring employees.
Questions regarding the Dallas Fed Energy Survey can be addressed to Michael Plante at Michael.Plante@dal.frb.org or Kunal Patel at Kunal.Patel@dal.frb.org.
Sign up for our email alert to be automatically notified as soon as the latest Dallas Fed Energy Survey is released on the web.