Dallas Fed Energy Survey

Oil and Gas Activity Continues Expanding; Cost Pressures Intensify
Special questions this quarter focus on capital spending in 2022; the oil price that firms are using for budgeting; whether countries will meet their commitments for reducing greenhouse gas emissions; upstream firms’ primary goals for the coming year; plans for reducing greenhouse emissions; and oil and gas support services firms’ expectations for how much selling prices and input prices will change next year.
The oil and gas sector continued growing in fourth quarter 2021, according to oil and gas executives responding to the Dallas Fed Energy Survey. The business activity index—the survey’s broadest measure of conditions facing Eleventh District energy firms—remained elevated at 42.6, essentially unchanged from its third-quarter reading.
Oil production increased at a faster pace, according to executives at exploration and production (E&P) firms. The oil production index moved up from 10.7 in the third quarter to 19.1 in the fourth quarter. Similarly, the natural gas production index advanced seven points to 26.1.
Costs rose sharply for a third straight quarter. Among oilfield services firms, the index for input costs increased from 60.8 to 69.8—a record high and suggestive of significant cost pressures. Only one of the 44 responding oilfield services firms reported lower input costs this quarter. Among E&P firms, the index for finding and development costs advanced from 33.0 in the third quarter to 44.9 in the fourth. Additionally, the index for lease operating expenses also increased, from 29.4 to 42.0. Both of these indexes reached their highest readings in the survey’s five-year history.
Oilfield services firms reported improvement across all indicators, although the pace of growth for some indicators has slowed. The equipment utilization index edged up from 47.8 in the third quarter to 51.1 in the fourth. The operating margin index remained positive but declined from 21.8 to 11.6. The index of prices received for services also remained positive but fell from 42.2 to 30.3.
Labor market indicators showed further growth in the fourth quarter. The aggregate employment index posted a fourth consecutive positive reading, though it edged down from 14.0 to 11.9. Employment growth continued to be driven primarily by oilfield services firms; the employment index was 22.7 for services firms versus 6.7 for E&P firms. The aggregate employee hours index was largely unchanged at 18.0. The aggregate wages and benefits index moved higher, from 30.3 to 36.6—a record high.
Six-month outlooks improved, with the index remaining positive but declining from 58.9 last quarter to 53.2 in the fourth quarter. The outlook uncertainty index fell to -1.5, with the near-zero reading indicating that uncertainty is relatively unchanged compared with the prior quarter.
On average, respondents expect a West Texas Intermediate (WTI) oil price of $75 per barrel by year-end 2022; responses ranged from $50 to $125 per barrel. Survey participants expect Henry Hub natural gas prices of $4.06 per million British thermal units (MMBtu) at year-end 2022. For reference, WTI spot prices averaged $71 per barrel during the survey collection period, and Henry Hub spot prices averaged $3.76 per MMBtu.
Next release: March 23, 2022
Data were collected March 10–18, and 155 energy firms responded. Of the respondents, 104 were exploration and production firms and 51 were oilfield services firms.
Data were collected Dec. 8–16, and 134 energy firms responded. Of the respondents, 101 were exploration and production firms and 51 were oilfield services firms.
The Dallas Fed conducts the Dallas Fed Energy Survey quarterly to obtain a timely assessment of energy activity among oil and gas firms located or headquartered in the Eleventh District. Firms are asked whether business activity, employment, capital expenditures and other indicators increased, decreased or remained unchanged compared with the prior quarter and with the same quarter a year ago. Survey responses are used to calculate an index for each indicator. Each index is calculated by subtracting the percentage of respondents reporting a decrease from the percentage reporting an increase. When the share of firms reporting an increase exceeds the share reporting a decrease, the index will be greater than zero, suggesting the indicator has increased over the previous quarter. If the share of firms reporting a decrease exceeds the share reporting an increase, the index will be below zero, suggesting the indicator has decreased over the previous quarter.
Price Forecasts
West Texas Intermediate Crude
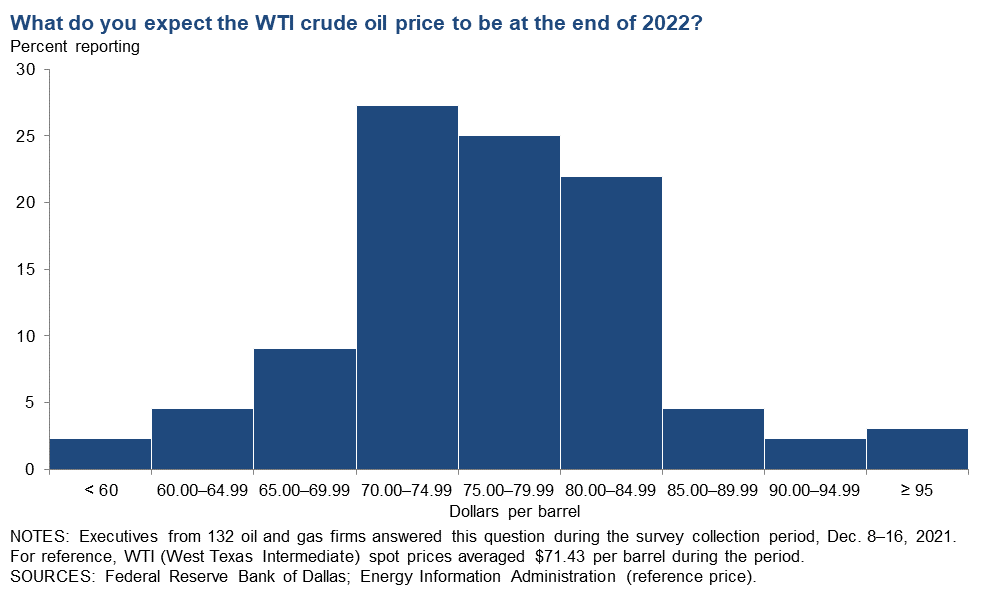
| West Texas Intermediate crude oil price (dollars per barrel), year-end 2022 | ||||
| Indicator | Survey Average | Low Forecast | High Forecast | Price During Survey |
Current quarter | $74.69 | $50.00 | $125.00 | $71.43 |
Prior quarter | N/A | N/A | N/A | N/A |
| NOTE: Price during survey is an average of daily spot prices during the survey collection period. SOURCES: Energy Information Administration; Federal Reserve Bank of Dallas. | ||||
Henry Hub Natural Gas
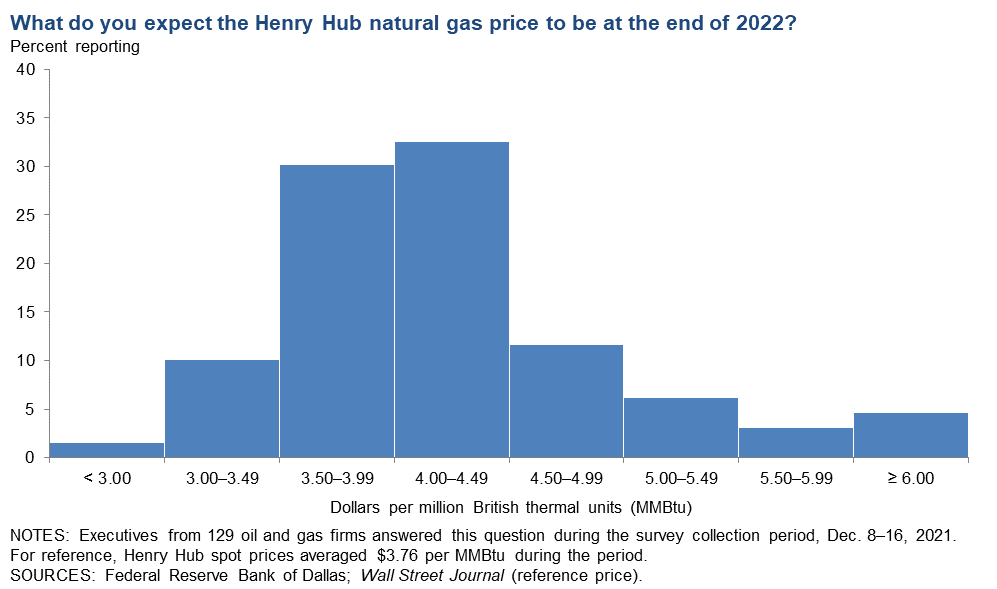
| Henry Hub natural gas price (dollars per MMBtu), year-end 2022 | ||||
| Indicator | Survey Average | Low Forecast | High Forecast | Price During Survey |
Current quarter | $4.06 | $2.25 | $7.50 | $3.76 |
Prior quarter | N/A | N/A | N/A | N/A |
| NOTE: Price during survey is an average of daily spot prices during the survey collection period. SOURCES: Federal Reserve Bank of Dallas; Wall Street Journal. | ||||
Special Questions
Data were collected Dec. 8–16; 131 oil and gas firms responded to the special questions survey.
All Firms
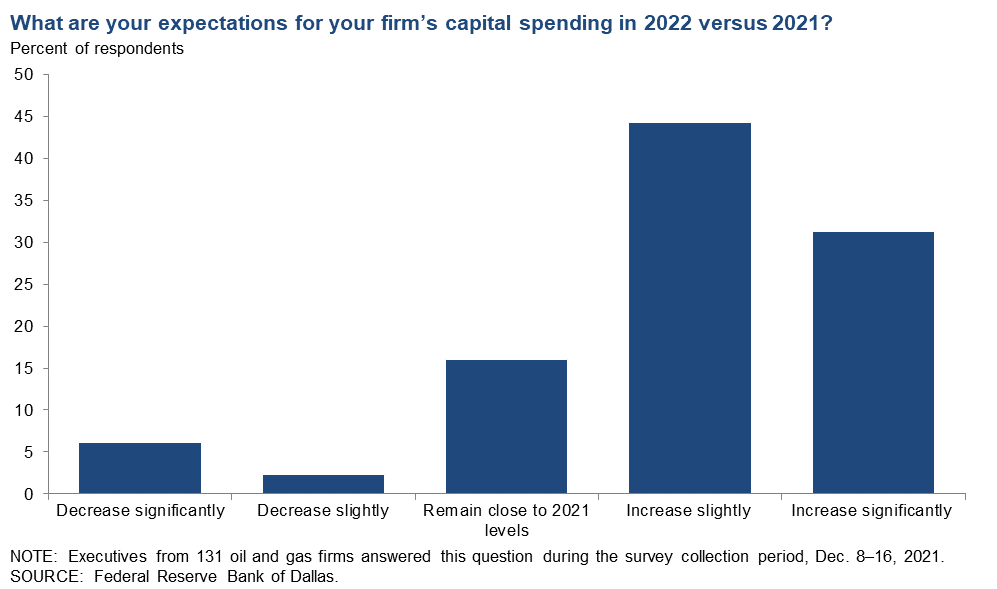
What are your expectations for your firm’s capital spending in 2022 versus 2021?
Most executives expect their firm’s capital spending to rise in 2022 compared with 2021. Forty-four percent of executives said they expect capital spending to increase slightly, while an additional 31 percent anticipate a significant increase. Sixteen percent expect spending in 2022 to remain close to 2021 levels. Only 8 percent expect reductions in spending in 2022.
A breakdown of the data for exploration and production (E&P) versus oil and gas support services can be found in the table below.
| Response | Percent of respondents | ||
| All firms | E&P | Services | |
| Increase significantly | 31 | 35 | 24 |
| Increase slightly | 44 | 43 | 48 |
| Remain close to 2021 levels | 16 | 15 | 19 |
| Decrease slightly | 2 | 1 | 5 |
| Decrease significantly | 6 | 7 | 5 |
| NOTES: Executives from 89 exploration and production firms and 42 oil and gas support services firms answered this question during the survey collection period, Dec. 8–16, 2021. The “All” column reports the percentage out of the total 131 responses. The “E&P” column reports the percentage for exploration and production firms and “Services” reports the percentage for oil and gas support services firms. Percentages may not sum to 100 due to rounding. SOURCE: Federal Reserve Bank of Dallas. |
|||
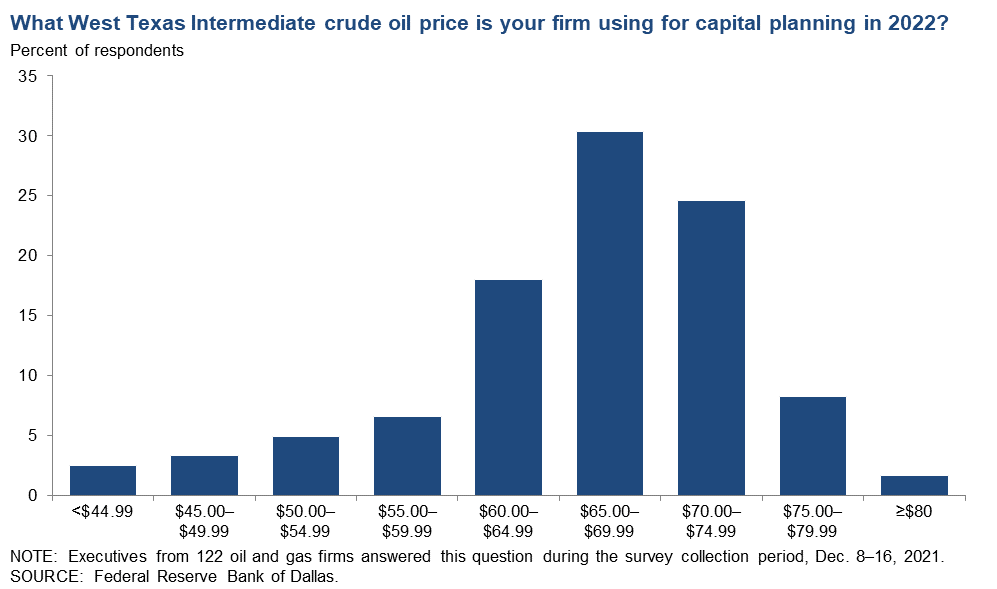
What West Texas Intermediate crude oil price is your firm using for capital planning in 2022?
For this special question, executives were asked to provide the WTI price they used for planning their capital expenditures in 2022. The average response was $64 per barrel, with the median and the mode at $65 per barrel. The average price used is higher relative to what was used for prior budgets (2019: $54; 2020: $54; 2021: $44)
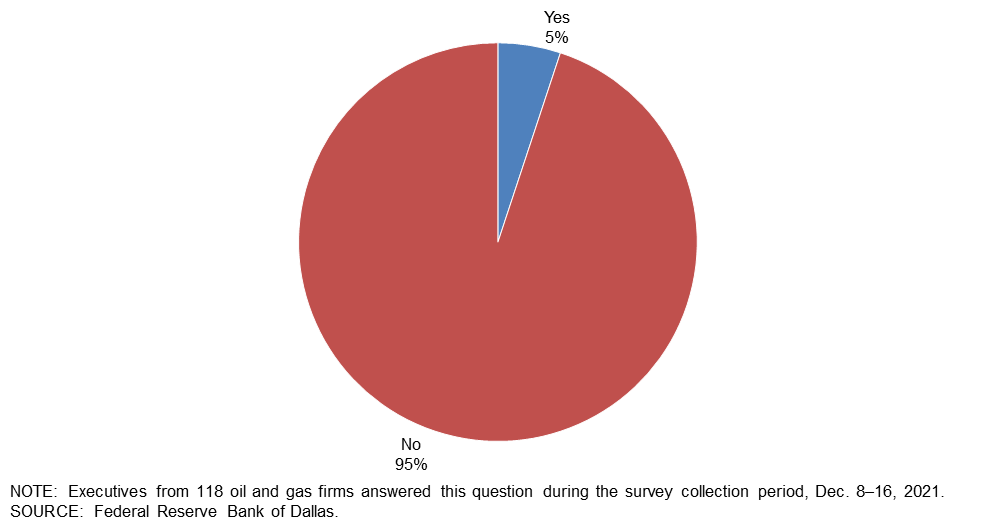
Do you believe countries will be able to meet their commitments for 2030 for reducing greenhouse gas emissions?
Ninety-five percent of executives said they believe countries will be unable to meet their 2030 commitments for reducing greenhouse gas emissions. The remaining 5 percent believe they will.
Exploration and Production (E&P) Firms
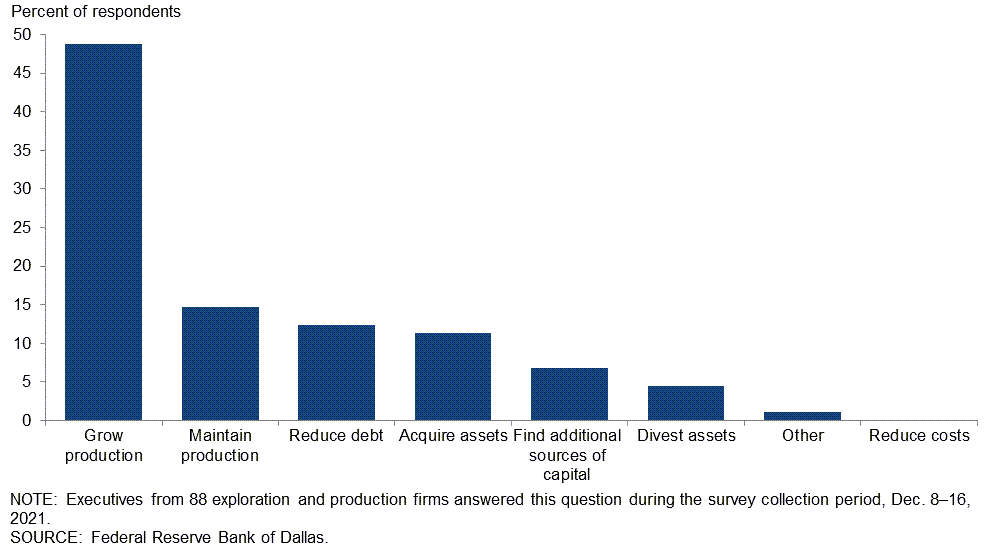
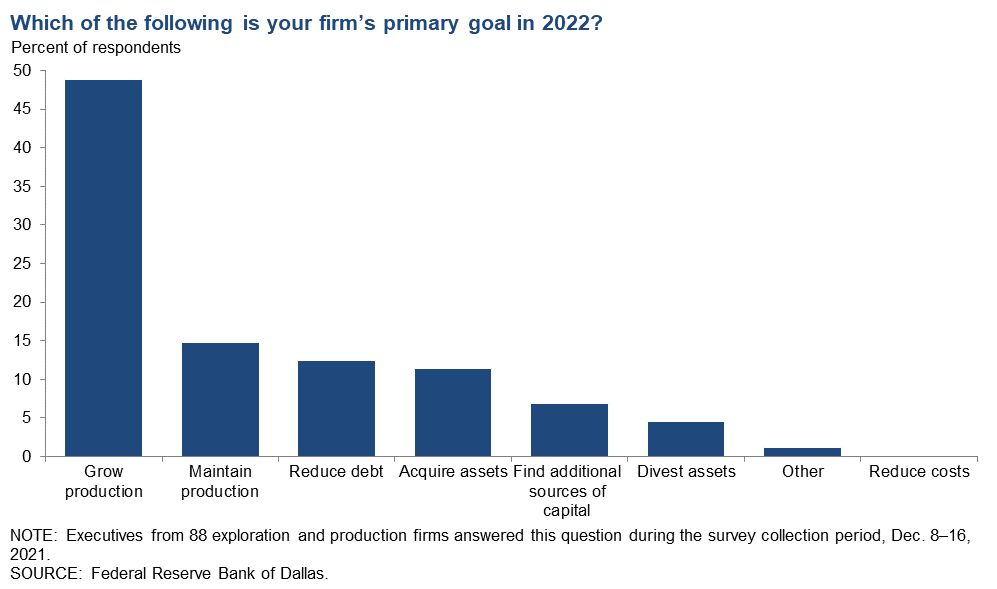
Which of the following is your firm’s primary goal in 2022?
Executives from E&P firms were presented with eight potential goals for 2022 and asked to select their firm’s primary one from the list. Forty-nine percent of executives selected “grow production” as the primary goal in 2022. A total of 15 percent said “maintain production,” and 13 percent indicated “reduce debt.”
A breakdown of the data for small and large E&P firms can be found in the table below. Firms were classified as “small” if they produced less than 10,000 barrels per day (b/d) or “large” if they produced 10,000 b/d or more. The most-selected response among small firms was "grow production," whereas the most-selected response among large firms was "reduce debt."
| Response | Percent of respondents | ||
| All firms | Small firms | Large firms | |
| Grow production | 49 | 57 | 24 |
| Maintain production | 15 | 16 | 10 |
| Reduce debt | 13 | 7 | 29 |
| Acquire assets | 11 | 9 | 19 |
| Find additional sources of capital | 7 | 7 | 5 |
| Divest assets | 5 | 3 | 10 |
| Other | 1 | 0 | 5 |
| Reduce costs | 0 | 0 | 0 |
| NOTES: Executives from 88 exploration and production firms answered this question during the survey collection period, Dec. 8–16, 2021. Small firms produced less than 10,000 b/d in fourth quarter 2021, while large firms produced 10,000 b/d or more. Responses came from 67 small firms and 21 large firms. SOURCE: Federal Reserve Bank of Dallas.. |
|||
Which of the following plans does your firm have? (Check all that apply.)
E&P firms were first asked to classify themselves based on fourth quarter 2021 crude oil production and then asked if they had any of the following plans: to reduce carbon emissions; reduce methane emissions; reduce flaring; recycle/reuse water. Respondents could choose more than one answer for this special question.
Firms were classified as “small” if they produced less than 10,000 barrels per day (b/d) or “large” if they produced 10,000 b/d or more. In the U.S., small E&P firms are greater in number, but large E&P firms make up the majority of production (greater than 80 percent).
For the larger firms, 68 percent of executives said their firm plans to reduce methane emissions, 63 percent noted that their firm plans to reduce CO2 emissions, 58 percent plan to reduce flaring, and 42 percent plan to recycle/reuse water.
For the smaller firms, 26 percent of executives said their firm plans to reduce flaring, 24 percent plan to reduce methane emissions, 21 percent plan to reduce CO2 emissions, and 18 percent plan to recycle/reuse water. Among the smaller E&P firms, 53 percent said they don’t have any mitigation plans, compared with 11 percent of large E&P firms. Relative to when this same question was asked in fourth quarter 2020, a similar share of firms said they had at least one of these mitigation plans.
| Response | Percent of respondents | ||
| Small firms | Large firms | All firms | |
| Plan to reduce CO2 emissions | 21 | 63 | 31 |
| Plan to reduce methane emissions | 24 | 68 | 35 |
| Plan to reduce flaring | 26 | 58 | 33 |
| Plan to recycle/reuse water | 18 | 42 | 23 |
| None of the above | 53 | 11 | 43 |
| NOTES: Executives from 81 exploration and production firms answered this question during the survey collection period, Dec. 8–16, 2021. Small firms produced less than 10,000 b/d in fourth quarter 2021, while large firms produced 10,000 b/d or more. Responses came from 62 small firms and 19 large firms. SOURCE: Federal Reserve Bank of Dallas. |
|||
By how much do you expect your firm to reduce greenhouse gas emissions from 2020 to 2025 in terms of barrel-of-oil equivalent produced?
Of the large firms, 38 percent said their firm plans to reduce greenhouse gas emissions by 10 percent or more by 2025. Of the remaining firms, 10 percent of respondents reported planned reductions of more than 5 percent but not more than 7.5 percent; 5 percent of respondents put the range at more than 2.5 percent but not more than 5 percent; 5 percent of respondents put the range at more than zero but not more than 2.5 percent; 5 percent reported no planned decreases.
The majority of the largest firms producing 100,000 b/d or more (not shown in the table) plan to reduce greenhouse gas emissions by more than 10 percent.
Among the executives of small firms, 8 percent said their firm plans to reduce greenhouse gas emissions by more than 10 percent by 2025. An additional 2 percent put the range at more than 7.5 percent but not more than 10 percent, 8 percent cited a range of more than 5 percent but not more than 7.5 percent, 9 percent said more than 2.5 percent but not more than 5 percent, 11 percent gave a range of more than zero but not more than 2.5 percent and 25 percent said they didn’t plan to decrease emissions.
Among both small and large E&P firms, 38 percent reported they were unsure of their plans. Relative to when this same question was asked in fourth quarter 2020, more firms are targeting reductions in greenhouse gas emissions of more than 10 percent, and fewer firms said they were unsure of their plans.
| Response | Percent of respondents | ||
| Small firms | Large firms | All firms | |
| 0% | 25 | 5 | 20 |
| More than 0% but not more than 2.5% | 11 | 5 | 9 |
| More than 2.5% but not more than 5% | 9 | 5 | 8 |
| More than 5% but not more than 7.5% | 8 | 10 | 8 |
| More than 7.5% but not more than 10% | 2 | 0 | 1 |
| More than 10% | 8 | 38 | 15 |
| Don’t know | 38 | 38 | 38 |
| NOTES: Executives from 86 exploration and production firms answered this question during the survey collection period, Dec. 8–16, 2021. Small firms produced less than 10,000 b/d in fourth quarter 2021, while large firms produced 10,000 b/d or more. Responses came from 65 small firms and 21 large firms. SOURCE: Federal Reserve Bank of Dallas. |
|||
Oil and Gas Support Services Firms
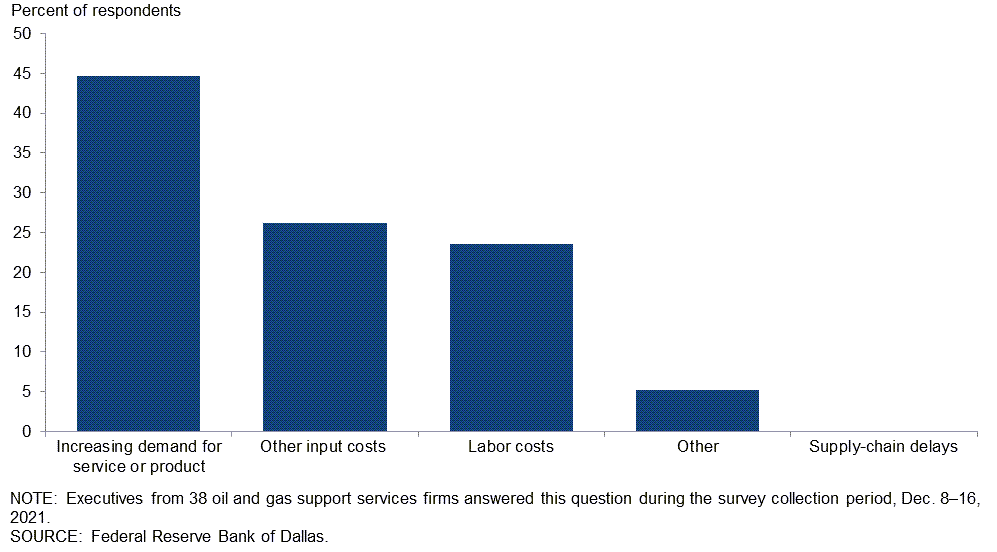
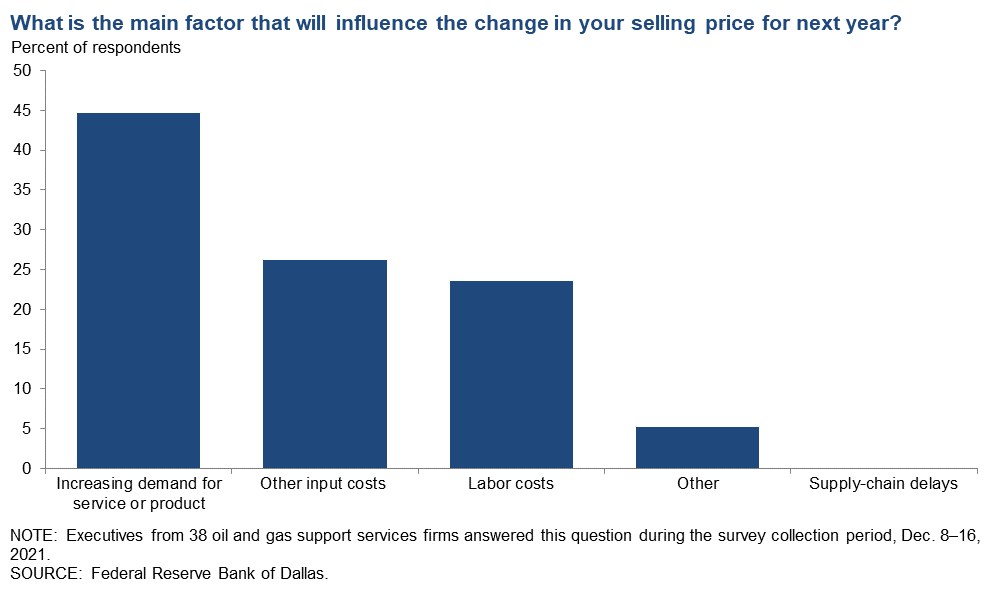
For your firm’s primary service or product, by what percent do you expect its selling price to change from December 2021 to December 2022?
For this special question, executives were asked to provide the percentage change for the selling price of their firm’s primary service or product. The average response was an increase of 8.5 percent, and the median was an increase of 10 percent.
| Response | Percent of respondents |
| Less than 0% | 2 |
| 0% | 22 |
| More than 0% but not more than 5% | 5 |
| More than 5% but not more than 10% | 12 |
| More than 10% but not more than 15% | 32 |
| More than 15% but not more than 20% | 15 |
| More than 20% | 12 |
| NOTES: Executives from 41 oil and gas support services firms answered this question during the survey collection period, Dec. 8–16, 2021. SOURCE: Federal Reserve Bank of Dallas. |
|
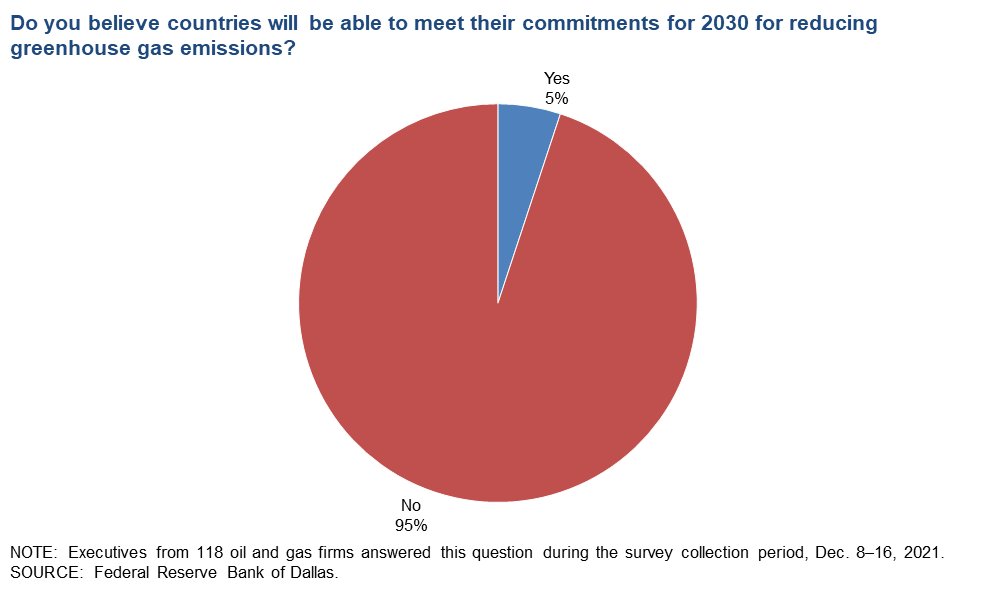
Do you believe countries will be able to meet their commitments for 2030 for reducing greenhouse gas emissions?
Ninety-five percent of executives said they believe countries will be unable to meet their 2030 commitments for reducing greenhouse gas emissions. The remaining 5 percent believe they will.
For your firm’s primary service or product, by what percent do you expect its input prices to change from December 2021 to December 2022?
For this special question, executives were asked to provide the percentage change in input prices for their firm’s primary service or product. The average response was an increase of 9.8 percent, and the median was an increase of 10 percent.
| Response | Percent of respondents |
| Less than 0% | 0 |
| 0% | 10 |
| More than 0% but not more than 5% | 10 |
| More than 5% but not more than 10% | 18 |
| More than 10% but not more than 15% | 38 |
| More than 15% but not more than 20% | 13 |
| More than 20% | 10 |
| NOTES: Executives from 39 oil and gas support services firms answered this question during the survey collection period, Dec. 8–16, 2021. SOURCE: Federal Reserve Bank of Dallas. |
|
Special Questions Comments
Exploration and Production (E&P) Firms
- The U.S. E&P industry is working quite hard to bring oil and gas supplies affordably and sustainably in the transitioning energy landscape. The E&P industry needs bright individuals who know energy to change energy.
- Greenhouse emission issues are challenging for small upstream operators. Lack of developed infrastructure in certain areas have made planning and cost forecasting very difficult. Pipeline gathering systems are inadequate—non-existent in certain areas—and reduced ability to flare gas will impact exploration activity negatively in otherwise potentially developable areas.
- Just look to Europe for what an energy “revolution” looks like instead of an “evolution.” There are unintended consequences. Historically high power prices caused by low wind speeds, cold weather and low solar irradiance are the result of underinvestment in traditional natural gas power and transportation infrastructure (and a general antagonism toward nuclear energy). There is a massive unintended consequence: higher carbon emissions. Per [an analyst quoted in] the New York Times: “Around $41 per million British thermal units, the gas futures are priced at more than 10 times what gas is selling for in the United States and comparable to about $230 a barrel for oil.” What happens? Analysts estimate that gas-to-oil switching for power is over one million barrels per day. If countries in the Middle East can sell natural gas for over $230 per barrel of oil equivalent, they sell gas and burn oil for electricity instead (i.e., gas-to-oil switching), resulting in higher carbon emissions than if we were just using natural gas all along.
- Permian greenhouse gas (GHG) emissions’ intensity is highly correlated with basin gas processing, compression and takeaway capacity. If takeaway stays ahead of production, GHG emission intensity will stay low.
- We issued the industry’s first sustainability-linked bonds in conjunction with our commitment to reduce GHG emissions by 50 percent over the next five years.
- Polarizing politics are forcing different sides into opposing corners when, to effectively move forward, all should be working together. Denigrating and piling costs onto operators “because you can” is not an effective “policy.” The country needs all of us pulling together. We all know changes are required. That said, changes do not need to be spewed forth in policies that actually undermine the goals of supplying energy and reducing pollution. Texas is just as messed up as California is but, obviously, reflecting opposite sides of the spectrum. Both need to get their act together and manage, not pander.
- The type of stripper well production I have does not emit hardly any CO2 or methane. The reservoirs are near depletion and the gas/oil ratios are very low—there is very little reservoir energy left.
- We are hedging our portfolio with a nod to invest in solar and tree farms. It is not a significant portion of our budget but is a learning opportunity.
- Regarding our primary goal for 2022, we are planning on growing our production and will simultaneously seek divestment opportunities based on higher values.
Oil and Gas Support Services Firms
- Oil services, and in particular seismic data providers, are still largely in survival mode. Like most in the business, we expect that the lack of capital investment will drive supply stagnation, which will ultimately drive commodity pricing higher, which will create opportunities for those who do survive.
Additional Comments »
Historical data are available from first quarter 2016 to the most current release quarter.
Business Indicators: Quarter/Quarter
| Business Indicators: All Firms Current Quarter (versus previous quarter) | |||||
| Indicator | Current Index | Previous Index | % Reporting Increase | % Reporting No Change | % Reporting Decrease |
Level of Business Activity | 42.6 | 44.3 | 49.3 | 44.0 | 6.7 |
Capital Expenditures | 36.9 | 37.1 | 45.9 | 45.1 | 9.0 |
Supplier Delivery Time | 25.6 | 15.7 | 40.6 | 44.4 | 15.0 |
Employment | 11.9 | 14.0 | 20.9 | 70.1 | 9.0 |
Employee Hours | 18.0 | 19.0 | 26.3 | 65.4 | 8.3 |
Wages and Benefits | 36.6 | 30.3 | 40.3 | 56.0 | 3.7 |
| Indicator | Current Index | Previous Index | % Reporting Improved | % Reporting No Change | % Reporting Worsened |
Company Outlook | 53.2 | 58.9 | 61.1 | 31.0 | 7.9 |
| Indicator | Current Index | Previous Index | % Reporting Increase | % Reporting No Change | % Reporting Decrease |
Uncertainty | –1.5 | 4.3 | 25.6 | 47.4 | 27.1 |
| Business Indicators: E&P Firms Current Quarter (versus previous quarter) | |||||
| Indicator | Current Index | Previous Index | % Reporting Increase | % Reporting No Change | % Reporting Decrease |
Level of Business Activity | 33.3 | 38.9 | 41.1 | 51.1 | 7.8 |
Oil Production | 19.1 | 10.7 | 36.0 | 47.2 | 16.9 |
Natural Gas Wellhead Production | 26.1 | 19.3 | 37.5 | 51.1 | 11.4 |
Capital Expenditures | 35.9 | 36.6 | 44.9 | 46.1 | 9.0 |
Expected Level of Capital Expenditures Next Year | 46.0 | 48.9 | 51.7 | 42.5 | 5.7 |
Supplier Delivery Time | 24.5 | 10.5 | 36.7 | 51.1 | 12.2 |
Employment | 6.7 | 8.4 | 15.6 | 75.6 | 8.9 |
Employee Hours | 5.6 | 8.4 | 13.5 | 78.7 | 7.9 |
Wages and Benefits | 30.0 | 19.0 | 34.4 | 61.1 | 4.4 |
Finding and Development Costs | 44.9 | 33.0 | 48.3 | 48.3 | 3.4 |
Lease Operating Expenses | 42.0 | 29.4 | 47.7 | 46.6 | 5.7 |
| Indicator | Current Index | Previous Index | % Reporting Improved | % Reporting No Change | % Reporting Worsened |
Company Outlook | 45.8 | 61.0 | 55.4 | 34.9 | 9.6 |
| Indicator | Current Index | Previous Index | % Reporting Increase | % Reporting No Change | % Reporting Decrease |
Uncertainty | 1.1 | 0.0 | 27.8 | 45.6 | 26.7 |
| Business Indicators: O&G Support Services Firms Current Quarter (versus previous quarter) | |||||
| Indicator | Current Index | Previous Index | % Reporting Increase | % Reporting No Change | % Reporting Decrease |
Level of Business Activity | 61.4 | 55.3 | 65.9 | 29.5 | 4.5 |
Utilization of Equipment | 51.1 | 47.8 | 55.8 | 39.5 | 4.7 |
Capital Expenditures | 38.6 | 38.3 | 47.7 | 43.2 | 9.1 |
Supplier Delivery Time | 27.9 | 26.7 | 48.8 | 30.2 | 20.9 |
Lag Time in Delivery of Firm's Services | 9.3 | 26.7 | 16.3 | 76.7 | 7.0 |
Employment | 22.7 | 25.5 | 31.8 | 59.1 | 9.1 |
Employment Hours | 43.2 | 40.5 | 52.3 | 38.6 | 9.1 |
Wages and Benefits | 50.0 | 53.1 | 52.3 | 45.5 | 2.3 |
Input Costs | 69.8 | 60.8 | 72.1 | 25.6 | 2.3 |
Prices Received for Services | 30.3 | 42.2 | 32.6 | 65.1 | 2.3 |
Operating Margin | 11.6 | 21.8 | 27.9 | 55.8 | 16.3 |
| Indicator | Current Index | Previous Index | % Reporting Improved | % Reporting No Change | % Reporting Worsened |
Company Outlook | 67.4 | 55.4 | 72.1 | 23.3 | 4.7 |
| Indicator | Current Index | Previous Index | % Reporting Increase | % Reporting No Change | % Reporting Decrease |
Uncertainty | –7.0 | 12.7 | 20.9 | 51.2 | 27.9 |
Business Indicators: Year/Year
| Business Indicators: All Firms Current Quarter (versus same quarter a year ago) | |||||
| Indicator | Current Index | Previous Index | % Reporting Increase | % Reporting No Change | % Reporting Decrease |
Level of Business Activity | 67.5 | 66.7 | 77.0 | 13.5 | 9.5 |
Capital Expenditures | 66.9 | 55.5 | 75.0 | 16.9 | 8.1 |
Supplier Delivery Time | 30.4 | 19.3 | 49.6 | 31.2 | 19.2 |
Employment | 17.5 | 18.9 | 31.0 | 55.6 | 13.5 |
Employee Hours | 28.8 | 27.1 | 36.8 | 55.2 | 8.0 |
Wages and Benefits | 52.3 | 44.6 | 56.3 | 39.7 | 4.0 |
| Indicator | Current Index | Previous Index | % Reporting Improved | % Reporting No Change | % Reporting Worsened |
Company Outlook | 74.1 | 77.0 | 83.0 | 8.0 | 8.9 |
| Business Indicators: E&P Firms Current Quarter (versus same quarter a year ago) | |||||
| Indicator | Current Index | Previous Index | % Reporting Increase | % Reporting No Change | % Reporting Decrease |
Level of Business Activity | 59.5 | 61.3 | 70.2 | 19.0 | 10.7 |
Oil Production | 26.5 | 21.7 | 50.6 | 25.3 | 24.1 |
Natural Gas Wellhead Production | 36.5 | 28.6 | 52.4 | 31.7 | 15.9 |
Capital Expenditures | 68.3 | 52.3 | 75.6 | 17.1 | 7.3 |
Expected Level of Capital Expenditures Next Year | 67.1 | 61.3 | 73.2 | 20.7 | 6.1 |
Supplier Delivery Time | 30.9 | 13.0 | 48.8 | 33.3 | 17.9 |
Employment | 11.9 | 9.7 | 25.0 | 61.9 | 13.1 |
Employee Hours | 18.1 | 16.3 | 25.3 | 67.5 | 7.2 |
Wages and Benefits | 47.6 | 34.8 | 52.4 | 42.9 | 4.8 |
Finding and Development Costs | 54.2 | 42.2 | 60.2 | 33.7 | 6.0 |
Lease Operating Expenses | 48.8 | 43.7 | 57.3 | 34.1 | 8.5 |
| Indicator | Current Index | Previous Index | % Reporting Improved | % Reporting No Change | % Reporting Worsened |
Company Outlook | 72.9 | 77.8 | 82.4 | 8.1 | 9.5 |
| Business Indicators: O&G Support Services Firms Current Quarter (versus same quarter a year ago) | |||||
| Indicator | Current Index | Previous Index | % Reporting Increase | % Reporting No Change | % Reporting Decrease |
Level of Business Activity | 83.4 | 77.7 | 90.5 | 2.4 | 7.1 |
Utilization of Equipment | 78.0 | 70.5 | 82.9 | 12.2 | 4.9 |
Capital Expenditures | 64.3 | 62.2 | 73.8 | 16.7 | 9.5 |
Supplier Delivery Time | 29.2 | 32.5 | 51.2 | 26.8 | 22.0 |
Lag Time in Delivery of Firm's Services | 17.0 | 30.2 | 26.8 | 63.4 | 9.8 |
Employment | 28.6 | 37.8 | 42.9 | 42.9 | 14.3 |
Employment Hours | 50.0 | 48.8 | 59.5 | 31.0 | 9.5 |
Wages and Benefits | 61.9 | 64.4 | 64.3 | 33.3 | 2.4 |
Input Costs | 70.0 | 72.7 | 72.5 | 25.0 | 2.5 |
Prices Received for Services | 46.3 | 55.8 | 51.2 | 43.9 | 4.9 |
Operating Margin | 30.0 | 37.2 | 47.5 | 35.0 | 17.5 |
| Indicator | Current Index | Previous Index | % Reporting Improved | % Reporting No Change | % Reporting Worsened |
Company Outlook | 76.3 | 75.5 | 84.2 | 7.9 | 7.9 |
Activity Chart

Comments from Survey Respondents
These comments are from respondents’ completed surveys and have been edited for publication. Comments from the Special Questions survey can be found below the special questions.
Exploration and Production (E&P) Firms
- The push for going all green will cause more energy shortages and much higher prices. Like the pilot said, “Sit down and put your seat belts on. It’s going to get a bit bumpy.”
- It is impossible to make realistic assessments for capital expenditure budgets given the current administration’s policies and, for that reason, capital expenditure commitments are being restrained and limited. Why would any rational person feel comfortable with expanding capital commitments beyond minimum maintenance requirements at most when nominees at the federal level are hoping for bankruptcy and closure of the oil and gas sector.
- We’re keeping a watchful eye on price increases in the field.
- Inflation and labor availability are affecting our business. Rising supply-chain disruption and associated inflation have the potential to delay and impact drilling and completion activity in 2022.
- Despite us being one of the top-performing energy funds in America, investors are cutting our funding by 80 percent. We believe this is a two-edged sword—if it is happening to us, it is likely happening to everyone. Constrained capital will lead to significantly higher commodity prices. And it isn’t the administration’s fault—this is a Wall Street and environmental, social and governance-led charge.
- The political pressure forcing available capital away from the energy industry is a problem for everyone. Banks view lending to the energy industry as having a “political risk.” The capital availability has moved down-market to family offices, etc., and it is drastically reducing the size and availability of commitments regardless of commodity prices.
- Supply-chain issues continue to create logistical challenges, and it is difficult to plan and/or coordinate upstream operational activity. Labor shortages have contributed to this issue as well. Pandemic worries are definitely impacting the oil demand side, with resultant uncertainty with respect to commodity pricing and supply forecasting.
- The Permian [Basin] labor market continues to be tight but better in December 2021 than third quarter 2021 at the margin. Major power provider connections continue to be slow, with projected connection times falling behind schedule consistently. Power availability is a material headwind to efficient capital development and opportunity to electrify field operations for lower emissions. Electrical system components (transformers in particular) are in extremely short supply. Inflationary pressures continue to build in services.
- With the current administration in Washington being so anti-fossil-fuel industry, I question how much longer I will stay in the business. The good news is that they have so little understanding of the free market that prices usually spike with the Democrats in charge.
- The main question related to energy policy on federal lands is how outwardly punitive do they want to be in the face of obvious energy-related inflation.
- My main issue of uncertainty is due to politics in Washington.
- Availability of workover rigs is a big problem. Costs for supplies have jumped up.
- Our finances have improved significantly. Uncertainty over what the administration will do to the oil and gas industry keeps me from investing too heavily in oil and gas at this time.
- Our bank forced us to release our rig, per an agreement last year at the time of our credit facility extension to cap our capital budget. We hit the cap in October and reluctantly released our only drilling rig. We’ve signed a yearlong contract for 2022, when we will not have the bank limitation and plan to run a continuous drilling program for years to come unless oil prices drop below $50 per barrel for a sustained period.
- The COVID-19 virus and vaccination levels will continue the same trend that is occurring now. World economic activity will increase. Our weak image to the world is inviting conflict. Conflict will be instrumental in energy prices. Liquefied natural gas has changed natural gas from being domestic energy to global energy. [Global] demand now on domestic production raises the pricing mechanism. Rig counts and permits are not going to drive pricing down. Regulations and climate shaming on money providers will hinder development of production.
- The regulatory environment in our state has led us to the decision to sell all of our operated and nonoperated interests. We believe the future for oil and gas in our state is not good.
- Uncertainty is the main concern for our firm. Also, how will inflation and the countless waves of COVID-19 craziness affect demand going forward? Overall, we’re positive about the energy outlook but still have some ongoing concerns.
- We are feeling pressure and delays from governmental agencies in ways that will require added costs and additional time for project completion.
- Fossil fuels have been affected by the same economic repercussions caused by COVID-19, supply-chain issues, and anti-oil and gas sentiment in both the state and federal governments. The oil community I live in feels the regulatory pressures, cost increases and general anti-oil public sentiment. This may cause many small producers to sell their companies or cut back drastically. The higher oil prices of $75 per barrel have kept many small producers engaged. My concern for the future is for the very small producers.
- With the Omicron variant having a [dampening] impact on oil pricing, it is anticipated that we will see an increase in oil pricing throughout 2022.
Oil and Gas Support Services Firms
- Hiring qualified personnel is a huge issue for our firm.
- We are seeing an across-the-board increase in demand for our services, but we are fighting to get back to acceptable margins for our products and services.
- There is a lot of uncertainty about commodity prices and activity. Many small to medium-sized service companies are just managing to remain in business. Current activity and service company pricing do not provide enough income for the service industry to remain healthy. Unless there is a marked improvement in pricing, I expect there will be many more companies exiting the business. Service companies have very little access to new capital, and cash reserves are being exhausted.
- Attracting and retaining new employees continues to be a challenge for oilfield services.
- I am a one-pickup-and-trailer hot shot. Most of the companies that we were running for are closed right now. My company is woman-owned by myself, but the companies that are open and using hot shots still put me in the same pot with big trucking companies which demand $5 million in liability coverage and $1 million in cargo. I can’t compete, and I may be closed soon.
- Demand from our Middle East clients has been erratic. European suppliers are busy and do not have bandwidth for small orders. We are seeing increased activity in the fourth quarter of 2021 from Trinidad, Europe and Australia.
Questions regarding the Dallas Fed Energy Survey can be addressed to Michael Plante at Michael.Plante@dal.frb.org or Kunal Patel at Kunal.Patel@dal.frb.org.
Sign up for our email alert to be automatically notified as soon as the latest Dallas Fed Energy Survey is released on the web.