Special Questions

Special Questions
For this month’s survey, Texas business executives were asked supplemental questions on labor market conditions and capital expenditures. Results below include responses from participants from both the Texas Manufacturing Outlook Survey and Texas Service Sector Outlook Survey.
Texas Business Outlook Surveys
Data were collected January 13-21 and 315 Texas business executives responded to the surveys.
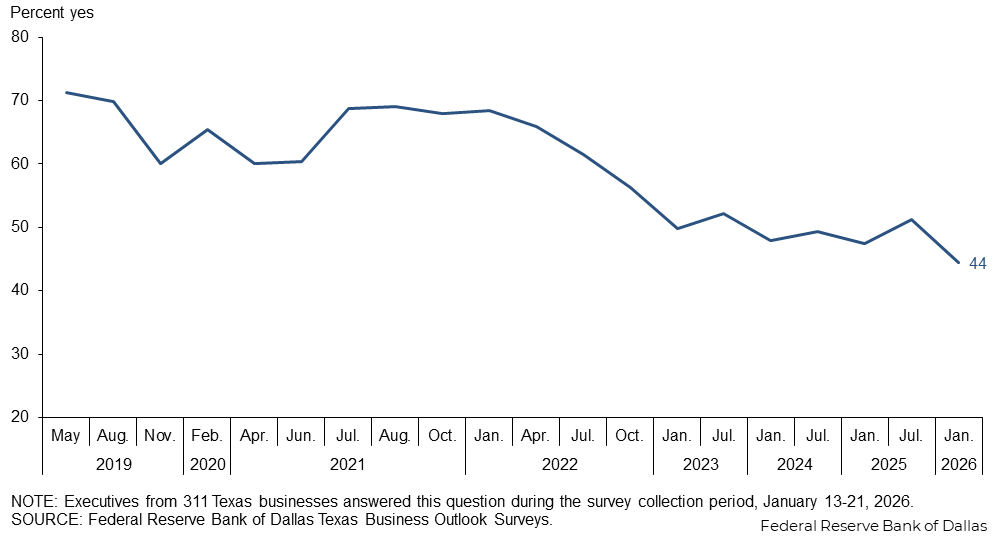
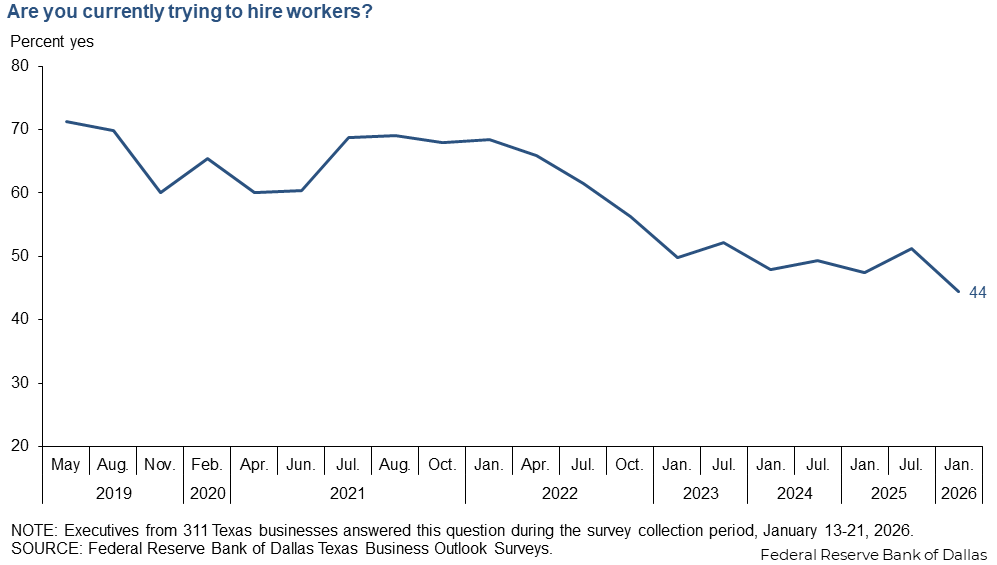
Forty-four percent of surveyed firms are currently trying to hire, down from 51 percent in July 2025 and representing the lowest share since this question was first posed in 2019.
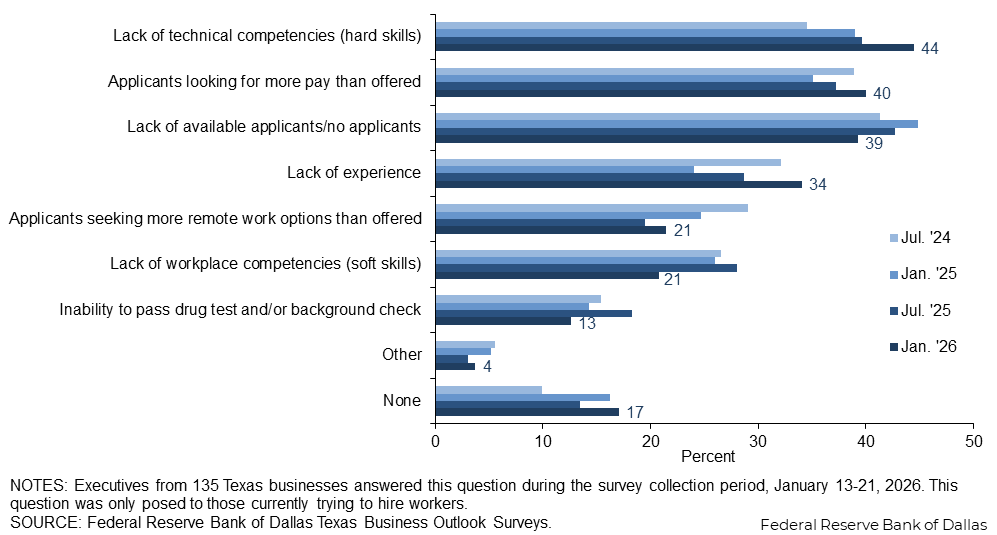
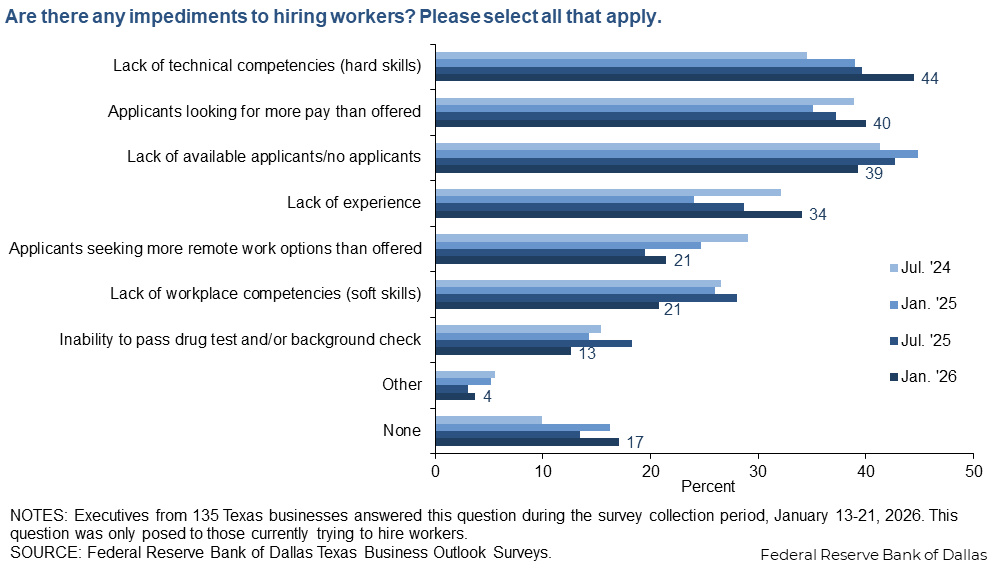
Lack of hard skills among applicants became the top hiring impediment, followed by applicants looking for more pay than offered. Lack of applicants retreated as an obstacle, while the share of respondents citing lack of experience increased.
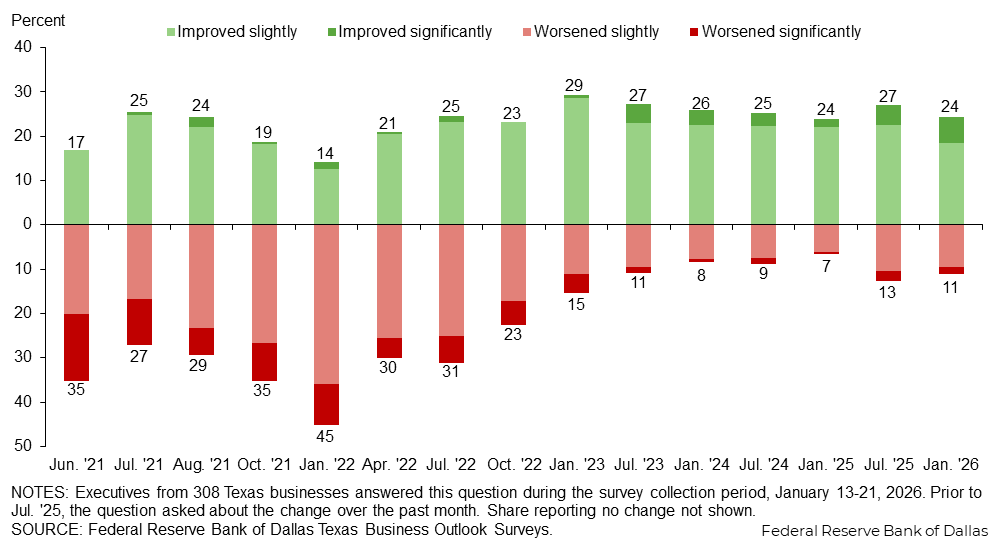
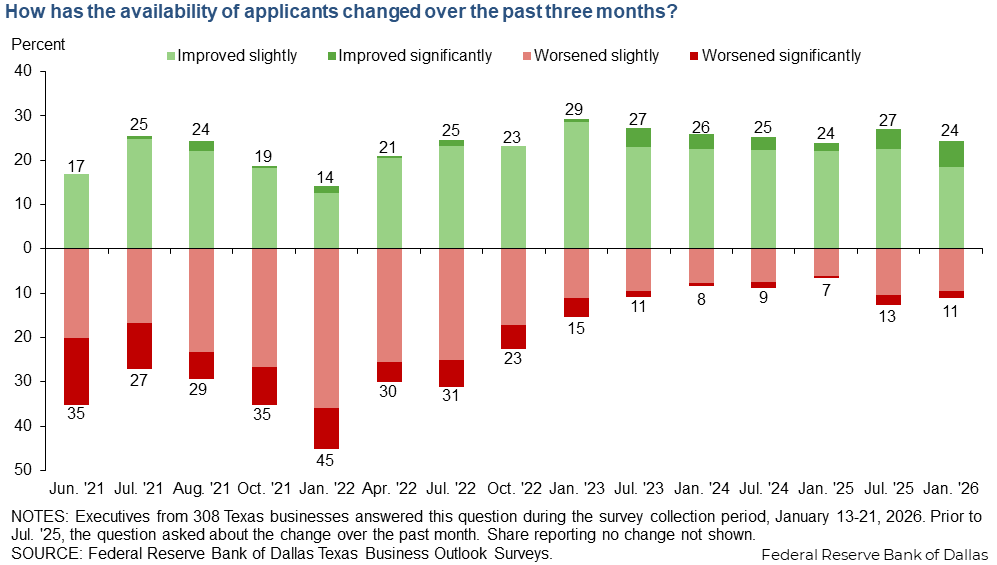
Availability of applicants improved on net over the past three months, a continuation of the trend since the beginning of 2023.
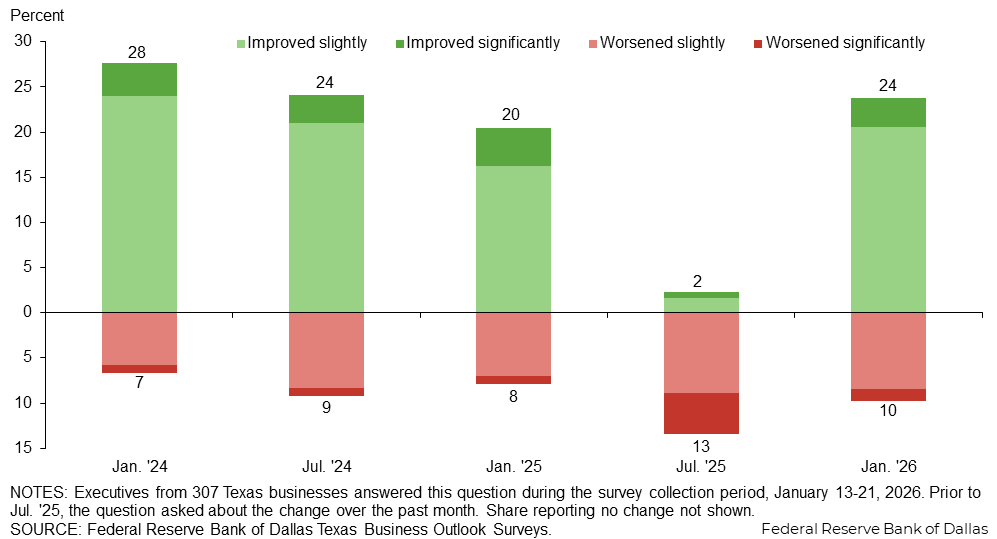
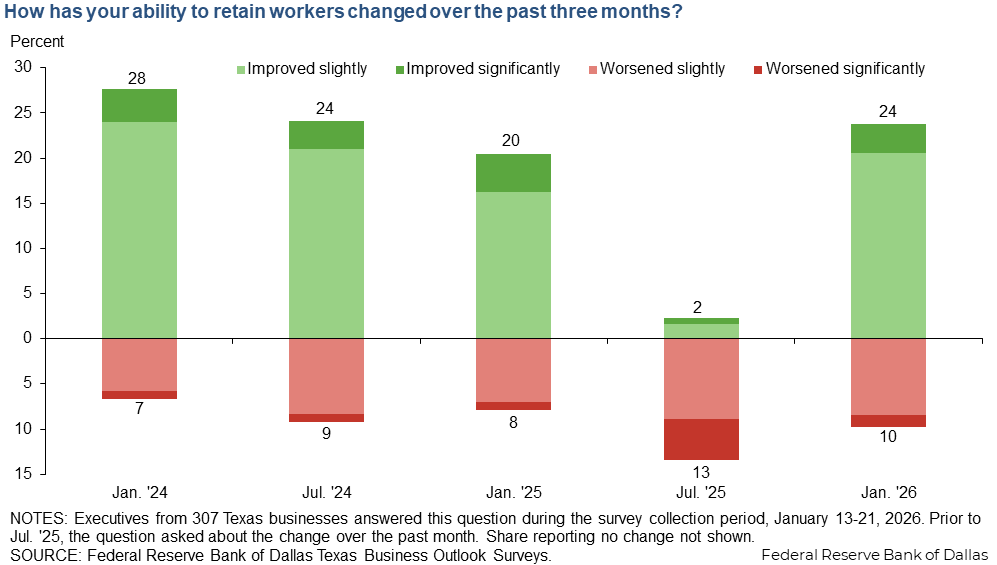
Worker retention has become easier over the past three months on net, a change from mid-2025, though the majority of firms (66 percent) notes no change in their ability to retain workers.
Nearly a quarter of firms that employ foreign-born workers reported an impact from immigration policy changes, with the majority saying the impact to overall operations is slight.
| Jan. '26 (percent) |
|
| Yes, in a way that significantly impacts our overall operations | 7.4 |
| Yes, in a way that slightly impacts our overall operations | 15.7 |
| No | 77.0 |
NOTES: 217 responses. These calculations exclude the 29.5 percent of respondents selecting “Not applicable.” The survey posed a similar question in July 2025.
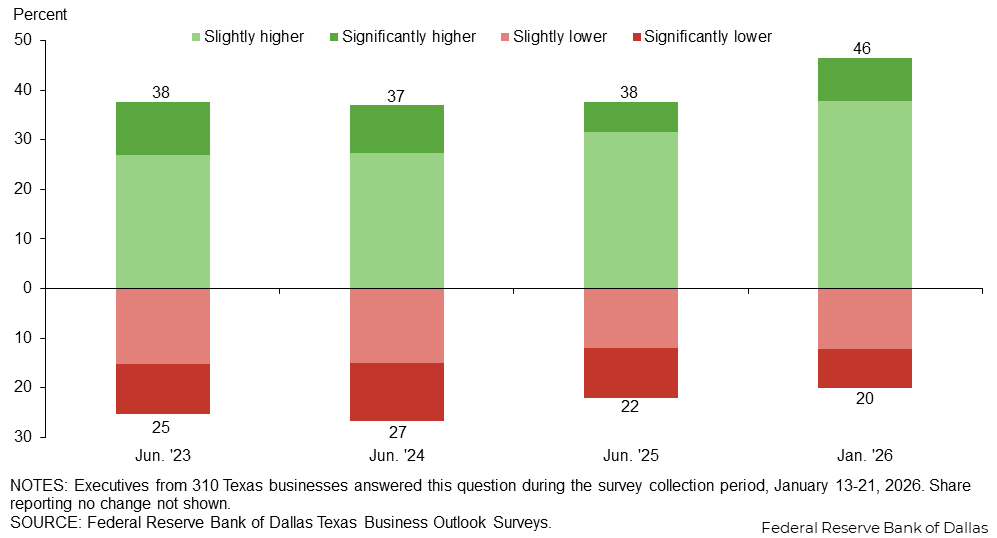
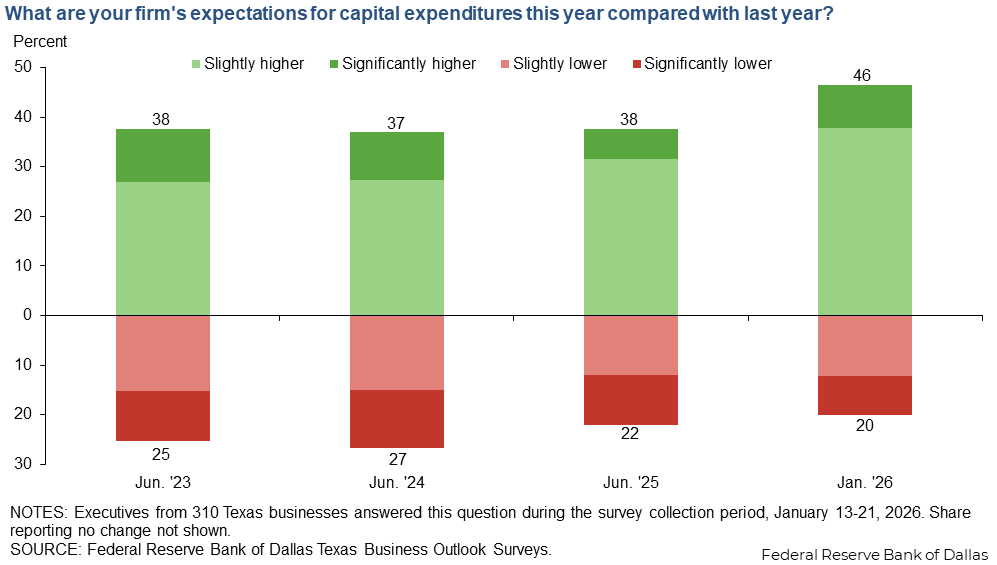
Of the Texas firms surveyed, 46 percent expect growth in capital expenditures this year, exceeding the 20 percent share expecting lower spending. This represents a more positive capital expenditures outlook on net than the prior two years, particularly in the manufacturing sector.
Software and computers were most widely cited as areas where firms are planning to increase capital spending this year. Among manufacturers, machinery tops the list.
| Jan. '26 (percent) |
|
| Software and software development | 29.5 |
| Computers and computer equipment | 28.1 |
| Machinery (including repair, maintenance and new purchases) | 26.2 |
| Buildings (including upgrades, expansion and new construction) | 24.5 |
| Vehicles | 12.6 |
| Furniture and fixtures | 11.9 |
| Land and land improvements (including roads, parking lots, irrigation, landscaping, etc.) | 10.6 |
| Other | 5.3 |
| None | 30.5 |
NOTE: 302 responses.
Survey respondents were given the opportunity to also provide comments, which can be found in the Comments tab above.
Texas Manufacturing Outlook Survey
Data were collected January 13-21 and 80 Texas manufacturers responded to the survey.
| Jan. '23 (percent) |
Jul. '23 (percent) |
Jan. '24 (percent) |
Jul. '24 (percent) |
Jan. '25 (percent) |
Jul. '25 (percent) |
Jan. '26 (percent) |
|
| Yes | 52.0 | 55.4 | 46.1 | 46.2 | 42.5 | 43.4 | 43.0 |
| No | 48.0 | 44.6 | 53.9 | 53.8 | 57.5 | 56.6 | 57.0 |
NOTE: 79 responses.
| Jan. '23 (percent) |
Jul. '23 (percent) |
Jan. '24 (percent) |
Jul. '24 (percent) |
Jan. '25 (percent) |
Jul. '25 (percent) |
Jan. '26 (percent) |
|
| Lack of technical competencies (hard skills) | 69.2 | 60.9 | 63.4 | 41.7 | 52.9 | 51.5 | 47.1 |
| Applicants looking for more pay than offered | 44.2 | 45.7 | 31.7 | 33.3 | 35.3 | 36.4 | 41.2 |
| Lack of available applicants/no applicants | 69.2 | 56.5 | 53.7 | 36.1 | 35.3 | 42.4 | 38.2 |
| Lack of experience | 50.0 | 56.5 | 39.0 | 25.0 | 32.4 | 27.3 | 29.4 |
| Lack of workplace competencies (soft skills) | 46.2 | 30.4 | 29.3 | 19.4 | 29.4 | 24.2 | 23.5 |
| Inability to pass drug test and/or background check | 40.4 | 23.9 | 19.5 | 19.4 | 20.6 | 24.2 | 20.6 |
| Applicants seeking more remote work options than offered | 12.2 | 22.2 | 20.6 | 9.1 | 11.8 | ||
| Other | 1.9 | 0.0 | 2.4 | 5.6 | 2.9 | 6.1 | 2.9 |
| None | 1.9 | 4.3 | 9.8 | 16.7 | 23.5 | 18.2 | 23.5 |
NOTES: 34 responses. This question was only posed to those currently trying to hire workers. “Applicants seeking more remote work options than offered" was added in Jan. ’24.
| Jan. '23 (percent) |
Jul. '23 (percent) |
Jan. '24 (percent) |
Jul. '24 (percent) |
Jan. '25 (percent) |
Jul. '25 (percent) |
Jan. '26 (percent) |
|
| Improved significantly | 0.0 | 4.9 | 3.4 | 3.9 | 1.2 | 5.4 | 6.3 |
| Improved slightly | 22.9 | 22.2 | 25.0 | 23.7 | 21.0 | 23.0 | 16.5 |
| No change | 60.0 | 65.4 | 64.8 | 59.2 | 69.1 | 56.8 | 59.5 |
| Worsened slightly | 11.4 | 7.4 | 4.5 | 9.2 | 7.4 | 12.2 | 15.2 |
| Worsened significantly | 5.7 | 0.0 | 2.3 | 3.9 | 1.2 | 2.7 | 2.5 |
NOTES: 79 responses. Prior to July ’25, the question asked about the change over the past month.
| Jan. '24 (percent) |
Jul. '24 (percent) |
Jan. '25 (percent) |
Jul. '25 (percent) |
Jan. '26 (percent) |
|
| Improved significantly | 7.9 | 3.9 | 6.2 | 0.0 | 2.5 |
| Improved slightly | 24.7 | 27.6 | 19.8 | 0.0 | 24.1 |
| No change | 59.6 | 63.2 | 65.4 | 90.1 | 62.0 |
| Worsened slightly | 6.7 | 3.9 | 8.6 | 8.5 | 10.1 |
| Worsened significantly | 1.1 | 1.3 | 0.0 | 1.4 | 1.3 |
NOTES: 79 responses. Prior to July ’25, the question asked about the change over the past month.
| Jan. '26 (percent) |
|
| Yes, in a way that significantly impacts our overall operations | 10.5 |
| Yes, in a way that slightly impacts our overall operations | 12.3 |
| No | 77.2 |
NOTES: 57 responses. These calculations exclude the 27.8 percent of respondents selecting “Not applicable.” The survey posed a similar question in July 2025.
| Jun. '23 (percent) |
Jun. '24 (percent) |
Jun. '25 (percent) |
Jan. '26 (percent) |
|
| Significantly higher | 13.6 | 16.0 | 8.3 | 10.1 |
| Slightly higher | 27.2 | 27.2 | 36.1 | 44.3 |
| No change | 30.9 | 25.9 | 23.6 | 24.1 |
| Slightly lower | 12.3 | 11.1 | 15.3 | 10.1 |
| Significantly lower | 16.0 | 19.8 | 16.7 | 11.4 |
NOTE: 79 responses.
| Jan. '26 (percent) |
|
| Machinery (including repair, maintenance and new purchases) | 51.3 |
| Buildings (including upgrades, expansion and new construction) | 26.9 |
| Computers and computer equipment | 24.4 |
| Software and software development | 20.5 |
| Land and land improvements (including roads, parking lots, irrigation, landscaping, etc.) | 10.3 |
| Vehicles | 10.3 |
| Furniture and fixtures | 6.4 |
| Other | 5.1 |
| None | 25.6 |
NOTE: 78 responses.
Survey respondents were given the opportunity to also provide comments, which can be found in the Comments tab above.
Texas Service Sector Outlook Survey
Data were collected January 13-21 and 235 Texas business executives responded to the surveys.
| Jan. '23 (percent) |
Jul. '23 (percent) |
Jan. '24 (percent) |
Jul. '24 (percent) |
Jan. '25 (percent) |
Jul. '25 (percent) |
Jan. '26 (percent) |
|
| Yes | 49.2 | 51.3 | 48.6 | 50.4 | 49.0 | 53.7 | 44.8 |
| No | 50.8 | 48.7 | 51.4 | 49.6 | 51.0 | 46.3 | 55.2 |
NOTE: 232 responses.
| Jan. '23 (percent) |
Jul. '23 (percent) |
Jan. '24 (percent) |
Jul. '24 (percent) |
Jan. '25 (percent) |
Jul. '25 (percent) |
Jan. '26 (percent) |
|
| Lack of technical competencies (hard skills) | 44.2 | 43.9 | 40.2 | 32.5 | 35.0 | 36.6 | 43.6 |
| Lack of available applicants/no applicants | 70.1 | 54.7 | 47.7 | 42.9 | 47.5 | 42.7 | 39.6 |
| Applicants looking for more pay than offered | 53.2 | 57.6 | 47.0 | 40.5 | 35.0 | 37.4 | 39.6 |
| Lack of experience | 40.3 | 40.3 | 28.0 | 34.1 | 21.7 | 29.0 | 35.6 |
| Applicants seeking more remote work options than offered | 20.5 | 31.0 | 25.8 | 22.1 | 24.8 | ||
| Lack of workplace competencies (soft skills) | 29.9 | 26.6 | 21.2 | 28.6 | 25.0 | 29.0 | 19.8 |
| Inability to pass drug test and/or background check | 16.2 | 16.5 | 18.2 | 14.3 | 12.5 | 16.8 | 9.9 |
| Other | 5.8 | 5.0 | 6.1 | 5.6 | 5.8 | 2.3 | 4.0 |
| None | 4.5 | 5.8 | 12.9 | 7.9 | 14.2 | 12.2 | 14.9 |
NOTES: 101 responses. This question was only posed to those currently trying to hire workers. “Applicants seeking more remote work options than offered" was added in Jan. ’24.
| Jan. '23 (percent) |
Jul. '23 (percent) |
Jan. '24 (percent) |
Jul. '24 (percent) |
Jan. '25 (percent) |
Jul. '25 (percent) |
Jan. '26 (percent) |
|
| Improved significantly | 0.9 | 4.0 | 3.4 | 2.8 | 2.1 | 4.1 | 5.7 |
| Improved slightly | 30.6 | 23.2 | 21.8 | 21.8 | 22.4 | 22.5 | 19.2 |
| No change | 53.7 | 60.9 | 65.8 | 67.7 | 69.7 | 61.5 | 66.4 |
| Worsened slightly | 11.1 | 10.1 | 8.6 | 6.9 | 5.8 | 9.8 | 7.4 |
| Worsened significantly | 3.7 | 1.8 | 0.4 | 0.8 | 0.0 | 2.0 | 1.3 |
NOTES: 229 responses. Prior to July ’25, the question asked about the change over the past month.
| Jan. '24 (percent) |
Jul. '24 (percent) |
Jan. '25 (percent) |
Jul. '25 (percent) |
Jan. '26 (percent) |
|
| Improved significantly | 2.2 | 2.8 | 3.7 | 0.8 | 3.5 |
| Improved slightly | 23.8 | 19.0 | 15.0 | 2.1 | 19.3 |
| No change | 67.8 | 67.7 | 73.6 | 82.6 | 68.0 |
| Worsened slightly | 5.5 | 9.7 | 6.5 | 9.1 | 7.9 |
| Worsened significantly | 0.7 | 0.8 | 1.2 | 5.4 | 1.3 |
NOTES: 228 responses. Prior to July ’25, the question asked about the change over the past month.
| Jan. '26 (percent) |
|
| Yes, in a way that significantly impacts our overall operations | 6.3 |
| Yes, in a way that slightly impacts our overall operations | 16.9 |
| No | 76.9 |
NOTES: 160 responses. These calculations exclude the 30.1 percent of respondents selecting “Not applicable.” The survey posed a similar question in July 2025.
| Jun. '23 (percent) |
Jun. '24 (percent) |
Jun. '25 (percent) |
Jan. '26 (percent) |
|
| Significantly higher | 9.8 | 7.5 | 5.5 | 8.2 |
| Slightly higher | 26.9 | 27.4 | 30.1 | 35.5 |
| No change | 38.9 | 39.7 | 45.3 | 36.8 |
| Slightly lower | 16.0 | 16.3 | 11.0 | 13.0 |
| Significantly lower | 8.4 | 9.1 | 8.1 | 6.5 |
NOTE: 231 responses.
| Jan. '26 (percent) |
|
| Software and software development | 32.6 |
| Computers and computer equipment | 29.5 |
| Buildings (including upgrades, expansion and new construction) | 23.7 |
| Machinery (including repair, maintenance and new purchases) | 17.4 |
| Furniture and fixtures | 13.8 |
| Vehicles | 13.4 |
| Land and land improvements (including roads, parking lots, irrigation, landscaping, etc.) | 10.7 |
| Other | 5.4 |
| None | 32.1 |
NOTE: 224 responses.
Survey respondents were given the opportunity to also provide comments, which can be found in the Comments tab above.
Questions regarding the Texas Business Outlook Surveys can be addressed to Emily Kerr at emily.kerr@dal.frb.org.
Sign up for our email alert to be automatically notified as soon as the latest surveys are released on the web.
Special Questions Comments
Survey participants are given the opportunity to submit comments. Some comments have been edited for grammar and clarity.