Texas Manufacturing Outlook Survey
June 27, 2016
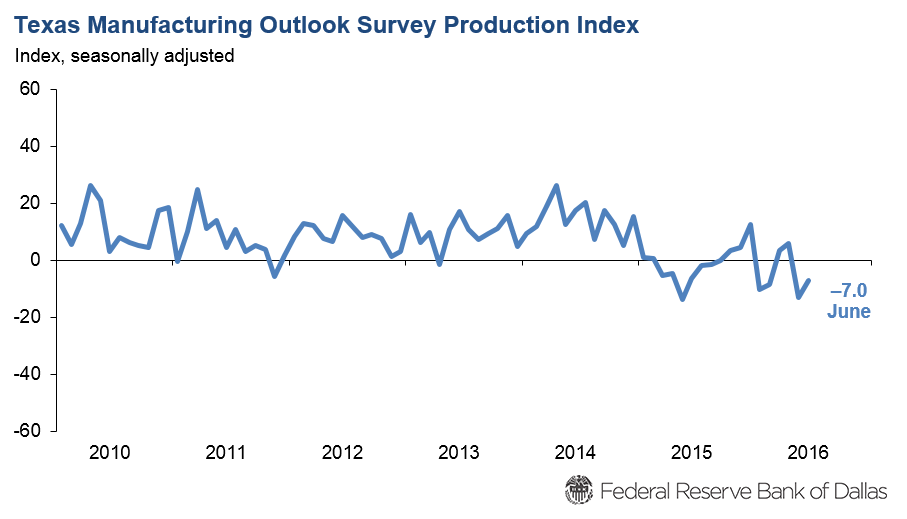
Texas Manufacturing Activity Declines Again
What's New This Month
For this month's survey, Texas business executives were asked supplemental questions on the impact of lower energy prices. Results for these questions from the Texas Manufacturing Outlook Survey (TMOS), Texas Service Sector Outlook Survey (TSSOS) and Texas Retail Outlook Survey (TROS) have been released together. Read Special Questions results.
Texas factory activity declined again in June, according to business executives responding to the Texas Manufacturing Outlook Survey. The production index, a key measure of state manufacturing conditions, posted a second consecutive negative reading but rose from -13.1 to -7.0, suggesting the pace of contraction eased somewhat from May.
Other measures of current manufacturing activity also reflected continued declines this month. The new orders index held steady at -14.2, while the growth rate of orders index fell four points to -18.6. The capacity utilization and shipments indexes remained negative for a second month but edged up, coming in at -9.3 and -8.6, respectively.
Perceptions of broader business conditions stayed pessimistic in June. The general business activity index has been negative since January 2015 and came in at -18.3 this month, up slightly from its May reading. The company outlook index posted a seventh consecutive negative reading but rose 5 points to -11.0.
Labor market measures indicated a sixth month of contraction in a row in June. The employment index fell to -11.5, its lowest reading since November 2009. The decline in the index was largely due to a falloff in the share of firms adding to headcounts. Only six percent of firms noted net hiring in June, down from 16 percent last month and well below the 18 percent noting net layoffs. The hours worked index edged down one point to -12.8, signaling continued contraction in workweek length.
Price pressures were mixed, and wages continued to rise. Input costs rose for a third month in a row, as the raw materials prices index held steady at 12.6. Selling prices continued to decline, with the finished goods prices index edging down to -5.2 in June. Meanwhile, the wages and benefits index stayed positive and relatively unchanged at 21.6, suggesting a continued rise in compensation.
Expectations regarding future business conditions improved in June. The index of future general business activity bounced back to a positive reading of 2.6 after dipping below zero last month. The index of future company outlook also ticked up, coming in at 7.9. Most indexes for future manufacturing activity pushed further into positive territory in June.
Next release: July 25, 2016
The Dallas Fed conducts the Texas Manufacturing Outlook Survey monthly to obtain a timely assessment of the state’s factory activity. Data were collected June 14–22, and 114 Texas manufacturers responded to the survey. Firms are asked whether output, employment, orders, prices and other indicators increased, decreased or remained unchanged over the previous month. Survey responses are used to calculate an index for each indicator. Each index is calculated by subtracting the percentage of respondents reporting a decrease from the percentage reporting an increase. When the share of firms reporting an increase exceeds the share reporting a decrease, the index will be greater than zero, suggesting the indicator has increased over the prior month. If the share of firms reporting a decrease exceeds the share reporting an increase, the index will be below zero, suggesting the indicator has decreased over the prior month. An index will be zero when the number of firms reporting an increase is equal to the number of firms reporting a decrease. Data have been seasonally adjusted as necessary. |
June 27, 2016
Click on links in the table for greater details. Historical data are available from June 2004 to the most current release month.
| Business Indicators Relating to Facilities and Products in Texas Current (versus previous month) | ||||||||
| Indicator | Jun Index | May Index | Change | Indicator Direction* | Trend** (Months) | % Reporting Increase | % Reporting No Change | % Reporting Decrease |
–7.0 | –13.1 | +6.1 | Decreasing | 2 | 22.4 | 48.3 | 29.4 | |
–9.3 | –11.0 | +1.7 | Decreasing | 2 | 17.9 | 54.9 | 27.2 | |
–14.2 | –14.9 | +0.7 | Decreasing | 2 | 19.9 | 45.9 | 34.1 | |
–18.6 | –14.7 | –3.9 | Decreasing | 20 | 14.2 | 53.0 | 32.8 | |
–13.6 | –9.3 | –4.3 | Decreasing | 19 | 13.3 | 59.8 | 26.9 | |
–8.6 | –11.5 | +2.9 | Decreasing | 2 | 22.3 | 46.8 | 30.9 | |
–7.6 | –4.6 | –3.0 | Decreasing | 7 | 6.6 | 79.2 | 14.2 | |
–6.0 | –2.5 | –3.5 | Decreasing | 11 | 16.4 | 61.2 | 22.4 | |
–4.4 | –8.1 | +3.7 | Decreasing | 2 | 14.0 | 67.5 | 18.4 | |
12.6 | 12.4 | +0.2 | Increasing | 3 | 21.4 | 69.8 | 8.8 | |
–5.2 | –3.3 | –1.9 | Decreasing | 18 | 8.0 | 78.8 | 13.2 | |
21.6 | 21.8 | –0.2 | Increasing | 79 | 25.2 | 71.2 | 3.6 | |
–11.5 | –6.7 | –4.8 | Decreasing | 6 | 6.4 | 75.7 | 17.9 | |
–12.8 | –11.8 | –1.0 | Decreasing | 6 | 11.4 | 64.4 | 24.2 | |
–2.1 | –6.6 | +4.5 | Decreasing | 2 | 14.2 | 69.5 | 16.3 | |
| General Business Conditions Current (versus previous month) | ||||||||
| Indicator | Index | May Index | Change | Indicator Direction* | Trend** (Months) | % Reporting Improved | % Reporting No Change | % Reporting Worsened |
–11.0 | –16.1 | +5.1 | Worsening | 7 | 13.2 | 62.6 | 24.2 | |
–18.3 | –20.8 | +2.5 | Worsening | 18 | 12.1 | 57.5 | 30.4 | |
| Business Indicators Relating to Facilities and Products in Texas Future (six months ahead) | ||||||||
| Indicator | Jun Index | May Index | Change | Indicator Direction* | Trend** (Months) | % Reporting Increase | % Reporting No Change | % Reporting Decrease |
27.1 | 24.6 | +2.5 | Increasing | 88 | 39.7 | 47.8 | 12.6 | |
21.9 | 25.7 | –3.8 | Increasing | 88 | 34.5 | 52.9 | 12.6 | |
26.6 | 24.0 | +2.6 | Increasing | 88 | 38.4 | 49.7 | 11.8 | |
20.3 | 10.2 | +10.1 | Increasing | 88 | 28.3 | 63.7 | 8.0 | |
2.1 | 2.1 | 0.0 | Increasing | 9 | 15.9 | 70.3 | 13.8 | |
27.6 | 24.4 | +3.2 | Increasing | 88 | 40.6 | 46.3 | 13.0 | |
0.5 | –4.4 | +4.9 | Increasing | 1 | 9.4 | 81.7 | 8.9 | |
–10.2 | –6.7 | –3.5 | Decreasing | 2 | 14.8 | 60.2 | 25.0 | |
–10.2 | –8.6 | –1.6 | Decreasing | 4 | 12.0 | 65.7 | 22.2 | |
14.8 | 20.0 | –5.2 | Increasing | 87 | 18.5 | 77.8 | 3.7 | |
6.7 | 3.8 | +2.9 | Increasing | 5 | 14.2 | 78.3 | 7.5 | |
31.6 | 31.4 | +0.2 | Increasing | 145 | 34.6 | 62.4 | 3.0 | |
12.2 | 2.7 | +9.5 | Increasing | 43 | 25.4 | 61.4 | 13.2 | |
4.6 | –4.4 | +9.0 | Increasing | 1 | 18.5 | 67.6 | 13.9 | |
7.7 | 2.9 | +4.8 | Increasing | 79 | 18.3 | 71.2 | 10.6 | |
| General Business Conditions Future (six months ahead) | ||||||||
| Indicator | Index | May Index | Change | Indicator Direction* | Trend** (Months) | % Reporting Increase | % Reporting No Change | % Reporting Worsened |
7.9 | 4.4 | +3.5 | Improving | 5 | 22.1 | 63.7 | 14.2 | |
2.6 | –1.8 | +4.4 | Improving | 1 | 19.3 | 64.0 | 16.7 | |
*Indicator direction refers to this month's index. If index is positive (negative), indicator is increasing (decreasing) or improving (worsening). If zero, indicator is unchanged.
**Number of months moving in current direction.
Data have been seasonally adjusted as necessary.
June 27, 2016
Comments from Survey Respondents
These comments are from respondents' completed surveys and have been edited for publication.
Primary Metal Manufacturing
- I have a feeling that business has slowed down. New orders have decreased and phone activity has been slowing over the past two months.
- Projected sales improved slightly in June.
Fabricated Metal Product Manufacturing
- Summer is the slowest time of the year for our business. We will be going to a four-day workweek.
- Bookings have become less choppy and are gaining some momentum. Steel prices are rising, which necessitated passing price increases on to our customers. We view this positively. Our three publicly-available leading indicators for low-rise (less than five stories) nonresidential construction starts measured in square feet are single family residential starts, mixed practice Architecture Billings Index, and the Conference Board Leading Economic Index. Together and seasonally adjusted these three indicators have a 97 percent correlation with Dodge historically-reported actual low-rise nonresidential construction starts and point to 7-8 percent year-over-year growth for the remainder of the year.
- Some Midcontinent and Permian Basin oil and gas exploration and production companies have increased their activity and demand for our products. However, the consensus remains a wait-and-see approach. We have seen a slight increase in order activity but orders are relatively small and short-lived while continuity is questionable.
- Based on year-to-date customer orders compared with the same period in 2015: 25 percent of customers have increased purchases (including new customers), 55 percent of customers have decreased purchases, and 20 percent of customers have ordered nothing. Revenue has declined 28 percent over the same period. Customers remain very cautious with their inventory levels.
Machinery Manufacturing
- Low oil prices continue to have a negative effect on general industry and business in South Texas.
- The oil industry is suffering due to the crude price plunge worse now than in the 1980s. For the ninth month U.S. industrial production declined year over year. This is a recession. There is a continued significant negative impact due to the downturn in the energy industry as a result of weak commodity prices. Recent slight improvement in commodity prices is having no positive impact on business conditions, although it may be slowing the pace of deceleration in business activity.
- Orders continue to be steady. Wages and benefits are rising at an increased rate that will require price increases to be implemented or a deterioration in margins.
- Tariffs applied to steel imports are adversely affecting small to medium business and consumers to a greater extent than the help provided to the large U.S. steel producers. With tariff protection, steel companies are reducing capacity and simultaneously raising pricing beyond just the basics of supply and demand. This is not good for the majority over the long run.
- There are some prospects for improvements in land drilling, but our business—deepwater drilling—looks to be in deep trouble. The number of rigs that are being stacked and the long lead time to bring those rigs back into service makes the outlook very pessimistic. We'll have to find an alternative or face a shell of a company.
Computer and Electronic Product Manufacturing
- Industrial production and machinery exports are hurting big time. The global economy, dollar and EuroAsia financial problems are not helping American manufacturers.
- Macroeconomic concerns are causing softening in demand.
Electrical Equipment, Appliance, and Component Manufacturing
- We are at a pretty steady state. It is hard to completely judge June until it is over. The last week of the month can be pretty big due to our industry’s accounts receivables dating, which lures people to take shipments after the 25th of any month. In general we have been telling people for a couple years that things are "ok" or "good," but not great. Pricing for our products is dependent on competitors to a large degree and that is also very unpredictable.
Transportation Equipment Manufacturing
- Our business is seasonal, so we generally see a downturn in fall/winter. This is not an indication of economic conditions.
- The economy is nervous, shaky and uncertain. Fed policy has us locked into a lethargic and tenuous position. It appears the Fed doesn’t know how to get off the horse it created. The Fed talks interest rate increases but looks for every reason not to do it. Until the Fed backs out of trying to manage the economy, we will be stuck on the cusp of slow growth and a recession. Add the difficulty in getting commercial and retail financing and rising employee costs (health care, minimum wage threats and the ridiculous overtime executive order), and hiring for many of us will be minimal. We cannot have millions of people out of the workforce and be healthy economically—they are a burden not a benefit.
Food Manufacturing
- We are bringing on another facility in March 2017, which will increase our capacity significantly.
- Business remains fairly flat other than some new product successes.
Textile Product Mills
- Labor availability in Juarez and other areas of Mexico has tightened considerably.
Wood Product Manufacturing
- We are nearly halfway through the year, and results exceed expectations by slightly more than 5 percent. Customer demand remains elevated. We expect the second half to equal or exceed the first, with monthly results within a tight range +/-. Our market is exclusively single-family new home builders in Dallas–Fort Worth.
Paper Manufacturing
- We saw a slight increase from May, although it was an easy comparison as May was a very slow month.
Printing and Related Support Activities
- June has become stupid slow for us, and we are not sure why. We have a decent backlog of work but nothing is here for us to work on now. We are very worried about this goofy decision by the Department of Labor to adjust salary levels for overtime; that makes zero sense to us and will have a negative impact on how we go about compensating office people.
Miscellaneous Manufacturing
- We are experiencing major demand instability in the U.S. Continued management focus on upcoming regulatory changes is keeping us from pursuing new markets (especially internationally) and delaying making long-term investments. Major human resources policy updates and changes have resulted in eliminating positions (in the future as people are promoted or leave the company they will not be replaced) and considering moving all salary people who do not travel to hourly. Although we need more people, we are increasing the requirements for the open positions to reflect higher cost thresholds and most likely will delay hiring decisions for most positions until the impacts of the changes are fully understood.
- The Affordable Care Act (ACA) continues a downward push on productivity as it limits our hiring because we can't afford the estimated 60 percent increase in health care premiums that an ACA-compliant policy would cost. Steel raw material costs are rising, but the steel scrap is falling, therefore increasing our costs. Customers are not accepting price increases. It is slow, and the general business climate seems tepid at best.
Historical Data
Historical data can be downloaded dating back to June 2004.
Indexes
Download indexes for all indicators. For the definitions of all variables, see Data Definitions.
| Unadjusted |
| Seasonally adjusted |
All Data
Download indexes and components of the indexes (percentage of respondents reporting increase, decrease, or no change). For the definitions of all variables, see Data Definitions.
| Unadjusted |
| Seasonally adjusted |
Questions regarding the Texas Manufacturing Outlook Survey can be addressed to Emily Kerr at emily.kerr@dal.frb.org.
Sign up for our e-mail alert to be automatically notified as soon as the latest Texas Manufacturing Outlook Survey is released on the web.