Texas Manufacturing Outlook Survey

Texas manufacturing activity accelerates, though employment remains flat
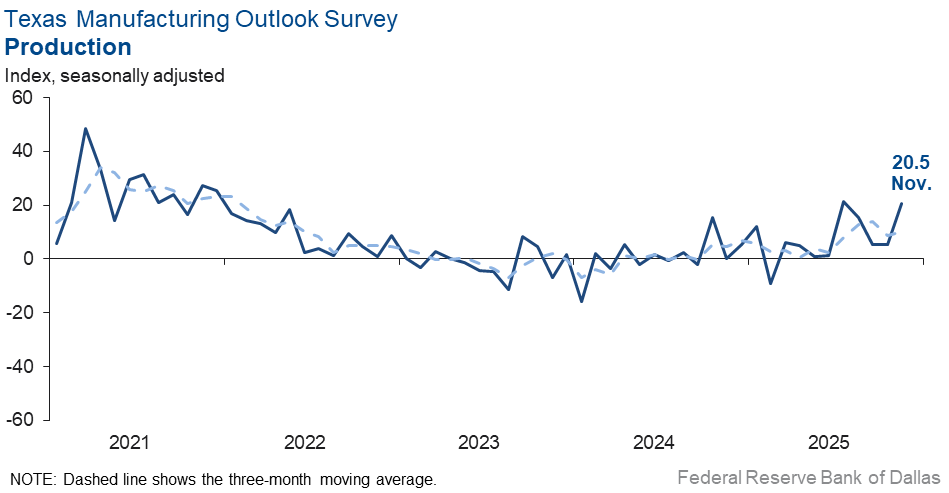
Texas factory activity expanded at a markedly faster pace in November, according to business executives responding to the Texas Manufacturing Outlook Survey. The production index, a key measure of state manufacturing conditions, rose 15 points to 20.5, indicating a notable pickup in output growth.
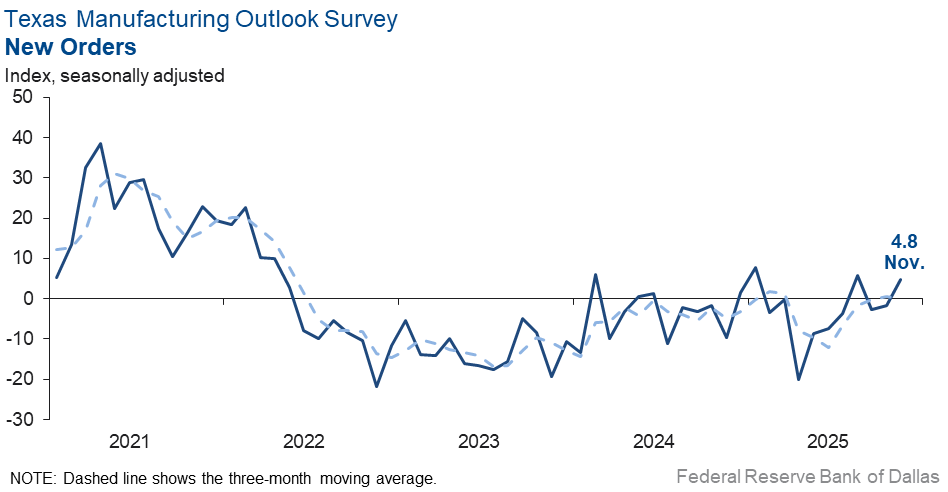
Other measures of manufacturing activity also pointed to faster growth this month. The new orders index increased to 4.8 from -1.7. The capacity utilization index jumped 21 points to 19.4, and the shipments index increased nine points to 15.1.
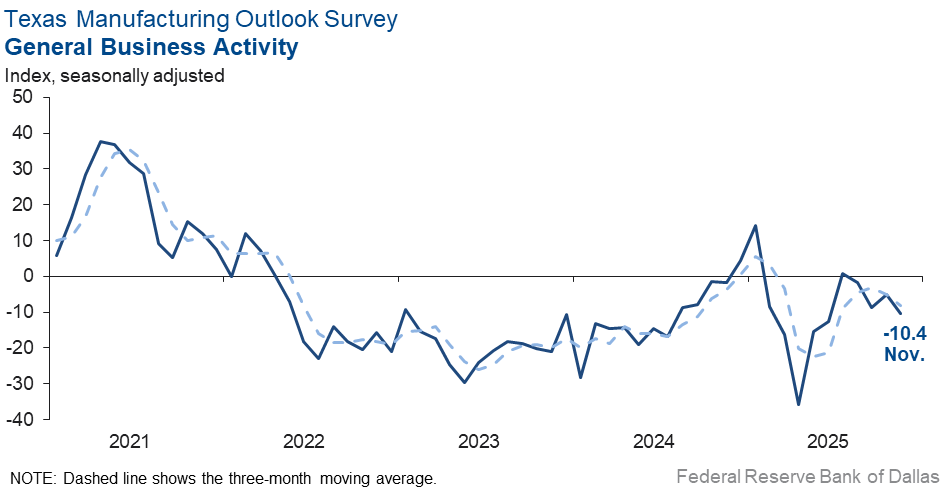
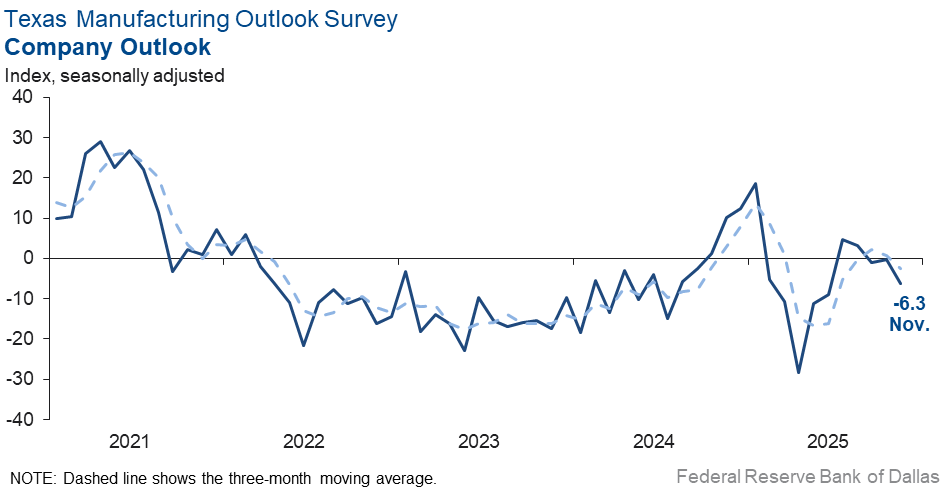
However, perceptions of broader business conditions worsened this month. The general business activity index fell further into negative territory to -10.4 from -5.0. Outlooks also worsened, with the company outlook index falling six points to -6.3 in November. Uncertainty regarding outlooks continued to rise, though the pace slowed—the index fell seven points to 15.7, in line with its series average.
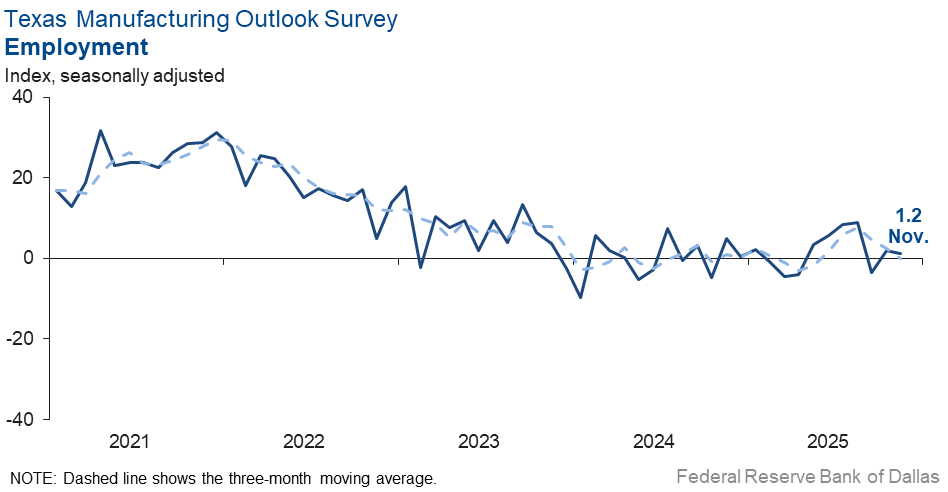
Labor market measures suggested flat head counts but an increase in work hours in November. The employment index was basically unchanged at 1.2, with the near-zero reading indicative of no change. Seventeen percent of firms noted net hiring, while 16 percent noted net layoffs. The hours worked index increased 15 points to 9.9, suggesting longer workweeks this month.
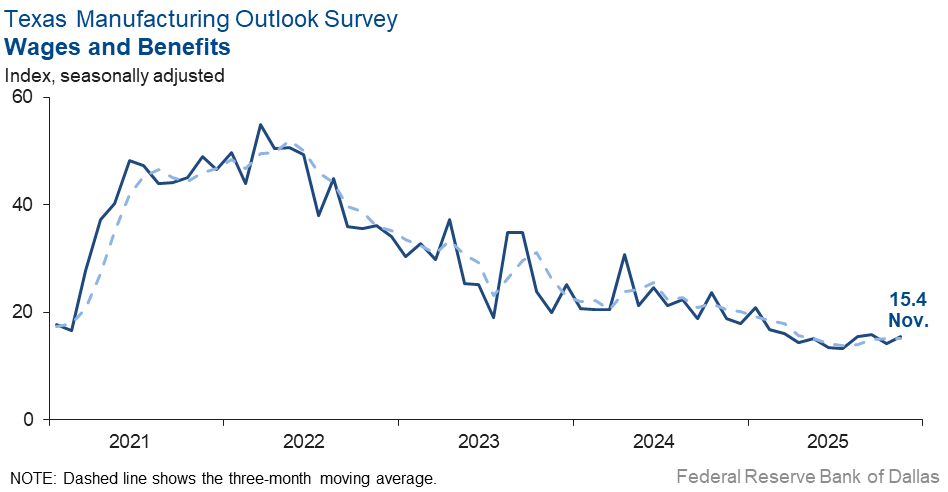
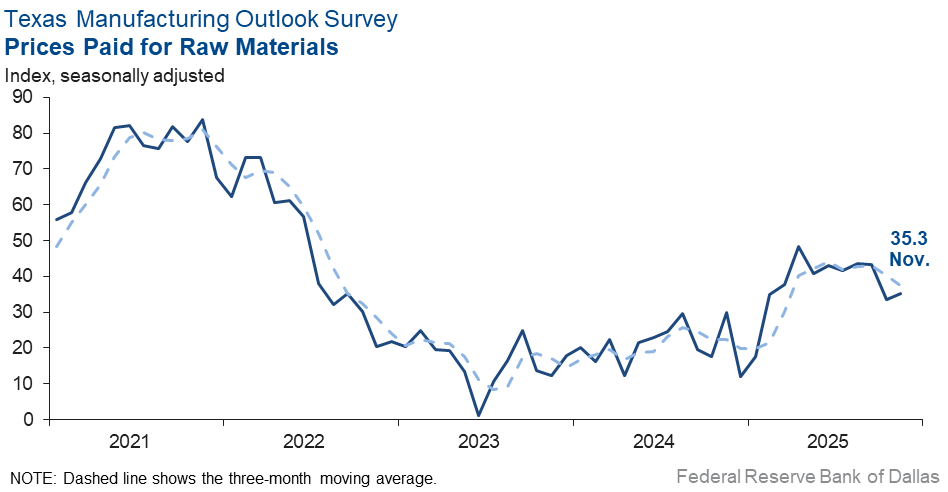
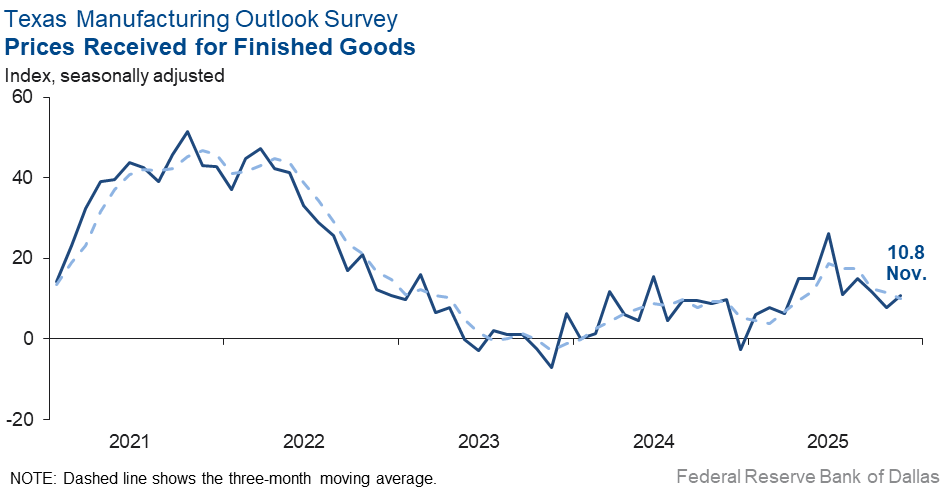
Price pressures increased slightly, while wage growth was stable. The raw materials prices index increased two points to 35.3. The finished goods prices index edged up to 10.8 from 7.7. The wages and benefits index was largely unchanged at 15.4, below its average reading.
Expectations for manufacturing activity six months from now remained positive. The future production index increased notably, to 33.7 from 21.0, while the future general business activity index edged up to 11. Most other indexes of future manufacturing activity also moved further into positive territory, indicating increased activity six months ahead.
Next release: Monday, December 29
Data were collected Nov. 10–18, and 70 of the 115 Texas manufacturers surveyed submitted responses. The Dallas Fed conducts the Texas Manufacturing Outlook Survey monthly to obtain a timely assessment of the state’s factory activity. Firms are asked whether output, employment, orders, prices and other indicators increased, decreased or remained unchanged over the previous month.
Survey responses are used to calculate an index for each indicator. Each index is calculated by subtracting the percentage of respondents reporting a decrease from the percentage reporting an increase. When the share of firms reporting an increase exceeds the share reporting a decrease, the index will be greater than zero, suggesting the indicator has increased over the prior month. If the share of firms reporting a decrease exceeds the share reporting an increase, the index will be below zero, suggesting the indicator has decreased over the prior month. An index will be zero when the number of firms reporting an increase is equal to the number of firms reporting a decrease. Data have been seasonally adjusted as necessary.
Results summary
Historical data are available from June 2004 to the most current release month.
| Business Indicators Relating to Facilities and Products in Texas Current (versus previous month) | ||||||||
| Indicator | Nov Index | Oct Index | Change | Series Average | Trend* | % Reporting Increase | % Reporting No Change | % Reporting Decrease |
Production | 20.5 | 5.2 | +15.3 | 9.6 | 9(+) | 38.4 | 43.6 | 17.9 |
Capacity Utilization | 19.4 | –1.1 | +20.5 | 7.5 | 1(+) | 35.5 | 48.4 | 16.1 |
New Orders | 4.8 | –1.7 | +6.5 | 4.7 | 1(+) | 28.4 | 48.1 | 23.6 |
Growth Rate of Orders | –1.3 | –3.7 | +2.4 | –1.1 | 3(–) | 23.2 | 52.3 | 24.5 |
Unfilled Orders | –6.6 | –6.4 | –0.2 | –2.6 | 15(–) | 12.1 | 69.2 | 18.7 |
Shipments | 15.1 | 5.8 | +9.3 | 7.9 | 5(+) | 35.9 | 43.3 | 20.8 |
Delivery Time | –8.4 | –7.2 | –1.2 | 0.5 | 3(–) | 6.4 | 78.8 | 14.8 |
Finished Goods Inventories | –14.3 | –11.0 | –3.3 | –3.3 | 3(–) | 11.4 | 62.9 | 25.7 |
Prices Paid for Raw Materials | 35.3 | 33.4 | +1.9 | 27.6 | 67(+) | 40.6 | 54.1 | 5.3 |
Prices Received for Finished Goods | 10.8 | 7.7 | +3.1 | 8.7 | 11(+) | 22.0 | 66.8 | 11.2 |
Wages and Benefits | 15.4 | 14.2 | +1.2 | 21.0 | 67(+) | 18.1 | 79.2 | 2.7 |
Employment | 1.2 | 2.0 | –0.8 | 7.2 | 2(+) | 17.1 | 67.0 | 15.9 |
Hours Worked | 9.9 | –5.5 | +15.4 | 3.0 | 1(+) | 21.0 | 67.9 | 11.1 |
Capital Expenditures | 9.8 | 4.8 | +5.0 | 6.6 | 7(+) | 20.6 | 68.6 | 10.8 |
| General Business Conditions Current (versus previous month) | ||||||||
| Indicator | Nov Index | Oct Index | Change | Series Average | Trend** | % Reporting Improved | % Reporting No Change | % Reporting Worsened |
Company Outlook | –6.3 | –0.3 | –6.0 | 4.2 | 3(–) | 19.5 | 54.7 | 25.8 |
General Business Activity | –10.4 | –5.0 | –5.4 | 0.3 | 4(–) | 18.9 | 51.8 | 29.3 |
| Indicator | Nov Index | Oct Index | Change | Series Average | Trend* | % Reporting Increase | % Reporting No Change | % Reporting Decrease |
Outlook Uncertainty | 15.7 | 22.2 | –6.5 | 17.2 | 55(+) | 30.0 | 55.7 | 14.3 |
| Business Indicators Relating to Facilities and Products in Texas Future (six months ahead) | ||||||||
| Indicator | Nov Index | Oct Index | Change | Series Average | Trend* | % Reporting Increase | % Reporting No Change | % Reporting Decrease |
Production | 33.7 | 21.0 | +12.7 | 36.1 | 67(+) | 48.7 | 36.4 | 15.0 |
Capacity Utilization | 34.0 | 17.5 | +16.5 | 32.9 | 67(+) | 46.5 | 41.0 | 12.5 |
New Orders | 39.2 | 18.3 | +20.9 | 33.5 | 37(+) | 49.6 | 40.0 | 10.4 |
Growth Rate of Orders | 27.8 | 8.2 | +19.6 | 24.8 | 30(+) | 37.5 | 52.8 | 9.7 |
Unfilled Orders | –0.5 | –8.9 | +8.4 | 2.7 | 3(–) | 12.4 | 74.7 | 12.9 |
Shipments | 27.0 | 18.5 | +8.5 | 34.4 | 67(+) | 42.2 | 42.5 | 15.2 |
Delivery Time | –4.1 | –1.4 | –2.7 | –1.4 | 9(–) | 13.2 | 69.5 | 17.3 |
Finished Goods Inventories | –1.5 | 3.1 | –4.6 | –0.3 | 1(–) | 18.2 | 62.1 | 19.7 |
Prices Paid for Raw Materials | 40.7 | 46.1 | –5.4 | 33.8 | 68(+) | 45.0 | 50.7 | 4.3 |
Prices Received for Finished Goods | 38.8 | 37.3 | +1.5 | 21.4 | 67(+) | 46.3 | 46.3 | 7.5 |
Wages and Benefits | 39.1 | 41.5 | –2.4 | 39.0 | 67(+) | 45.5 | 48.1 | 6.4 |
Employment | 22.3 | 18.9 | +3.4 | 22.7 | 66(+) | 33.8 | 54.7 | 11.5 |
Hours Worked | 5.7 | 7.2 | –1.5 | 8.6 | 5(+) | 14.8 | 76.1 | 9.1 |
Capital Expenditures | 12.9 | 26.8 | –13.9 | 19.4 | 66(+) | 24.6 | 63.7 | 11.7 |
| General Business Conditions Future (six months ahead) | ||||||||
| Indicator | Nov Index | Oct Index | Change | Series Average | Trend** | % Reporting Increase | % Reporting No Change | % Reporting Worsened |
Company Outlook | 16.2 | 7.1 | +9.1 | 18.2 | 7(+) | 28.3 | 59.6 | 12.1 |
General Business Activity | 11.0 | 7.0 | +4.0 | 12.3 | 7(+) | 26.7 | 57.6 | 15.7 |
*Shown is the number of consecutive months of expansion or contraction in the underlying indicator. Expansion is indicated by a positive index reading and denoted by a (+) in the table. Contraction is indicated by a negative index reading and denoted by a (–) in the table.
**Shown is the number of consecutive months of improvement or worsening in the underlying indicator. Improvement is indicated by a positive index reading and denoted by a (+) in the table. Worsening is indicated by a negative index reading and denoted by a (–) in the table.
Data have been seasonally adjusted as necessary.
Comments from survey respondents
Survey participants are given the opportunity to submit comments on current issues that may be affecting their businesses. Some comments have been edited for grammar and clarity.
- Concerns about the economy, the independence of the Fed and tariffs continue to cause uncertainty. We are not certain that [uncertainty] has actually increased as much as it has remained at an uncomfortably elevated level.
- We don't know if it's the shutdown or just that demand has dropped, but our orders have dropped in half.
- There is a continued weakness in the retail consumer market. Interest rates and inflation are certainly factors, but there is a general level of uncertainty in the consumer market that is tied to both political and economic uncertainty.
- Have not been able to initiate work due to a slowdown with our contractor and owner base. We now are hearing that work has been delayed until 2026.
- We are shifting volume to higher-priced products that reflect demand for our organic products. This is a consumer shift that we are seeing due to increased demand for minimally processed foods. This is a positive shift for our company.
- We’re currently facing challenging business conditions on several fronts, including rising raw material costs from national suppliers; supply disruptions and higher prices from international vendors; the loss of a few key distributors that have gone out of business; difficulties in collecting outstanding payments; increased labor costs; and a shortage of qualified candidates.
- Looking forward to a tax rebate for the month of government shutdown.
- November was our most profitable month this year. We are seeing increased business activity and many new projects.
- It seems even the modest decrease in interest rates has assuaged fears of inflation and provided comfort that we are indeed headed in the right direction. Tariff revenue has not dramatically impacted opportunity to grow in our industry, and it has seemingly improved our overall economy. We remain hopeful of continued progress through 2026.
- Tariff uncertainty is the largest impact on our purchasing strategy, along with a rise in employee benefits and costs.
- Currently steady at a low demand and production rate. If no uptick in business in the next 1-2 months, will need some further reduction in workforce to right-size operations.
- In addition to the double-invoicing issue we reported last month—still ongoing, with importers paying tariffs only on the raw material cost rather than the full value of the finished product—auto, truck and aircraft parts have now been temporarily excluded from Section 232 aluminum and steel tariffs. This has led to a surge in imported components and is contributing to job losses across U.S. aluminum manufacturing.
- Expecting 3 percent wage increases going into year 2026. New product line is bolstering business outlook.
- We continue to see soft incoming orders, with poor general activity in our industry. It's as if all the chaos in Washington is creating a lot of wait-and-see attitude among our customers' customers. We are very hopeful that things will improve in the next 6 months.
- Signs indicate business activity is improving, i.e. lowering of interest rate, improving economy and consumer confidence for major purchases.
- We are seeing commercial vehicle production continue to decline. Many of our original equipment manufacturer (OEM) customers have open production slots in November and December.
- Business is as delicate today as it was under the previous administration. Small, established businesses have nowhere to turn for help when suddenly paying new tariffs. We purchase raw materials from [Asian nations] and manufacture in the U.S., only to see [those nations’] governments subsidize manufacturing.
Historical Data
Historical data can be downloaded dating back to June 2004.
Indexes
Download indexes for all indicators. For the definitions of all variables, see Data Definitions.
| Unadjusted |
| Seasonally adjusted |
All Data
Download indexes and components of the indexes (percentage of respondents reporting increase, decrease, or no change). For the definitions of all variables, see Data Definitions.
| Unadjusted |
| Seasonally adjusted |
Special questions
For this month’s survey, Texas business executives were asked supplemental questions on margins, demand, employment and productivity. Results below include responses from participants of all three surveys: Texas Manufacturing Outlook Survey, Texas Service Sector Outlook Survey and Texas Retail Outlook Survey. View individual survey results.
Questions regarding the Texas Business Outlook Surveys can be addressed to Jesus Cañas.
Sign up for our email alert to be automatically notified as soon as the latest Texas Manufacturing Outlook Survey is released on the web.