Texas Manufacturing Outlook Survey

November 27, 2017
Manufacturing Expansion Slows but Remains Solid
What's New This Month
For this month’s survey, Texas business executives were asked supplemental questions on employment expectations and the labor market. Results for these questions from the Texas Manufacturing Outlook Survey (TMOS), Texas Service Sector Outlook Survey (TSSOS) and Texas Retail Outlook Survey (TROS) have been released together. Read the Special Questions results.
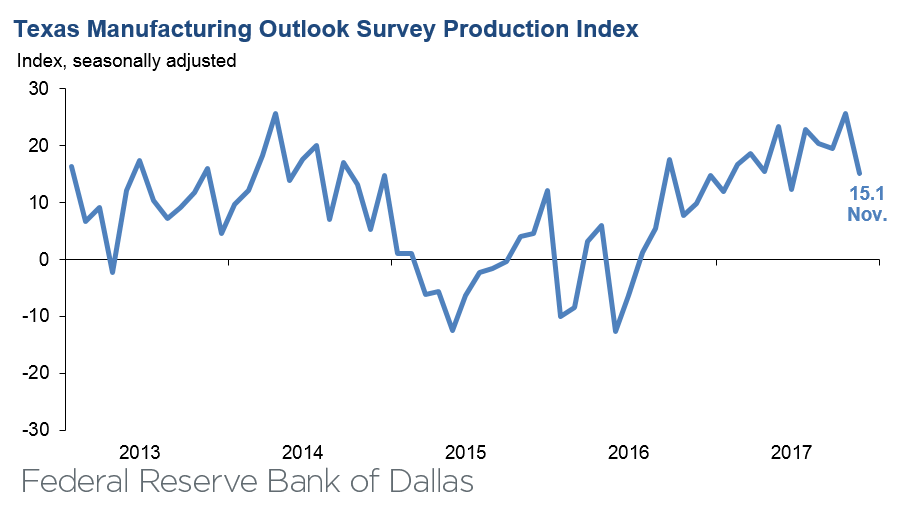
Texas factory activity continued to expand in November, according to business executives responding to the Texas Manufacturing Outlook Survey. The production index, a key measure of state manufacturing conditions, fell 10 points from its October reading but remained elevated at 15.1.
Other measures of manufacturing activity also pointed to November growth that was slightly slower than in October but still well above average. The new orders index moved down five points to 20.0, and the capacity utilization and shipments indexes similarly fell to 17.3 and 16.7, respectively. Meanwhile, the growth rate of orders index signaled a stronger pickup in demand, climbing six points to 18.1. This represents the index’s highest reading since 2010.
Perceptions of broader business conditions remained highly positive in November. The general business activity index came in at 19.4, down eight points from October. The company outlook index posted its 15th consecutive positive reading but dipped to 18.5.
Labor market measures suggested slower employment growth and longer workweeks this month. The employment index fell 10 points from October to 6.3, reflecting a more normal index level after several months of elevated readings. Nineteen percent of firms noted net hiring, compared with 13 percent noting net layoffs. The hours worked index edged down but remained positive at 11.5, indicating a continued lengthening of workweeks.
Upward pressure on prices and wages continued in November. The raw materials prices and finished goods prices indexes held steady at 32.2 and 15.1, respectively. The wages and benefits index moved down eight points to 14.2, slightly below the average reading for that index.
Expectations regarding future business conditions remained highly optimistic. The index of future general business activity held steady at 39.0, while the index of future company outlook edged up to 40.8. Other indexes for future manufacturing activity showed mixed movements but remained solidly in positive territory.Next release: Tuesday, December 26
|
Data were collected Nov. 13–21, and 101 Texas manufacturers responded to the survey. The Dallas Fed conducts the Texas Manufacturing Outlook Survey monthly to obtain a timely assessment of the state’s factory activity. Firms are asked whether output, employment, orders, prices and other indicators increased, decreased or remained unchanged over the previous month Survey responses are used to calculate an index for each indicator. Each index is calculated by subtracting the percentage of respondents reporting a decrease from the percentage reporting an increase. When the share of firms reporting an increase exceeds the share reporting a decrease, the index will be greater than zero, suggesting the indicator has increased over the prior month. If the share of firms reporting a decrease exceeds the share reporting an increase, the index will be below zero, suggesting the indicator has decreased over the prior month. An index will be zero when the number of firms reporting an increase is equal to the number of firms reporting a decrease. Data have been seasonally adjusted as necessary. |
November 27, 2017
Results Summary
Historical data are available from June 2004 to the most current release month.
| Business Indicators Relating to Facilities and Products in Texas Current (versus previous month) | ||||||||
| Indicator | Nov Index | Oct Index | Change | Indicator Direction* | Trend** (Months) | % Reporting Increase | % Reporting No Change | % Reporting Decrease |
Production | 15.1 | 25.6 | –10.5 | Increasing | 17 | 32.2 | 50.7 | 17.1 |
Capacity Utilization | 17.3 | 22.5 | –5.2 | Increasing | 17 | 29.4 | 58.5 | 12.1 |
New Orders | 20.0 | 24.8 | –4.8 | Increasing | 13 | 36.5 | 47.0 | 16.5 |
Growth Rate of Orders | 18.1 | 12.3 | +5.8 | Increasing | 11 | 30.3 | 57.5 | 12.2 |
Unfilled Orders | 11.4 | 10.4 | +1.0 | Increasing | 11 | 21.3 | 68.8 | 9.9 |
Shipments | 16.7 | 20.9 | –4.2 | Increasing | 12 | 35.0 | 46.8 | 18.3 |
Delivery Time | 4.8 | 3.0 | +1.8 | Increasing | 5 | 15.4 | 74.0 | 10.6 |
Materials Inventories | 6.8 | 10.6 | –3.8 | Increasing | 5 | 23.1 | 60.6 | 16.3 |
Finished Goods Inventories | 0.0 | 9.9 | –9.9 | Unchanged | 1 | 18.8 | 62.4 | 18.8 |
Prices Paid for Raw Materials | 32.2 | 32.3 | –0.1 | Increasing | 21 | 34.8 | 62.6 | 2.6 |
Prices Received for Finished Goods | 15.1 | 15.3 | –0.2 | Increasing | 16 | 21.8 | 71.5 | 6.7 |
Wages and Benefits | 14.2 | 22.5 | –8.3 | Increasing | 96 | 18.1 | 78.0 | 3.9 |
Employment | 6.3 | 16.7 | –10.4 | Increasing | 11 | 19.3 | 67.7 | 13.0 |
Hours Worked | 11.5 | 13.7 | –2.2 | Increasing | 13 | 22.8 | 65.9 | 11.3 |
Capital Expenditures | 15.8 | 13.3 | +2.5 | Increasing | 15 | 22.1 | 71.6 | 6.3 |
| General Business Conditions Current (versus previous month) | ||||||||
| Indicator | Nov Index | Oct Index | Change | Indicator Direction* | Trend** (Months) | % Reporting Improved | % Reporting No Change | % Reporting Worsened |
Company Outlook | 18.5 | 25.8 | –7.3 | Improving | 15 | 28.8 | 60.9 | 10.3 |
General Business Activity | 19.4 | 27.6 | –8.2 | Improving | 14 | 28.3 | 62.8 | 8.9 |
| Business Indicators Relating to Facilities and Products in Texas Future (six months ahead) | ||||||||
| Indicator | Nov Index | Oct Index | Change | Indicator Direction* | Trend** (Months) | % Reporting Increase | % Reporting No Change | % Reporting Decrease |
Production | 46.1 | 46.0 | +0.1 | Increasing | 105 | 51.7 | 42.7 | 5.6 |
Capacity Utilization | 45.4 | 47.2 | –1.8 | Increasing | 105 | 49.4 | 46.6 | 4.0 |
New Orders | 48.9 | 45.3 | +3.6 | Increasing | 105 | 53.2 | 42.5 | 4.3 |
Growth Rate of Orders | 40.9 | 36.7 | +4.2 | Increasing | 105 | 43.9 | 53.1 | 3.0 |
Unfilled Orders | 14.2 | 10.1 | +4.1 | Increasing | 26 | 21.7 | 70.8 | 7.5 |
Shipments | 43.2 | 50.8 | –7.6 | Increasing | 105 | 49.1 | 45.0 | 5.9 |
Delivery Time | 3.8 | 0.5 | +3.3 | Increasing | 12 | 14.5 | 74.8 | 10.7 |
Materials Inventories | 13.2 | 3.7 | +9.5 | Increasing | 12 | 24.0 | 65.2 | 10.8 |
Finished Goods Inventories | 6.2 | –0.9 | +7.1 | Increasing | 1 | 20.6 | 64.9 | 14.4 |
Prices Paid for Raw Materials | 48.4 | 36.5 | +11.9 | Increasing | 104 | 51.5 | 45.4 | 3.1 |
Prices Received for Finished Goods | 35.8 | 18.9 | +16.9 | Increasing | 22 | 43.2 | 49.5 | 7.4 |
Wages and Benefits | 46.6 | 36.9 | +9.7 | Increasing | 162 | 49.0 | 48.6 | 2.4 |
Employment | 29.8 | 34.2 | –4.4 | Increasing | 60 | 40.5 | 48.8 | 10.7 |
Hours Worked | 22.1 | 13.8 | +8.3 | Increasing | 18 | 27.0 | 68.1 | 4.9 |
Capital Expenditures | 34.1 | 30.2 | +3.9 | Increasing | 96 | 41.5 | 51.1 | 7.4 |
| General Business Conditions Future (six months ahead) | ||||||||
| Indicator | Nov Index | Oct Index | Change | Indicator Direction* | Trend** (Months) | % Reporting Increase | % Reporting No Change | % Reporting Worsened |
Company Outlook | 40.8 | 39.0 | +1.8 | Improving | 22 | 46.1 | 48.6 | 5.3 |
General Business Activity | 39.0 | 38.5 | +0.5 | Improving | 18 | 41.5 | 56.0 | 2.5 |
*Indicator direction refers to this month’s index. If index is positive (negative), indicator is increasing (decreasing) or improving (worsening). If zero, indicator is unchanged.
**Number of months moving in current direction.
Data have been seasonally adjusted as necessary.
November 27, 2017
Production Index
November 27, 2017
Comments from Survey Respondents
These comments are from respondents' completed surveys and have been edited for publication.
Primary Metal Manufacturing
- We have unusually high order bookings for this time of the year.
Fabricated Metal Product Manufacturing
- We are feeling slightly optimistic with the recent increase in the price of crude but will need to see what the refiners’ budget for maintenance work for 2018 will be.
- The end of year has slipped as far as orders for goods. We are trying a new sales approach for increase in another profit area.
- The global economies and U.S. economy are very weak and uncertain.
- We have just completed our restoration efforts in our plant and should see full production efficiencies in November. We have our highest backlog of orders in over nine months.
Machinery Manufacturing
- We have seen a 60 percent decrease in booked orders from September to October. We are anticipating the same for November.
Computer and Electronic Product Manufacturing
- General activity continues to strengthen broadly.
Printing and Related Support Activities
- October was a busy month, and while we are busy now, we don’t have as many temporary workers. We continue to be very concerned with low activity levels in our industry, and a competitor in New York that looked a lot like us is closing this month and auctioning off its equipment.
Apparel Manufacturing
- Military apparel orders have increased exponentially.
Food Manufacturing
- Lack of available labor continues to be the biggest impediment to growth. We simply cannot find manufacturing labor or technical skilled employees.
- On capacity utilization, there is a shortage of labor in the area of our Mexico operation, so we are transferring more work to China and also doing some more (minor) work here in Texas.
Miscellaneous Manufacturing
- We really need tax reforms based on President Trump’s plan. The Republicans and Democrats don't understand how uncompetitive the U.S. tax structure is compared to the international.
- The Christmas rush in our business is over.
Historical Data
Historical data can be downloaded dating back to June 2004.
Indexes
Download indexes for all indicators. For the definitions of all variables, see Data Definitions.
| Unadjusted |
| Seasonally adjusted |
All Data
Download indexes and components of the indexes (percentage of respondents reporting increase, decrease, or no change). For the definitions of all variables, see Data Definitions.
| Unadjusted |
| Seasonally adjusted |
Questions regarding the Texas Manufacturing Outlook Survey can be addressed to Emily Kerr at emily.kerr@dal.frb.org.
Sign up for our e-mail alert to be automatically notified as soon as the latest Texas Manufacturing Outlook Survey is released on the web.