Texas Manufacturing Outlook Survey

Texas manufacturing activity dips
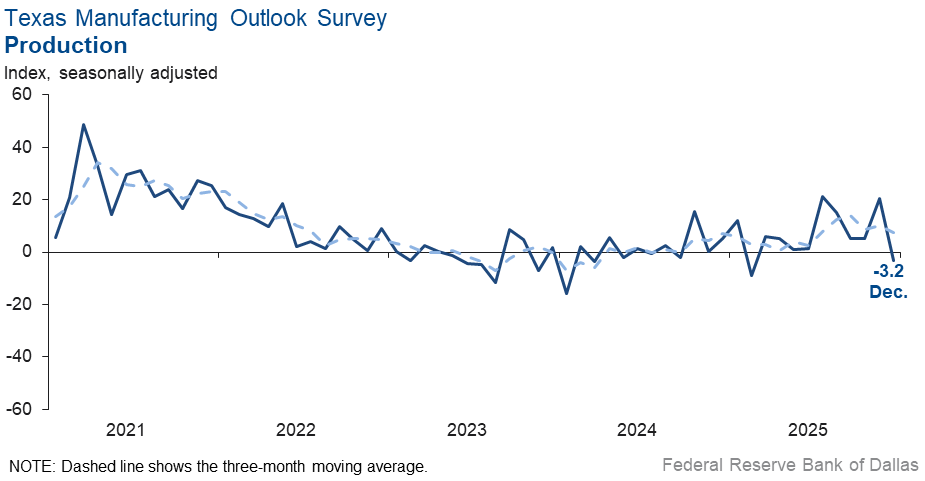
Texas factory activity contracted slightly in December after rising notably in November, according to business executives responding to the Texas Manufacturing Outlook Survey. The production index, a key measure of state manufacturing conditions, fell 24 points to -3.2, indicating a slight decline in output.
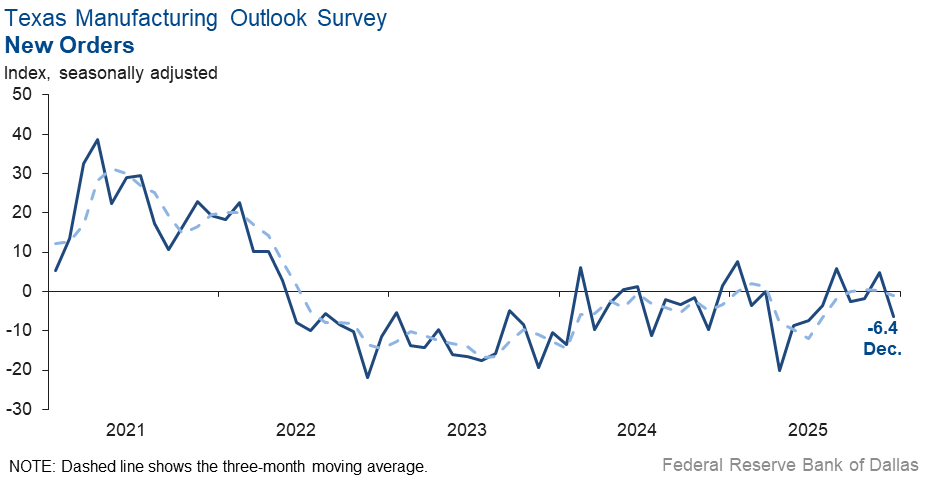
Other measures of manufacturing activity also declined this month. The new orders index fell 11 points to -6.4, and the capacity utilization index plunged 24 points to -4.5. The shipments index fell to -10.6, its lowest reading in 17 months.
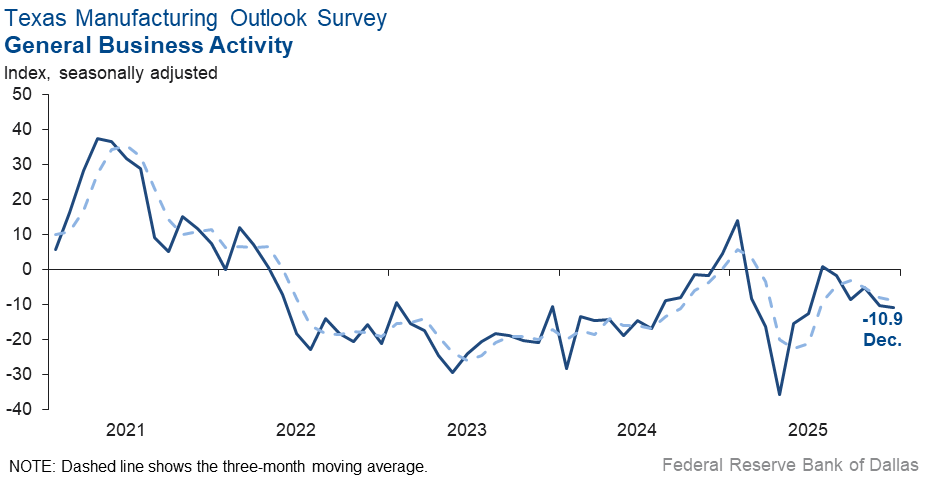
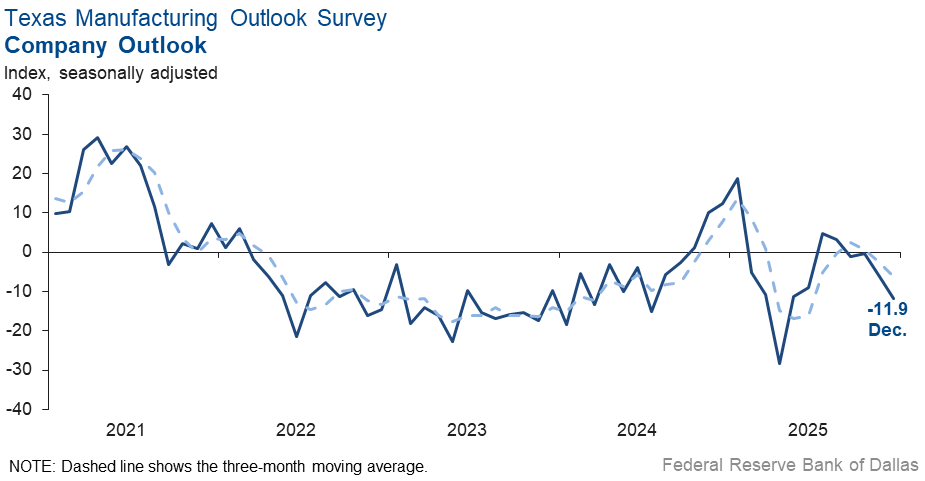
Perceptions of broader business conditions worsened in December. The general business activity index remained negative at -10.9, and the outlook index fell further into negative territory to -11.9. The outlook uncertainty index fell 16 points to zero, as an equal share of respondents noted rising and declining uncertainty in outlooks.
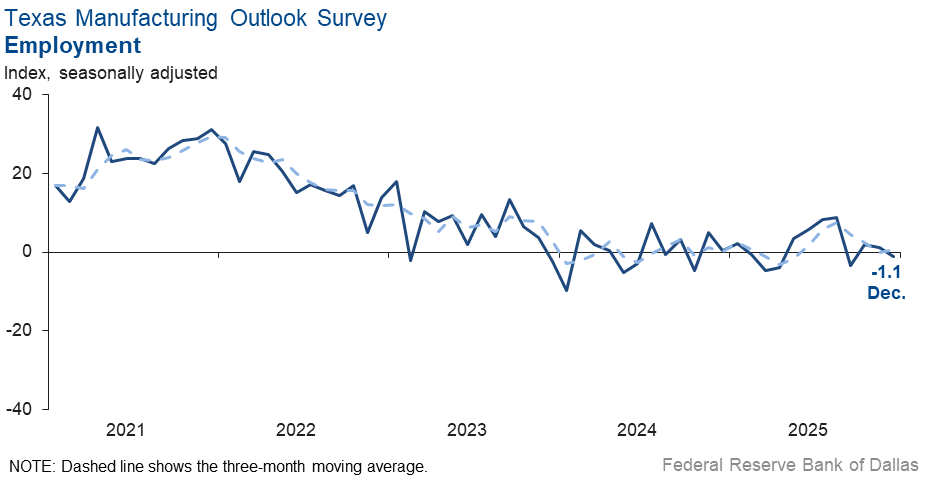
Labor market measures suggested flat head counts and a decline in work hours in December. The employment index dipped to -1.1, with the near-zero reading indicating no change. Twelve percent of firms noted net hiring, while 13 percent noted net layoffs. The hours worked index dropped 17 points to -7.5, suggesting shorter workweeks this month.
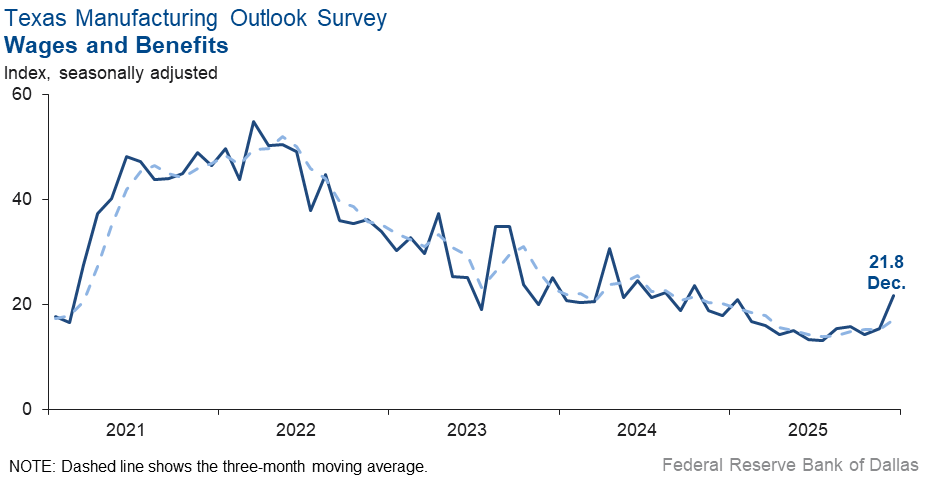
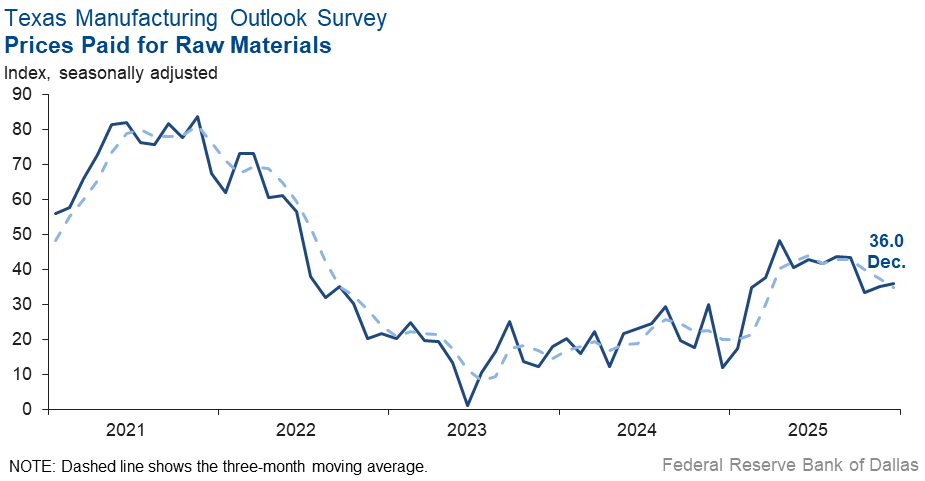
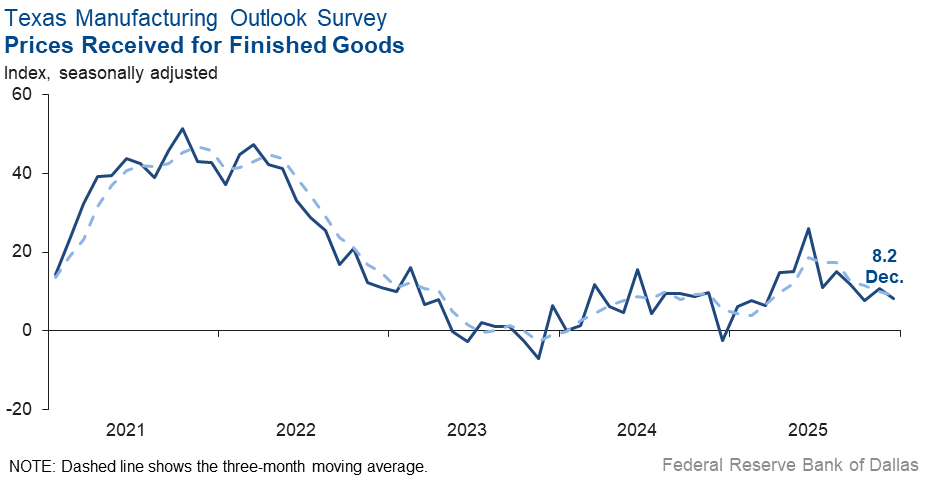
Price pressures were little changed, while wage growth increased. The raw materials prices index was largely unchanged at 36.0. The finished goods prices index edged down three points to 8.2, a reading in line with its series average of 8.7. The wages and benefits index rose six points to 21.8, in line with its series average of 21.0.
Expectations are for increased manufacturing activity six months from now. The future production index was largely unchanged at 34.2, and the future general business activity index held steady at 10.8. Other indexes of future manufacturing activity showed mixed movements but remained in positive territory, indicating increased activity six months ahead.
Next release: Monday, January 26
Data were collected Dec. 15–23, and 74 of the 115 Texas manufacturers surveyed submitted responses. The Dallas Fed conducts the Texas Manufacturing Outlook Survey monthly to obtain a timely assessment of the state’s factory activity. Firms are asked whether output, employment, orders, prices and other indicators increased, decreased or remained unchanged over the previous month.
Survey responses are used to calculate an index for each indicator. Each index is calculated by subtracting the percentage of respondents reporting a decrease from the percentage reporting an increase. When the share of firms reporting an increase exceeds the share reporting a decrease, the index will be greater than zero, suggesting the indicator has increased over the prior month. If the share of firms reporting a decrease exceeds the share reporting an increase, the index will be below zero, suggesting the indicator has decreased over the prior month. An index will be zero when the number of firms reporting an increase is equal to the number of firms reporting a decrease. Data have been seasonally adjusted as necessary.
Results summary
Historical data are available from June 2004 to the most current release month.
| Business Indicators Relating to Facilities and Products in Texas Current (versus previous month) | ||||||||
| Indicator | Dec Index | Nov Index | Change | Series Average | Trend* | % Reporting Increase | % Reporting No Change | % Reporting Decrease |
Production | –3.2 | 20.5 | –23.7 | 9.6 | 1(–) | 17.2 | 62.4 | 20.4 |
Capacity Utilization | –4.5 | 19.4 | –23.9 | 7.4 | 1(–) | 16.9 | 61.7 | 21.4 |
New Orders | –6.4 | 4.8 | –11.2 | 4.6 | 1(–) | 21.8 | 50.0 | 28.2 |
Growth Rate of Orders | –16.0 | –1.3 | –14.7 | –1.2 | 4(–) | 10.4 | 63.2 | 26.4 |
Unfilled Orders | –13.5 | –6.6 | –6.9 | –2.7 | 16(–) | 6.4 | 73.7 | 19.9 |
Shipments | –10.6 | 15.1 | –25.7 | 7.8 | 1(–) | 12.8 | 63.8 | 23.4 |
Delivery Time | 3.3 | –8.4 | 11.7 | 0.5 | 1(+) | 9.9 | 83.5 | 6.6 |
Finished Goods Inventories | –13.5 | –14.3 | 0.8 | –3.3 | 4(–) | 9.5 | 67.6 | 23.0 |
Prices Paid for Raw Materials | 36.0 | 35.3 | 0.7 | 27.6 | 68(+) | 39.4 | 57.2 | 3.4 |
Prices Received for Finished Goods | 8.2 | 10.8 | –2.6 | 8.7 | 12(+) | 13.1 | 82.0 | 4.9 |
Wages and Benefits | 21.8 | 15.4 | 6.4 | 21.0 | 68(+) | 23.3 | 75.2 | 1.5 |
Employment | –1.1 | 1.2 | –2.3 | 7.1 | 1(–) | 12.3 | 74.3 | 13.4 |
Hours Worked | –7.5 | 9.9 | –17.4 | 3.0 | 1(–) | 8.6 | 75.3 | 16.1 |
Capital Expenditures | 8.1 | 9.8 | –1.7 | 6.6 | 8(+) | 18.3 | 71.6 | 10.2 |
| General Business Conditions Current (versus previous month) | ||||||||
| Indicator | Dec Index | Nov Index | Change | Series Average | Trend** | % Reporting Improved | % Reporting No Change | % Reporting Worsened |
Company Outlook | –11.9 | –6.3 | –5.6 | 4.1 | 4(–) | 10.8 | 66.5 | 22.7 |
General Business Activity | –10.9 | –10.4 | –0.5 | 0.2 | 5(–) | 12.7 | 63.7 | 23.6 |
| Indicator | Dec Index | Nov Index | Change | Series Average | Trend* | % Reporting Increase | % Reporting No Change | % Reporting Decrease |
Outlook Uncertainty | 0.0 | 15.7 | –15.7 | 17.0 | 1() | 15.3 | 69.4 | 15.3 |
| Business Indicators Relating to Facilities and Products in Texas Future (six months ahead) | ||||||||
| Indicator | Dec Index | Nov Index | Change | Series Average | Trend* | % Reporting Increase | % Reporting No Change | % Reporting Decrease |
Production | 34.2 | 33.7 | +0.5 | 36.0 | 68(+) | 44.9 | 44.4 | 10.7 |
Capacity Utilization | 28.9 | 34.0 | –5.1 | 32.9 | 68(+) | 40.1 | 48.7 | 11.2 |
New Orders | 30.5 | 39.2 | –8.7 | 33.5 | 38(+) | 44.9 | 40.7 | 14.4 |
Growth Rate of Orders | 24.9 | 27.8 | –2.9 | 24.8 | 31(+) | 40.4 | 44.2 | 15.5 |
Unfilled Orders | 1.8 | –0.5 | +2.3 | 2.7 | 1(+) | 12.4 | 77.0 | 10.6 |
Shipments | 33.9 | 27.0 | +6.9 | 34.4 | 68(+) | 45.6 | 42.7 | 11.7 |
Delivery Time | 5.4 | –4.1 | +9.5 | –1.4 | 1(+) | 13.8 | 77.8 | 8.4 |
Finished Goods Inventories | 4.2 | –1.5 | +5.7 | –0.3 | 1(+) | 19.7 | 64.8 | 15.5 |
Prices Paid for Raw Materials | 34.9 | 40.7 | –5.8 | 33.8 | 69(+) | 40.8 | 53.3 | 5.9 |
Prices Received for Finished Goods | 31.9 | 38.8 | –6.9 | 21.5 | 68(+) | 36.2 | 59.4 | 4.3 |
Wages and Benefits | 42.5 | 39.1 | +3.4 | 39.0 | 68(+) | 44.1 | 54.3 | 1.6 |
Employment | 20.9 | 22.3 | –1.4 | 22.7 | 67(+) | 30.7 | 59.5 | 9.8 |
Hours Worked | 3.3 | 5.7 | –2.4 | 8.6 | 6(+) | 16.2 | 70.9 | 12.9 |
Capital Expenditures | 17.7 | 12.9 | +4.8 | 19.4 | 67(+) | 26.5 | 64.7 | 8.8 |
| General Business Conditions Future (six months ahead) | ||||||||
| Indicator | Dec Index | Nov Index | Change | Series Average | Trend** | % Reporting Increase | % Reporting No Change | % Reporting Worsened |
Company Outlook | 16.5 | 16.2 | +0.3 | 18.2 | 8(+) | 32.9 | 50.7 | 16.4 |
General Business Activity | 10.8 | 11.0 | –0.2 | 12.3 | 8(+) | 27.5 | 55.8 | 16.7 |
*Shown is the number of consecutive months of expansion or contraction in the underlying indicator. Expansion is indicated by a positive index reading and denoted by a (+) in the table. Contraction is indicated by a negative index reading and denoted by a (–) in the table.
**Shown is the number of consecutive months of improvement or worsening in the underlying indicator. Improvement is indicated by a positive index reading and denoted by a (+) in the table. Worsening is indicated by a negative index reading and denoted by a (–) in the table.
Data have been seasonally adjusted as necessary.
Comments from survey respondents
Survey participants are given the opportunity to submit comments on current issues that may be affecting their businesses. Some comments have been edited for grammar and clarity.
- We need interest rates to go down further.
- Customers are deferring or canceling projects.
- We are caught in the inertia of government policy with regard to agriculture and U.S. Department of Agriculture food purchasing as well as the overall political climate.
- This past quarter we have experienced 20 percent growth over last year and are just trying to adjust.
- Hope has arrived. We have big expectations for 2026, and with interest rates down and markets steady, we’re actually [experiencing] increasing gross revenue and improving margins for the first time in a very long time. May it continue for a while.
- The holidays have slowed down business; however, we are anticipating that the new year will start off strong.
- Business activity has increased sharply, and we are adding more production capacity. We are buying a new machine that will automate our production without any new employees. This machine will be able to run automatically for 15 or more hours a day without any personnel once it’s loaded. This will allow us to refill our inventory that has all but disappeared over the past 12 months as well as increase our sales to new customers. We may add more capex projects as our business continues to expand with improved sales.
- Tariffs [remain a concern]. I feel like a broken record.
- Trying to go into the new year with a positive outlook. January will tell.
- [Some] customers continue to lose large amounts of market share to imports from Mexico, Central and South America and Asia due to tariff inversion and USMCA [U.S.-Mexico-Canada Agreement] exemptions caused by the design of the aluminum 232 [Section 232 Tariffs on Steel and Aluminum] action. The current approach is causing domestic fabricators to pay substantially more without providing us any commensurate relief.
- We have gotten stupid slow, with incoming orders at an all-time low for the first few weeks of December. We are used to it occasionally being slow this time of year, but never like this. We will be shutting down the plant floor for multiple days due to lack of work. We have to believe this is a direct effect from the total lack of predictability coming from Washington and the ill-conceived idea of tariffs benefiting our economy. Things need to turn around, and fast, or else we will be looking at some significant layoffs.
- The latest forecast for the trucking industry remains very weak and is now expected to continue until third quarter 2026. We are taking additional cost reductions with reduced work weeks and reductions and delays in merit increases and holding off filling [open] positions.
Historical Data
Historical data can be downloaded dating back to June 2004.
Indexes
Download indexes for all indicators. For the definitions of all variables, see Data Definitions.
| Unadjusted |
| Seasonally adjusted |
All Data
Download indexes and components of the indexes (percentage of respondents reporting increase, decrease, or no change). For the definitions of all variables, see Data Definitions.
| Unadjusted |
| Seasonally adjusted |
Special questions
For this month’s survey, Texas business executives were asked supplemental questions on wages, prices, outlook concerns and artificial intelligence. Results below include responses from participants of all three surveys: Texas Manufacturing Outlook Survey, Texas Service Sector Outlook Survey and Texas Retail Outlook Survey. View individual survey results.
Questions regarding the Texas Business Outlook Surveys can be addressed to Jesus Cañas.
Sign up for our email alert to be automatically notified as soon as the latest Texas Manufacturing Outlook Survey is released on the web.