Texas Manufacturing Outlook Survey

May 28, 2019
Texas Manufacturing Expansion Continues but Pace Slows
What’s New This Month
For this month’s survey, Texas business executives were asked supplemental questions on the labor market, wages and prices. Results for these questions from the Texas Manufacturing Outlook Survey, Texas Service Sector Outlook Survey and Texas Retail Outlook Survey have been released together. Read the Special Questions results.
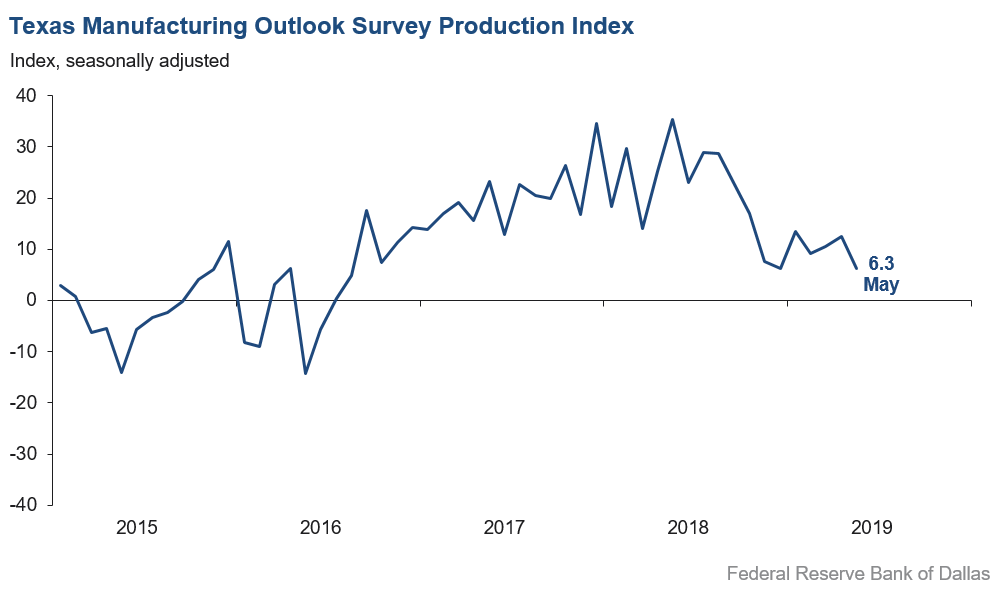
Texas factory activity continued to expand in May, albeit at a slower pace, according to business executives responding to the Texas Manufacturing Outlook Survey. The production index, a key measure of state manufacturing conditions, fell six points to 6.3, indicating output growth decelerated from April.
Most other measures of manufacturing activity also suggested slower expansion in May. The survey’s demand indicators fell but remained positive: The new orders index slipped seven points to 2.4, and the growth rate of orders index moved down from 5.2 to 1.1. The capacity utilization index fell to 7.7 from a seven-month high of 15.6 in April. Meanwhile, the shipments index edged up to 7.6.
Perceptions of broader business conditions exhibited some weakness in May. The general business activity index turned negative and reached a year-to-date low of -5.3. The company outlook index dipped into negative territory for the first time this year, coming in at -1.7. The index measuring uncertainty regarding companies’ outlooks jumped nine points to 16.1, its highest reading since last September. More than a quarter of firms said uncertainty increased this month.
Labor market measures suggested stronger employment growth and longer workweeks in May. The employment index rebounded from its April dip, rising seven points to 11.6. Twenty-one percent of firms noted net hiring, while 9 percent noted net layoffs. The hours worked index remained positive but inched down to 6.4.
Slight upward pressure on input costs continued in May, while pressure on selling prices abated. The raw materials prices index held steady at 7.4, a three-year low. Meanwhile, the finished goods prices index retreated from 6.0 to 0.7, with the near-zero May reading suggesting virtually no growth in selling prices. The wages and benefits index remained elevated and largely unchanged at 27.6.
Expectations regarding future business conditions remained positive in May, although the indexes moved down from April readings. The index of future general business activity fell nine points to 9.1. Similarly, the index of future company outlook fell nine points to 11.5. Most other indexes of future manufacturing activity declined this month but stayed in positive territory.
Next release: Monday, June 24
|
Data were collected May 14–22, and 114 Texas manufacturers responded to the survey. The Dallas Fed conducts the Texas Manufacturing Outlook Survey monthly to obtain a timely assessment of the state’s factory activity. Firms are asked whether output, employment, orders, prices and other indicators increased, decreased or remained unchanged over the previous month Survey responses are used to calculate an index for each indicator. Each index is calculated by subtracting the percentage of respondents reporting a decrease from the percentage reporting an increase. When the share of firms reporting an increase exceeds the share reporting a decrease, the index will be greater than zero, suggesting the indicator has increased over the prior month. If the share of firms reporting a decrease exceeds the share reporting an increase, the index will be below zero, suggesting the indicator has decreased over the prior month. An index will be zero when the number of firms reporting an increase is equal to the number of firms reporting a decrease. Data have been seasonally adjusted as necessary. |
May 28, 2019
Results Summary
Historical data are available from June 2004 to the most current release month.
| Business Indicators Relating to Facilities and Products in Texas Current (versus previous month) |
||||||||
| Indicator | May Index | Apr Index | Change | Indicator Direction* | Trend** (Months) | % Reporting Increase | % Reporting No Change |
% Reporting Decrease |
|
Production |
6.3 |
12.4 |
–6.1 |
Increasing |
35 |
22.8 |
60.7 |
16.5 |
|
Capacity Utilization |
7.7 |
15.6 |
–7.9 |
Increasing |
35 |
22.0 |
63.6 |
14.3 |
|
New Orders |
2.4 |
9.8 |
–7.4 |
Increasing |
31 |
23.6 |
55.2 |
21.2 |
|
Growth Rate of Orders |
1.1 |
5.2 |
–4.1 |
Increasing |
2 |
19.6 |
61.9 |
18.5 |
|
Unfilled Orders |
–1.6 |
–0.4 |
–1.2 |
Decreasing |
6 |
16.3 |
65.8 |
17.9 |
|
Shipments |
7.6 |
6.3 |
+1.3 |
Increasing |
30 |
25.2 |
57.2 |
17.6 |
|
Delivery Time |
6.5 |
1.6 |
+4.9 |
Increasing |
3 |
14.4 |
77.7 |
7.9 |
|
Finished Goods Inventories |
–6.2 |
–5.7 |
–0.5 |
Decreasing |
2 |
15.9 |
61.9 |
22.1 |
|
Prices Paid for Raw Materials |
7.4 |
7.9 |
–0.5 |
Increasing |
38 |
16.9 |
73.6 |
9.5 |
|
Prices Received for Finished Goods |
0.7 |
6.0 |
–5.3 |
Increasing |
34 |
13.2 |
74.3 |
12.5 |
|
Wages and Benefits |
27.6 |
28.2 |
–0.6 |
Increasing |
118 |
29.3 |
69.0 |
1.7 |
|
Employment |
11.6 |
4.6 |
+7.0 |
Increasing |
29 |
20.9 |
69.8 |
9.3 |
|
Hours Worked |
6.4 |
8.1 |
–1.7 |
Increasing |
31 |
19.9 |
66.6 |
13.5 |
|
Capital Expenditures |
18.3 |
18.9 |
–0.6 |
Increasing |
33 |
24.8 |
68.7 |
6.5 |
| General Business Conditions Current (versus previous month) |
||||||||
| Indicator | May Index | Apr Index | Change | Indicator Direction* | Trend** (Months) | % Reporting Improved | % Reporting No Change |
% Reporting Worsened |
|
Company Outlook |
–1.7 |
6.3 |
–8.0 |
Worsening |
1 |
17.1 |
64.1 |
18.8 |
|
General Business Activity |
–5.3 |
2.0 |
–7.3 |
Worsening |
1 |
14.0 |
66.7 |
19.3 |
| Indicator | May Index | Apr Index | Change | Indicator Direction* | Trend** (Months) | % Reporting Increase | % Reporting No Change |
% Reporting Decrease |
|
Outlook Uncertainty† |
16.1 |
6.8 |
+9.3 |
Increasing |
12 |
27.7 |
60.7 |
11.6 |
| Business Indicators Relating to Facilities and Products in Texas Future (six months ahead) |
||||||||
| Indicator | May Index | Apr Index | Change | Indicator Direction | Trend* (Months) | % Reporting Increase | % Reporting No Change |
% Reporting Decrease |
|
Production |
36.5 |
41.3 |
–4.8 |
Increasing |
123 |
48.4 |
39.6 |
11.9 |
|
Capacity Utilization |
34.8 |
40.6 |
–5.8 |
Increasing |
123 |
44.3 |
46.2 |
9.5 |
|
New Orders |
35.2 |
35.9 |
–0.7 |
Increasing |
123 |
47.0 |
41.2 |
11.8 |
|
Growth Rate of Orders |
25.3 |
27.5 |
–2.2 |
Increasing |
123 |
36.4 |
52.5 |
11.1 |
|
Unfilled Orders |
2.0 |
10.0 |
–8.0 |
Increasing |
44 |
14.1 |
73.8 |
12.1 |
|
Shipments |
32.2 |
35.5 |
–3.3 |
Increasing |
123 |
46.6 |
38.9 |
14.4 |
|
Delivery Time |
1.2 |
1.8 |
–0.6 |
Increasing |
30 |
13.8 |
73.6 |
12.6 |
|
Finished Goods Inventories |
–11.5 |
–4.1 |
–7.4 |
Decreasing |
2 |
11.4 |
65.7 |
22.9 |
|
Prices Paid for Raw Materials |
28.9 |
14.0 |
+14.9 |
Increasing |
122 |
35.6 |
57.7 |
6.7 |
|
Prices Received for Finished Goods |
6.7 |
8.0 |
–1.3 |
Increasing |
40 |
20.0 |
66.7 |
13.3 |
|
Wages and Benefits |
32.8 |
38.8 |
–6.0 |
Increasing |
180 |
38.7 |
55.4 |
5.9 |
|
Employment |
28.9 |
33.4 |
–4.5 |
Increasing |
78 |
37.9 |
53.1 |
9.0 |
|
Hours Worked |
2.8 |
9.0 |
–6.2 |
Increasing |
36 |
12.7 |
77.4 |
9.9 |
|
Capital Expenditures |
22.8 |
26.2 |
–3.4 |
Increasing |
114 |
30.4 |
62.0 |
7.6 |
| General Business Conditions Future (six months ahead) |
||||||||
| Indicator | May Index | Apr Index | Change | Indicator Direction* | Trend** (Months) | % Reporting Increase | % Reporting No Change |
% Reporting Worsened |
|
Company Outlook |
11.5 |
20.9 |
–9.4 |
Improving |
40 |
27.8 |
55.9 |
16.3 |
|
General Business Activity |
9.1 |
18.4 |
–9.3 |
Improving |
36 |
23.6 |
62.0 |
14.5 |
*Indicator direction refers to this month's index. If index is positive (negative), indicator is increasing (decreasing) or improving (worsening). If zero, indicator is unchanged.
**Number of months moving in current direction.
†Added to survey in January 2019.
Data have been seasonally adjusted as necessary, with the exception of the outlook uncertainty index, which does not yet have a sufficiently long time series to test for seasonality.
May 28, 2019
Production Index
May 28, 2019
Comments from Survey Respondents
These comments are from respondents' completed surveys and have been edited for publication.
Chemical Manufacturing
- The decline in May figures versus April were a result of a fire at one of our largest customers' facilities, which delayed several of the projects on which we were working with them. Uncertainty has increased due to the tariff war.
Primary Metal Manufacturing
- The possible increases in tariffs related to China will negatively impact our agriculture customers and put further pressure on a segment that is already experiencing cyclical lows.
Fabricated Metal Product Manufacturing
- There is a definite slowing in steel fabrication.
- Competition from Mexico from non-tariffed steel fabricators is very troublesome and we are losing market share.
- We are at maximum capacity and turning away business.
Nonmetallic Mineral Product Manufacturing
- There are many unknowns due to tariffs.
- Extensive rains have delayed shipments over the last three months to customers in the Dallas-Fort Worth area. This is causing a backup of finished goods inventory at our plant.
Machinery Manufacturing
- There has been a sharp decline in orders, and pricing has taken a huge dive as well. Competition has pushed pricing to near-guaranteed losses.
- With all the tariff fees pouring into the U.S. Treasury, when should we expect a tax break?
- We are seeing steady business that should begin to grow again if a China trade deal is reached.
- Our business is improving consistently even though we have increased some prices. Fortune 500 companies are looking for stable small companies to depend on for consistent support and service. And that is what we have focused on over the past two years to fortify our business growth. Now we need to find and develop new middle-tier employees to fill positions to support our customers. This is the toughest problem we have ever faced.
- China tariffs were already causing significant price increases, and the latest escalations will raise our costs even more—probably our prices, too—and make us less competitive on the world stage where we export 70 percent of what we produce.
Computer and Electronic Product Manufacturing
- Trade talks with China could have a longer-term impact but have no impact at this point.
- Growth is robust and would be even stronger without current supply chain and labor constraints, but we aren’t complaining.
- With our government’s intention to resolve issues with Iran and China and also introducing the “Deal of the Century,” it adds warranted risk to our future business that we can’t ignore.
- There is significant uncertainty.
Electrical Equipment, Appliance and Component Manufacturing
- We make electric wire for the construction and remodeling industry. We probably lag the economy because big construction projects take to time to imagine, design, permit, finance, bid out, etc., before the first shovel breaks ground. Then it can take a year or two more to build it. We see very strong demand in the field right now. Contractors say they are booked a year out. Somebody mistakenly told people to all go to college 40 years ago, and now we are desperately short of tradesmen.
Printing and Related Support Activities
- We continue to be much slower than normal, which is very frustrating. Now we have uncertainties around tariff battles looming, which does not bode well for our business. Capital spending is up only because we found a good deal on a piece of equipment that allows us to add to our capabilities at a cheap price, so we bought it at an auction for pennies of what it sold for new. We are now 30 days in on a price increase—we will see if it can hold. With costs all around us increasing, we have no choice but to raise prices.
Textile Product Mills
- We are finding larger orders, and larger customers require us to outsource to others in the Dallas–Fort Worth area to help us keep up. The outsourcing model is the key to our exponential growth.
Apparel Manufacturing
- Government spending, specifically Department of Defense, continues to be strong in the near term and foreseeable future.
Paper Manufacturing
- Slowness continues.
Transportation Equipment Manufacturing
- We are changing our business model to increase volume, with pricing based on wholesale margins versus retail margins. This change is to be phased in over six months.
- Our primary customer is the U.S. government. We continue to be concerned regarding the volatility of the decision-making processes at the higher levels.
Miscellaneous Manufacturing
- The additional import tariffs really hurt our business, but we fully support getting a fair trade deal with China.
Historical Data
Historical data can be downloaded dating back to June 2004.
Indexes
Download indexes for all indicators. For the definitions of all variables, see Data Definitions.
| Unadjusted |
| Seasonally adjusted |
All Data
Download indexes and components of the indexes (percentage of respondents reporting increase, decrease, or no change). For the definitions of all variables, see Data Definitions.
| Unadjusted |
| Seasonally adjusted |
Questions regarding the Texas Manufacturing Outlook Survey can be addressed to Emily Kerr at emily.kerr@dal.frb.org.
Sign up for our email alert to be automatically notified as soon as the latest Texas Manufacturing Outlook Survey is released on the web.