Texas Manufacturing Outlook Survey

January 27, 2020
Growth in Texas Manufacturing Activity Picks Up
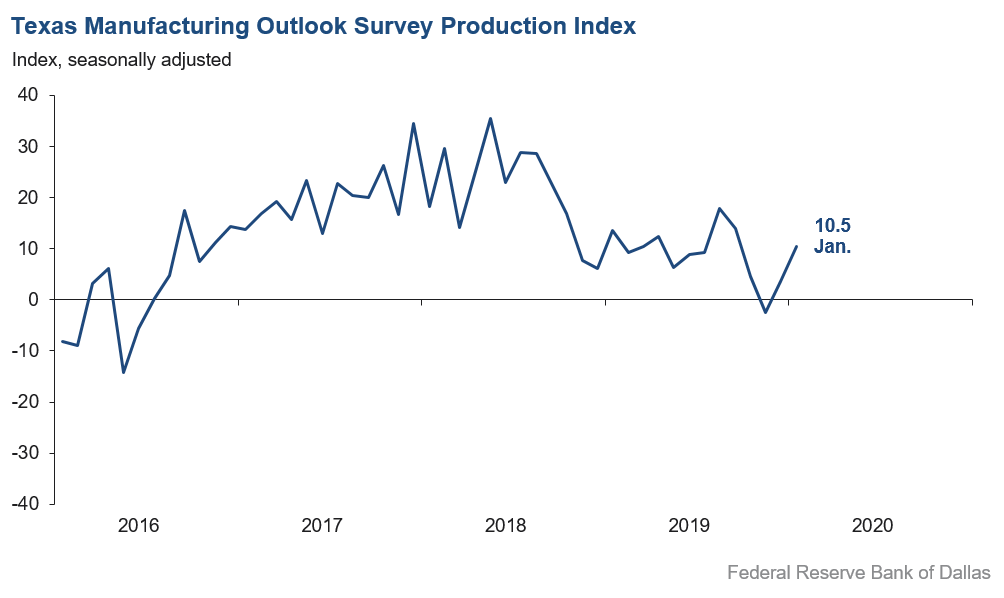
Growth in Texas factory activity accelerated in January, according to business executives responding to the Texas Manufacturing Outlook Survey. The production index, a key measure of state manufacturing conditions, rose seven points to 10.5, suggesting stronger output growth than last month.
Other measures of manufacturing activity also pointed to an acceleration in January. The new orders index shot up 16 points to 17.6, its highest reading in 15 months. The growth rate of orders index returned to positive territory, rising from -5.0 to 6.1. The capacity utilization and shipments indexes pushed further positive, coming in at 11.5 and 8.6, respectively.
Perceptions of broader business conditions were largely unchanged in January. The general business activity index came in at zero, with three-fourths of respondents noting no change this month and the rest split between improved and worsened activity. The January company outlook index reading was 1.9, with 78 percent of respondents noting no change in their outlooks. The index measuring uncertainty regarding companies’ outlooks edged down further to 2.7, a 20-month low.
Labor market measures suggested slower employment growth and no change in workweek length this month. The employment index retreated from 6.2 to 1.9, indicative of an abatement in hiring. Sixteen percent of firms noted net hiring, while 14 percent noted net layoffs. The hours worked index came in at zero.
Price pressures eased in January, while wage pressures inched up. The raw materials prices index declined five points to 9.5, a reading well below average. The finished goods prices index slipped into negative territory at -1.9, though the near-zero reading suggests no meaningful change in selling prices. The wages and benefits index ticked up to 16.3.
Expectations regarding future business conditions were slightly more optimistic in January. The indexes of future general business activity and future company outlook edged up to 7.6 and 15.6, respectively. Most other indexes for future manufacturing activity also pushed a bit further into positive territory.
Next release: Monday, February 24
|
Data were collected Jan. 13–22, and 117 Texas manufacturers responded to the survey. The Dallas Fed conducts the Texas Manufacturing Outlook Survey monthly to obtain a timely assessment of the state’s factory activity. Firms are asked whether output, employment, orders, prices and other indicators increased, decreased or remained unchanged over the previous month. Survey responses are used to calculate an index for each indicator. Each index is calculated by subtracting the percentage of respondents reporting a decrease from the percentage reporting an increase. When the share of firms reporting an increase exceeds the share reporting a decrease, the index will be greater than zero, suggesting the indicator has increased over the prior month. If the share of firms reporting a decrease exceeds the share reporting an increase, the index will be below zero, suggesting the indicator has decreased over the prior month. An index will be zero when the number of firms reporting an increase is equal to the number of firms reporting a decrease. Data have been seasonally adjusted as necessary. |
January 27, 2020
Results Summary
Historical data are available from June 2004 to the most current release month.
| Business Indicators Relating to Facilities and Products in Texas Current (versus previous month) | ||||||||
| Indicator | Jan Index | Dec Index | Change | Series Average | Trend* | % Reporting Increase | % Reporting No Change | % Reporting Decrease |
Production | 10.5 | 3.6 | +6.9 | 10.4 | 2(+) | 27.3 | 55.9 | 16.8 |
Capacity Utilization | 11.5 | 7.8 | +3.7 | 8.1 | 2(+) | 25.5 | 60.5 | 14.0 |
New Orders | 17.6 | 1.6 | +16.0 | 6.4 | 2(+) | 30.8 | 56.0 | 13.2 |
Growth Rate of Orders | 6.1 | –5.0 | +11.1 | 0.1 | 1(+) | 23.2 | 59.7 | 17.1 |
Unfilled Orders | –3.6 | –5.4 | +1.8 | –2.9 | 7(–) | 9.7 | 77.0 | 13.3 |
Shipments | 8.6 | 3.0 | +5.6 | 9.2 | 2(+) | 24.9 | 58.8 | 16.3 |
Delivery Time | –3.0 | –7.0 | +4.0 | –0.5 | 4(–) | 5.1 | 86.8 | 8.1 |
Finished Goods Inventories | –3.5 | –12.3 | +8.8 | –3.1 | 10(–) | 11.5 | 73.5 | 15.0 |
Prices Paid for Raw Materials | 9.5 | 14.5 | –5.0 | 24.6 | 46(+) | 15.8 | 77.9 | 6.3 |
Prices Received for Finished Goods | –1.9 | 0.7 | –2.6 | 6.4 | 1(–) | 9.7 | 78.7 | 11.6 |
Wages and Benefits | 16.3 | 14.6 | +1.7 | 18.8 | 126(+) | 17.6 | 81.1 | 1.3 |
Employment | 1.9 | 6.2 | –4.3 | 6.6 | 37(+) | 16.3 | 69.3 | 14.4 |
Hours Worked | –0.2 | 2.6 | –2.8 | 2.8 | 1(–) | 14.0 | 71.8 | 14.2 |
Capital Expenditures | 9.1 | 15.3 | –6.2 | 7.0 | 41(+) | 20.7 | 67.7 | 11.6 |
| General Business Conditions Current (versus previous month) | ||||||||
| Indicator | Jan Index | Dec Index | Change | Series Average | Trend** | % Reporting Improved | % Reporting No Change | % Reporting Worsened |
Company Outlook | 1.9 | 1.3 | +0.6 | 7.2 | 2(+) | 12.1 | 77.7 | 10.2 |
General Business Activity | –0.2 | –3.2 | +3.0 | 2.9 | 4(–) | 12.5 | 74.8 | 12.7 |
| Indicator | Jan Index | Dec Index | Change | Series Average | Trend* | % Reporting Increase | % Reporting No Change | % Reporting Decrease |
Outlook Uncertainty† | 2.7 | 5.6 | –2.9 | 9.4 | 20(+) | 13.3 | 76.1 | 10.6 |
| Business Indicators Relating to Facilities and Products in Texas Future (six months ahead) | ||||||||
| Indicator | Jan Index | Dec Index | Change | Series Average | Trend* | % Reporting Increase | % Reporting No Change | % Reporting Decrease |
Production | 38.9 | 36.9 | +2.0 | 38.7 | 131(+) | 45.7 | 47.5 | 6.8 |
Capacity Utilization | 37.4 | 35.8 | +1.6 | 35.6 | 131(+) | 43.7 | 50.0 | 6.3 |
New Orders | 40.1 | 32.6 | +7.5 | 36.5 | 131(+) | 47.7 | 44.7 | 7.6 |
Growth Rate of Orders | 27.0 | 26.8 | +0.2 | 26.9 | 131(+) | 34.4 | 58.2 | 7.4 |
Unfilled Orders | 8.3 | 0.0 | +8.3 | 4.0 | 1(+) | 15.1 | 78.1 | 6.8 |
Shipments | 38.3 | 30.1 | +8.2 | 37.5 | 131(+) | 45.4 | 47.6 | 7.1 |
Delivery Time | 5.8 | 4.1 | +1.7 | –1.8 | 4(+) | 11.6 | 82.6 | 5.8 |
Finished Goods Inventories | 0.9 | 8.0 | –7.1 | –0.5 | 2(+) | 15.7 | 69.4 | 14.8 |
Prices Paid for Raw Materials | 20.2 | 14.1 | +6.1 | 33.8 | 130(+) | 25.7 | 68.8 | 5.5 |
Prices Received for Finished Goods | 10.0 | 10.2 | –0.2 | 19.6 | 48(+) | 19.1 | 71.8 | 9.1 |
Wages and Benefits | 42.4 | 28.4 | +14.0 | 38.3 | 188(+) | 44.1 | 54.2 | 1.7 |
Employment | 25.3 | 17.8 | +7.5 | 22.3 | 86(+) | 37.4 | 50.5 | 12.1 |
Hours Worked | 14.2 | 9.6 | +4.6 | 9.4 | 44(+) | 20.6 | 73.0 | 6.4 |
Capital Expenditures | 28.3 | 20.1 | +8.2 | 20.2 | 122(+) | 34.5 | 59.3 | 6.2 |
| General Business Conditions Future (six months ahead) | ||||||||
| Indicator | Jan Index | Dec Index | Change | Series Average | Trend** | % Reporting Increase | % Reporting No Change | % Reporting Worsened |
Company Outlook | 15.6 | 13.9 | +1.7 | 21.1 | 48(+) | 23.9 | 67.8 | 8.3 |
General Business Activity | 7.6 | 6.4 | +1.2 | 14.5 | 4(+) | 17.9 | 71.8 | 10.3 |
*Shown is the number of consecutive months of expansion or contraction in the underlying indicator. Expansion is indicated by a positive index reading and denoted by a (+) in the table. Contraction is indicated by a negative index reading and denoted by a (–) in the table.
**Shown is the number of consecutive months of improvement or worsening in the underlying indicator. Improvement is indicated by a positive index reading and denoted by a (+) in the table. Worsening is indicated by a negative index reading and denoted by a (–) in the table.
†Added to survey in January 2018.
Data have been seasonally adjusted as necessary, with the exception of the outlook uncertainty index, which does not yet have a sufficiently long time series to test for seasonality.
January 27, 2020
Production Index
January 27, 2020
Comments from Survey Respondents
These comments are from respondents’ completed surveys and have been edited for publication.
Chemical Manufacturing
- Local regulatory agencies and the costs associated with wasteful fees to municipalities are an ongoing burden to business. Poor infrastructure in our primary location is not conducive to attracting and keeping quality employees.
- A decrease in car sales has a negative effect on our customers' volume.
Machinery Manufacturing
- China gets the business we lose. We manufacture steel products, and we’ve lost quite a bit of business to China.
- Business has fallen off but not as bad as I thought. However, we are not buying any new vehicles or inventory this year, and we continue to pay down all debt. We are worried about the political division and the elections this year and how divisive they are already. The effects on our customers’ outlook for their business are becoming more evident as they are taking a wait-and-watch attitude.
- Business activity is good and steady but not booming.
Computer and Electronic Product Manufacturing
- Industrial manufacturing is robust—the best I have seen in the last 10 years.
- After five quarters of contraction, our industry looks to be finding a bottom. We believe customer inventories that were built up over ’17–’18 are finally aligned and industry revenues should more closely match end consumption. The macro backdrop continues to remain uncertain due to trade tensions, but recent events could begin to reduce the uncertainty. Of course, over the past two years, this has changed quickly with one tweet. We’ve had some describe this as “persistent uncertainty,” and it is hard to believe that having the world’s two largest economies at war much longer won’t have an impact.
- We are running into multiple customers who overbuilt in 2019 and, therefore, have inventory heading into 2020. To correct the situation, order volumes dropped significantly in the first quarter. For now, it appears that once the inventory correction is made, orders will again increase, but it has created uncertainty in the shorter term.
- Steady as she goes. If [presidential] impeachment happens, then we will be worried.
Transportation Equipment Manufacturing
- We are adding new products to increase sales but see flat sales for existing products.
Beverage and Tobacco Product Manufacturing
- I am worried about the oilfield slowdown.
Paper Manufacturing
- We are finally adjusting our workforce downward to match the new reality of a slow manufacturing environment.
Printing and Related Support Activities
- This is normally a slow time of year for us, but we are actually a little busier now than last year at this time, and our sales are tracking higher than last year in both billings and incoming orders. We also have a few nice jobs lining up that could keep us busy in the slow winter months.
Historical Data
Historical data can be downloaded dating back to June 2004.
Indexes
Download indexes for all indicators. For the definitions of all variables, see Data Definitions.
| Unadjusted |
| Seasonally adjusted |
All Data
Download indexes and components of the indexes (percentage of respondents reporting increase, decrease, or no change). For the definitions of all variables, see Data Definitions.
| Unadjusted |
| Seasonally adjusted |
Questions regarding the Texas Manufacturing Outlook Survey can be addressed to Emily Kerr at emily.kerr@dal.frb.org.
Sign up for our email alert to be automatically notified as soon as the latest Texas Manufacturing Outlook Survey is released on the web.