Texas Manufacturing Outlook Survey

Solid Texas Manufacturing Expansion Continues, Though Costs Soar Higher
For this month’s survey, Texas business executives were asked supplemental questions on labor market and credit conditions. Results for these questions from the Texas Manufacturing Outlook Survey, Texas Service Sector Outlook Survey and Texas Retail Outlook Survey have been released together. Read the special questions results.
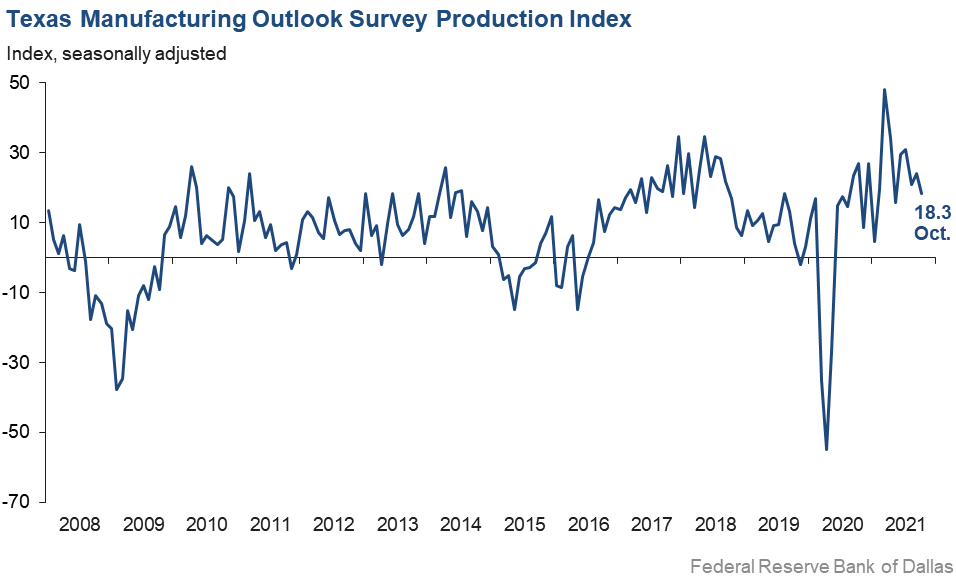
Texas factory activity continued to increase in October, albeit at a slightly slower pace, according to business executives responding to the Texas Manufacturing Outlook Survey. The production index, a key measure of state manufacturing conditions, fell six points to 18.3. The reading was still well above average and indicative of solid output growth.
Movements were mixed for other measures of manufacturing activity, though all indicated notable growth. While the shipments and capacity utilization indexes slipped slightly to 13.8 and 20.1, respectively, the survey’s demand indexes rose. The new orders index came in at 14.9, up five points from September and well above the series average of 6.6. The growth rate of orders index pushed up 11 points to 13.6. Supply-chain disruptions continued to plague many manufacturers, and the unfilled orders index and delivery time indexes pushed up to 20.9 and 25.9, respectively.
Perceptions of broader business conditions were more positive in October. The general business activity index jumped 10 points to 14.6, and the company outlook index rebounded to 2.4 after slipping into slightly negative territory last month. Uncertainty continued to rise, however, with the outlook uncertainty index reaching 29.0, its highest reading since April 2020 amid the onset of the pandemic.
Labor market measures indicated robust employment growth and longer workweeks. The employment index edged up further to 28.3, a six-month high. Thirty-two percent of firms noted net hiring, while 4 percent noted net layoffs. The hours worked index remained elevated and was largely steady at 18.5.
Prices and wages continued to increase strongly in October. The raw materials prices remained near an all-time high but edged down to 76.3, while the finished goods prices index rose to a new high of 49.8. The wages and benefits index held near its own series high at 44.1.
Expectations regarding future manufacturing activity were generally more positive in October. The future production index moved up five points to 46.8, and the future general business activity index inched up to 15.0. Most other measures of future manufacturing activity pushed further into positive territory.
Next release: Monday, November 29
Data were collected Oct. 12–20, and 101 Texas manufacturers responded to the survey. The Dallas Fed conducts the Texas Manufacturing Outlook Survey monthly to obtain a timely assessment of the state’s factory activity. Firms are asked whether output, employment, orders, prices and other indicators increased, decreased or remained unchanged over the previous month.
Survey responses are used to calculate an index for each indicator. Each index is calculated by subtracting the percentage of respondents reporting a decrease from the percentage reporting an increase. When the share of firms reporting an increase exceeds the share reporting a decrease, the index will be greater than zero, suggesting the indicator has increased over the prior month. If the share of firms reporting a decrease exceeds the share reporting an increase, the index will be below zero, suggesting the indicator has decreased over the prior month. An index will be zero when the number of firms reporting an increase is equal to the number of firms reporting a decrease. Data have been seasonally adjusted as necessary.
Results Summary
Historical data are available from June 2004 to the most current release month.
| Business Indicators Relating to Facilities and Products in Texas Current (versus previous month) | ||||||||
| Indicator | Oct Index | Sep Index | Change | Series Average | Trend* | % Reporting Increase | % Reporting No Change | % Reporting Decrease |
Production | 18.3 | 24.2 | –5.9 | 10.7 | 17(+) | 30.4 | 57.5 | 12.1 |
Capacity Utilization | 20.1 | 24.5 | –4.4 | 8.6 | 17(+) | 31.7 | 56.7 | 11.6 |
New Orders | 14.9 | 9.5 | +5.4 | 6.6 | 17(+) | 34.2 | 46.5 | 19.3 |
Growth Rate of Orders | 13.6 | 2.5 | +11.1 | 0.5 | 16(+) | 25.2 | 63.2 | 11.6 |
Unfilled Orders | 20.9 | 14.9 | +6.0 | –1.8 | 16(+) | 30.5 | 59.9 | 9.6 |
Shipments | 13.8 | 18.7 | –4.9 | 9.4 | 17(+) | 28.3 | 57.2 | 14.5 |
Delivery Time | 25.9 | 21.4 | +4.5 | 0.7 | 16(+) | 33.9 | 58.1 | 8.0 |
Finished Goods Inventories | –11.1 | 1.1 | –12.2 | –3.4 | 1(–) | 11.1 | 66.7 | 22.2 |
Prices Paid for Raw Materials | 76.3 | 80.4 | –4.1 | 26.4 | 18(+) | 76.7 | 22.9 | 0.4 |
Prices Received for Finished Goods | 49.8 | 44.0 | +5.8 | 7.4 | 15(+) | 50.5 | 48.8 | 0.7 |
Wages and Benefits | 44.1 | 42.7 | +1.4 | 19.2 | 18(+) | 45.2 | 53.7 | 1.1 |
Employment | 28.3 | 26.3 | +2.0 | 7.0 | 16(+) | 32.2 | 63.9 | 3.9 |
Hours Worked | 18.5 | 20.4 | –1.9 | 3.3 | 16(+) | 24.3 | 69.9 | 5.8 |
Capital Expenditures | 15.6 | 11.0 | +4.6 | 6.6 | 15(+) | 23.5 | 68.6 | 7.9 |
| General Business Conditions Current (versus previous month) | ||||||||
| Indicator | Oct Index | Sep Index | Change | Series Average | Trend** | % Reporting Improved | % Reporting No Change | % Reporting Worsened |
Company Outlook | 2.4 | –2.8 | +5.2 | 6.9 | 1(+) | 20.8 | 60.8 | 18.4 |
General Business Activity | 14.6 | 4.6 | +10.0 | 3.0 | 15(+) | 25.3 | 64.0 | 10.7 |
| Indicator | Oct Index | Sep Index | Change | Series Average | Trend* | % Reporting Increase | % Reporting No Change | % Reporting Decrease |
Outlook Uncertainty† | 29.0 | 23.3 | +5.7 | 13.5 | 6(+) | 35.0 | 59.0 | 6.0 |
| Business Indicators Relating to Facilities and Products in Texas Future (six months ahead) | ||||||||
| Indicator | Oct Index | Sep Index | Change | Series Average | Trend* | % Reporting Increase | % Reporting No Change | % Reporting Decrease |
Production | 46.8 | 41.8 | +5.0 | 38.6 | 18(+) | 54.5 | 37.8 | 7.7 |
Capacity Utilization | 48.6 | 31.9 | +16.7 | 35.4 | 18(+) | 53.0 | 42.6 | 4.4 |
New Orders | 39.3 | 33.4 | +5.9 | 36.2 | 18(+) | 47.9 | 43.6 | 8.6 |
Growth Rate of Orders | 29.3 | 25.9 | +3.4 | 27.0 | 18(+) | 39.7 | 49.9 | 10.4 |
Unfilled Orders | –0.1 | –2.9 | +2.8 | 3.9 | 3(–) | 16.4 | 67.1 | 16.5 |
Shipments | 48.5 | 32.9 | +15.6 | 37.1 | 18(+) | 54.8 | 38.9 | 6.3 |
Delivery Time | 5.8 | 10.2 | –4.4 | –1.3 | 9(+) | 24.7 | 56.4 | 18.9 |
Finished Goods Inventories | 6.7 | 9.4 | –2.7 | 0.3 | 12(+) | 21.1 | 64.4 | 14.4 |
Prices Paid for Raw Materials | 48.9 | 55.3 | –6.4 | 34.2 | 19(+) | 60.9 | 27.2 | 12.0 |
Prices Received for Finished Goods | 40.6 | 44.6 | –4.0 | 20.2 | 18(+) | 51.6 | 37.4 | 11.0 |
Wages and Benefits | 60.3 | 50.4 | +9.9 | 38.3 | 18(+) | 62.9 | 34.5 | 2.6 |
Employment | 35.1 | 49.8 | –14.7 | 22.8 | 17(+) | 41.9 | 51.3 | 6.8 |
Hours Worked | 7.1 | 18.7 | –11.6 | 9.4 | 18(+) | 13.5 | 80.1 | 6.4 |
Capital Expenditures | 24.9 | 30.0 | –5.1 | 19.9 | 17(+) | 37.4 | 50.1 | 12.5 |
| General Business Conditions Future (six months ahead) | ||||||||
| Indicator | Oct Index | Sep Index | Change | Series Average | Trend** | % Reporting Increase | % Reporting No Change | % Reporting Worsened |
Company Outlook | 14.1 | 12.7 | +1.4 | 20.7 | 17(+) | 29.2 | 55.7 | 15.1 |
General Business Activity | 15.0 | 11.5 | +3.5 | 14.7 | 17(+) | 28.0 | 59.0 | 13.0 |
*Shown is the number of consecutive months of expansion or contraction in the underlying indicator. Expansion is indicated by a positive index reading and denoted by a (+) in the table. Contraction is indicated by a negative index reading and denoted by a (–) in the table.
**Shown is the number of consecutive months of improvement or worsening in the underlying indicator. Improvement is indicated by a positive index reading and denoted by a (+) in the table. Worsening is indicated by a negative index reading and denoted by a (–) in the table.
†Added to survey in January 2018.
Data have been seasonally adjusted as necessary, with the exception of the outlook uncertainty index, which does not yet have a sufficiently long time series to test for seasonality.
Production Index
Comments from Survey Respondents
These comments are from respondents’ completed surveys and have been edited for publication.
- Fiscal policy by the government is continuing to create supply-chain concerns and leading to increased raw materials prices along with lower customer confidence for finished goods, which is severely weakening the forecast for the long-term viability of the U.S. economy. The potential for recession is ever increasing without major fiscal policy improvement.
- We are unable to secure enough raw materials to meet our growth demand from customers.
- Prices for raw materials have increased over the last six months. The rate of increase has slowed. The uncertainty over being able to purchase steel and cement is making our decisions more difficult. The proposed changes in federal taxes and COVID regulations are constricting our workforce and slowing our ability to meet customer expectations for deliveries.
- Problems continue to increase. We can’t hire enough people. We can’t get raw materials. Shipping times are increasing, and the cost of materials goes up every week. We just keep having price increases, but this is not driving down demand. I don’t think homebuilders care about costs anymore; they just want supply, and in as short a lead time as possible. The Biden administration must eliminate or reduce import tariffs ASAP. This will help with the cost issue and tamp down some inflation. And they must work on reducing the inbound freight traffic at the ports and the railyards. And encourage people to look for work and get jobs.
- It is beginning to feel like we are headed to a slowdown in a few months with inflation kicking in.
- Even though Biden terminated some of the incentives to promote folks not to work, there still seems little interest in working. We can teach [the job] if we could interest mostly anyone to get off their bottoms and respond to help-wanted signs. Are we really moving toward a socialist country?
- We can feel the pressure of material shortages and price escalations. We also feel the threat of increases in taxes and regulations.
- Rising costs of all elements of business are slowing construction demand; projects are being delayed or canceled.
- The decrease in new orders and RFQs [requests for quotations] demonstrates the increase in uncertainty in the economy, regulations and congressional actions (or lack thereof).
- We are anticipating a surge in business toward the end of the year and the beginning of 2022. Business has been like a roller-coaster, with sharp ups and downs. Incoming freight costs have skyrocketed, and the lead time for supplies is extremely long. The only answer is to anticipate future business and overstock raw materials to avoid production disruptions, which is risky but unavoidable.
- It is very difficult to see the economy getting better with the costs of everything going up. The mismanagement of the government is causing more confusion than ever, and the party in charge is more unlikely to figure things out than ever.
- As businesses are adjusting to more substantial work from home, our business is changing from premises-based installations to more cloud-based solutions that better support work from home (anywhere).
- Although the level of uncertainty remains unchanged, there is still a tremendous amount of uncertainty generally with component availability and continued rising prices. Demand is high in some areas, but not all areas, as some customers have overordered and are now pulling back. Others are scrambling to seek alternate designs to keep their products from totally being shut down with supply-chain constraints. The water is murky at best, but companies keep treading water and expending a lot of energy to keep things moving and stay afloat.
- We are dealing with a lot of supply-chain issues and increases. Everything is uncertain right now.
- The uncertainty that government is bringing to the industry is already affecting industrial production. Here we go again, from a government enabler to a ruler.
- Raw materials domestically, such as steel bar and tubing, have been pushed from a normal eight weeks out to nine to 12 months. We are being forced to resort to European and Asian steel purchases.
- Employment, supply-chain problems and inflation remain major threats. Government mandates exacerbate it all. Our outlook is deteriorating when it should all be positive.
- New orders are exceeding our expectations; however, they are not translating into increased revenues and profits due to production constraints related to labor and supply-chain challenges. Therefore, our production backlog and order lead times are increasing while margins and profits are decreasing due to higher labor and material costs.
- The battles between the federal and state government regarding vaccination now go beyond education and health care and will affect most companies. The uncertainty to the business is added to the worsening of labor relations, when employees expect the company to take a stance or provide clearer guidelines than are available. It is a strange state of affairs, where it is hard to see the benefits to the health of the economy or the country. Added to the battles on budgets and federal debt, one may wonder how to make business decisions for the future in this environment.
- Skilled labor shortages and employees not fulfilling 40-hour workweeks are a critical problem. Some supply items are on restrictive distribution.
- Inflationary pressures had caused us to raise the price on our production. We routinely pass on raw material costs based on a price index widely used in the industry. This is the first non-raw-material price increase we have had in the 15 years that I have owned this company. This increase and the inflationary implication have added to the customers’ belief that they must order against future price increases. Our customers are deluged with price increases. It doesn't take long for the inflationary concept to take hold. Labor is unavailable at virtually any level; $13- to $15-per-hour jobseekers (if you can find any) now want $18. No experience. It is chaotic.
- We have implemented a price increase to cover increased wages that we will soon be paying, plus covering increased overhead items.
- Raw materials (packaging) are becoming much more scarce. Lead times for materials are four times what they were just three to four months ago.
- Overall, we are seeing increased price pressure from our suppliers. Additionally, we expect increases in both wages and benefits in the future, without an offset in selling prices.
- We cannot find skilled employees, or nonskilled for that matter. Parts and supplies are difficult to find and expensive.
- The inability to get raw materials timely is affecting our output—reducing it.
Historical Data
Historical data can be downloaded dating back to June 2004.
Indexes
Download indexes for all indicators. For the definitions of all variables, see Data Definitions.
| Unadjusted |
| Seasonally adjusted |
All Data
Download indexes and components of the indexes (percentage of respondents reporting increase, decrease, or no change). For the definitions of all variables, see Data Definitions.
| Unadjusted |
| Seasonally adjusted |
Questions regarding the Texas Manufacturing Outlook Survey can be addressed to Emily Kerr at emily.kerr@dal.frb.org.
Sign up for our email alert to be automatically notified as soon as the latest Texas Manufacturing Outlook Survey is released on the web.