Texas Manufacturing Outlook Survey

Growth in Texas Manufacturing Activity Abates
For this month’s survey, Texas business executives were asked supplemental questions on supply-chain disruptions. Results for these questions from the Texas Manufacturing Outlook Survey, Texas Service Sector Outlook Survey and Texas Retail Outlook Survey have been released together. Read the special questions results.
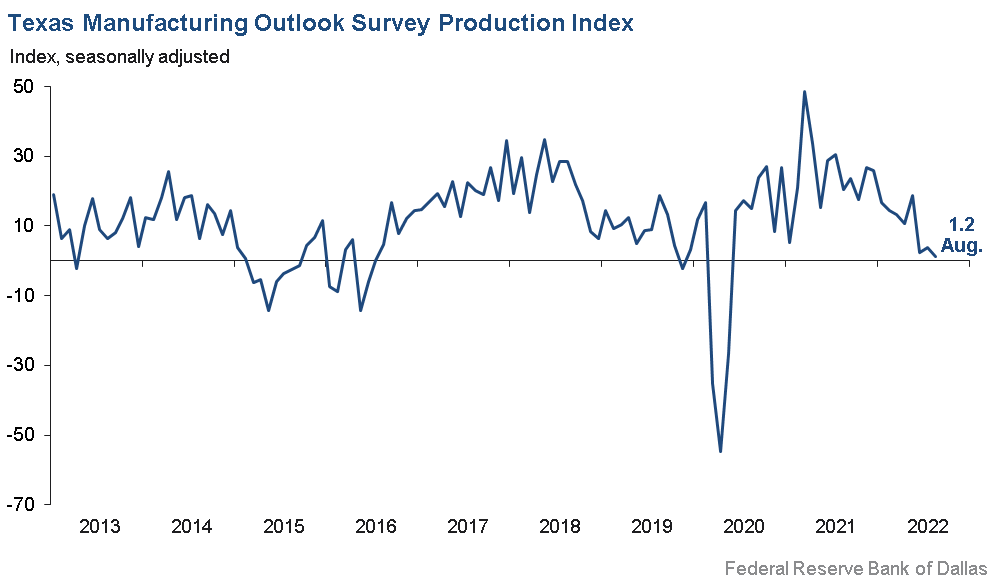
Growth in Texas factory activity abated in August, according to business executives responding to the Texas Manufacturing Outlook Survey. The production index, a key measure of state manufacturing conditions, ticked down to 1.2, a reading suggestive of very little change in output.
Other measures of manufacturing activity signaled slower growth or declines this month. The new orders index was negative for a third month in a row—suggesting a continued decrease in demand—though it moved up from -9.2 to -4.4. The growth rate of orders index also remained negative but moved down from -12.0 to -14.7. The capacity utilization index fell slightly to -0.6, and the shipments index was largely unchanged at 3.4.
Perceptions of broader business conditions continued to worsen in August. The general business activity index remained negative but shot up 10 points to -12.9. The company outlook index posted a sixth consecutive negative reading and edged up to -7.6. The outlook uncertainty index remained elevated but retreated from 33.7 to 24.4.
Labor market measures continued to indicate robust employment growth and longer workweeks. The employment index ticked down two points to 15.6, a reading significantly above its series average of 7.8. Twenty-seven percent of firms noted net hiring, while 12 percent noted net layoffs. The hours worked index pushed up five points to 14.4.
Prices and wages continued to increase, though price pressures moderated. The raw materials prices index fell four points to 34.4, a reading still above its average of 28.1 but far below its high of 83.3 last November. The finished goods prices index also moved down, from 29.3 to 26.8. The wages and benefits index, however, pushed higher in August to 45.8.
Expectations regarding future manufacturing activity were mixed in August. While the future production index pushed further into positive territory, coming in at 23.9, the future general business activity index remained negative, though it rose nine points to -8.8. Other measures of future manufacturing activity, like capacity utilization and new orders, pushed further positive in August.
Next release: Monday, September 26
Data were collected Aug. 16–24, and 86 Texas manufacturers responded to the survey. The Dallas Fed conducts the Texas Manufacturing Outlook Survey monthly to obtain a timely assessment of the state’s factory activity. Firms are asked whether output, employment, orders, prices and other indicators increased, decreased or remained unchanged over the previous month.
Survey responses are used to calculate an index for each indicator. Each index is calculated by subtracting the percentage of respondents reporting a decrease from the percentage reporting an increase. When the share of firms reporting an increase exceeds the share reporting a decrease, the index will be greater than zero, suggesting the indicator has increased over the prior month. If the share of firms reporting a decrease exceeds the share reporting an increase, the index will be below zero, suggesting the indicator has decreased over the prior month. An index will be zero when the number of firms reporting an increase is equal to the number of firms reporting a decrease. Data have been seasonally adjusted as necessary.
Results Summary
Historical data are available from June 2004 to the most current release month.
| Business Indicators Relating to Facilities and Products in Texas Current (versus previous month) | ||||||||
| Indicator | Aug Index | Jul Index | Change | Series Average | Trend* | % Reporting Increase | % Reporting No Change | % Reporting Decrease |
Production | 1.2 | 3.8 | –2.6 | 10.9 | 27(+) | 26.1 | 49.1 | 24.9 |
Capacity Utilization | –0.6 | 3.5 | –4.1 | 8.7 | 1(–) | 22.6 | 54.2 | 23.2 |
New Orders | –4.4 | –9.2 | +4.8 | 6.8 | 3(–) | 27.4 | 40.8 | 31.8 |
Growth Rate of Orders | –14.7 | –12.0 | –2.7 | 0.7 | 4(–) | 15.8 | 53.7 | 30.5 |
Unfilled Orders | –1.9 | 6.1 | –8.0 | –1.4 | 1(–) | 16.9 | 64.3 | 18.8 |
Shipments | 3.4 | 4.3 | –0.9 | 9.6 | 27(+) | 25.0 | 53.4 | 21.6 |
Delivery Time | –3.5 | 2.3 | –5.8 | 1.4 | 1(–) | 17.5 | 61.5 | 21.0 |
Finished Goods Inventories | 1.2 | 4.7 | –3.5 | –3.2 | 4(+) | 20.0 | 61.2 | 18.8 |
Prices Paid for Raw Materials | 34.4 | 38.4 | –4.0 | 28.1 | 28(+) | 45.8 | 42.8 | 11.4 |
Prices Received for Finished Goods | 26.8 | 29.3 | –2.5 | 8.9 | 25(+) | 34.3 | 58.2 | 7.5 |
Wages and Benefits | 45.8 | 38.1 | +7.7 | 20.6 | 28(+) | 46.2 | 53.4 | 0.4 |
Employment | 15.6 | 17.9 | –2.3 | 7.8 | 26(+) | 27.3 | 61.0 | 11.7 |
Hours Worked | 14.4 | 9.5 | +4.9 | 3.8 | 26(+) | 24.7 | 65.0 | 10.3 |
Capital Expenditures | 14.2 | 4.2 | +10.0 | 6.9 | 25(+) | 24.3 | 65.6 | 10.1 |
| General Business Conditions Current (versus previous month) | ||||||||
| Indicator | Aug Index | Jul Index | Change | Series Average | Trend** | % Reporting Improved | % Reporting No Change | % Reporting Worsened |
Company Outlook | –7.6 | –10.8 | +3.2 | 6.4 | 6(–) | 13.2 | 66.0 | 20.8 |
General Business Activity | –12.9 | –22.6 | +9.7 | 2.8 | 4(–) | 12.4 | 62.3 | 25.3 |
| Indicator | Aug Index | Jul Index | Change | Series Average | Trend* | % Reporting Increase | % Reporting No Change | % Reporting Decrease |
Outlook Uncertainty† | 24.4 | 33.7 | –9.3 | 16.0 | 16(+) | 30.2 | 64.0 | 5.8 |
| Business Indicators Relating to Facilities and Products in Texas Future (six months ahead) | ||||||||
| Indicator | Aug Index | Jul Index | Change | Series Average | Trend* | % Reporting Increase | % Reporting No Change | % Reporting Decrease |
Production | 23.9 | 13.6 | +10.3 | 38.2 | 28(+) | 43.2 | 37.6 | 19.3 |
Capacity Utilization | 19.0 | 13.8 | +5.2 | 35.1 | 28(+) | 39.2 | 40.6 | 20.2 |
New Orders | 6.7 | 3.6 | +3.1 | 35.7 | 28(+) | 30.0 | 46.7 | 23.3 |
Growth Rate of Orders | 6.4 | 2.6 | +3.8 | 26.5 | 2(+) | 27.6 | 51.2 | 21.2 |
Unfilled Orders | –8.6 | –6.3 | –2.3 | 3.6 | 3(–) | 14.1 | 63.2 | 22.7 |
Shipments | 15.4 | 2.6 | +12.8 | 36.6 | 28(+) | 37.0 | 41.3 | 21.6 |
Delivery Time | –10.0 | 2.4 | –12.4 | –1.2 | 1(–) | 10.7 | 68.6 | 20.7 |
Finished Goods Inventories | –9.7 | –5.1 | –4.6 | 0.4 | 4(–) | 11.0 | 68.3 | 20.7 |
Prices Paid for Raw Materials | 14.7 | 20.5 | –5.8 | 34.6 | 29(+) | 35.4 | 43.9 | 20.7 |
Prices Received for Finished Goods | 21.0 | 26.2 | –5.2 | 21.2 | 28(+) | 35.8 | 49.4 | 14.8 |
Wages and Benefits | 54.7 | 48.3 | +6.4 | 39.3 | 28(+) | 58.2 | 38.3 | 3.5 |
Employment | 24.5 | 29.7 | –5.2 | 23.4 | 27(+) | 33.8 | 56.9 | 9.3 |
Hours Worked | –0.5 | 6.4 | –6.9 | 9.4 | 1(–) | 16.9 | 65.7 | 17.4 |
Capital Expenditures | 16.4 | 19.0 | –2.6 | 20.0 | 27(+) | 31.1 | 54.2 | 14.7 |
| General Business Conditions Future (six months ahead) | ||||||||
| Indicator | Aug Index | Jul Index | Change | Series Average | Trend** | % Reporting Increase | % Reporting No Change | % Reporting Worsened |
Company Outlook | –3.0 | –11.8 | +8.8 | 20.0 | 4(–) | 19.2 | 58.6 | 22.2 |
General Business Activity | –8.8 | –17.7 | +8.9 | 14.2 | 4(–) | 17.1 | 57.0 | 25.9 |
*Shown is the number of consecutive months of expansion or contraction in the underlying indicator. Expansion is indicated by a positive index reading and denoted by a (+) in the table. Contraction is indicated by a negative index reading and denoted by a (–) in the table.
**Shown is the number of consecutive months of improvement or worsening in the underlying indicator. Improvement is indicated by a positive index reading and denoted by a (+) in the table. Worsening is indicated by a negative index reading and denoted by a (–) in the table.
†Added to survey in January 2018.
Data have been seasonally adjusted as necessary, with the exception of the outlook uncertainty index, which does not yet have a sufficiently long time series to test for seasonality.
Production Index
Comments from Survey Respondents
These comments are from respondents’ completed surveys and have been edited for publication.
- Markets are softening as inflationary policy is beginning to significantly affect end markets, driving down demand for basic materials.
- Wage increases off-cycle are being proposed to help workers with inflation impacts. Unfortunately, these will likely be negative impacts to earnings as market demand is softening.
- There is still a lot of momentum now, but we anticipate a slowdown later this year.
- Our building and construction shipments continue to decrease.
- Our bookings are slowing down a little now. Quoting for commercial jobs is strong through this year but drops off in 2023. We are very concerned about 2023. The second half looks bad at this time.
- Aluminum is very plentiful. Supply-chain problems are very minor compared to a year ago.
- Sales are steady at the present time; however, we are still uncertain about what to expect in the future. Therefore, we are reducing any unnecessary capital expenditures.
- The back end of the year looks much better in the oil business than earlier. We expect a rush of work because our backlog of quotes that we have been doing is at a record high and we are being told that all of these projects are still moving forward.
- We are having component issues—currently aluminum. So our backlog is large, but I am having to back-order our sales as well because we just can’t get random parts.
- We have seen weakening in the personal electronics market. Other markets continue to be steady or strong. There is a lot of evidence of inventory being built throughout our customers’ supply chains as earnings reports come in.
- The Biden administration, Congress and the Federal Reserve are on a negative path for the economy.
- While Dallas–Fort Worth continues to be a hot spot for relocation and development, the decrease in commercial office and corporate headquarters space (new build or renovation) has shifted our work to higher percentages of residential, health care and hospitality renovation.
- We have seen some improvement in the supply chain. The labor pool here is a labor puddle. We cannot find staff accountants.
- We are seeing moderate (-2 percent to -4 percent) decreases in volume, which is a shift from our historical volume trends (+6 percent). Consumer behavior is shifting to lower-priced items in our category as they struggle with inflation. We see particular stress in our highest-end products, notably our organic beef sausage, as consumers trade down. We see strong consumer response to promotions, which is driving up costs. We are currently recasting our volume forecast to align with this reality and believe that we can hit our financial targets for the year with increased operational efficiencies.
- We are on the verge of losing confidence for the rest of the year.
- We are extremely busy right now with several really large jobs in the shop at the same time. This seems to be an anomaly, with incoming orders tapering off some. We are still on track to have a banner year, with a large growth in sales compared to last year. Our year ends on Sept. 30, and we could be up 40 percent from last year.
Historical Data
Historical data can be downloaded dating back to June 2004.
Indexes
Download indexes for all indicators. For the definitions of all variables, see Data Definitions.
| Unadjusted |
| Seasonally adjusted |
All Data
Download indexes and components of the indexes (percentage of respondents reporting increase, decrease, or no change). For the definitions of all variables, see Data Definitions.
| Unadjusted |
| Seasonally adjusted |
Questions regarding the Texas Manufacturing Outlook Survey can be addressed to Emily Kerr at emily.kerr@dal.frb.org.
Sign up for our email alert to be automatically notified as soon as the latest Texas Manufacturing Outlook Survey is released on the web.