Texas Manufacturing Outlook Survey

Texas Manufacturing Growth Picks Up, Though Demand Continues to Decline
For this month’s survey, Texas business executives were asked supplemental questions on credit conditions and outlook concerns. Results for these questions from the Texas Manufacturing Outlook Survey, Texas Service Sector Outlook Survey and Texas Retail Outlook Survey have been released together. Read the special questions results.
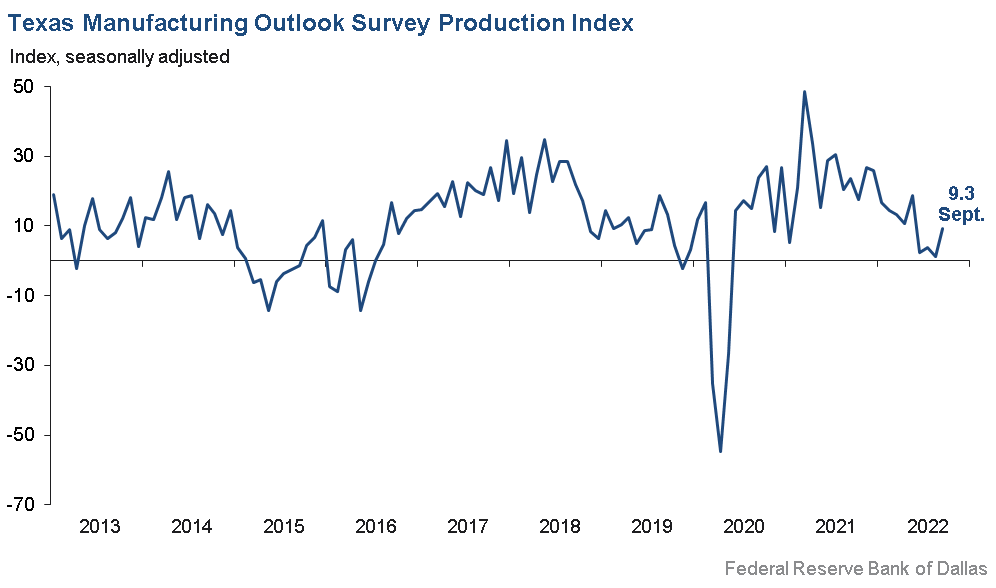
Growth in Texas factory activity picked up in September, according to business executives responding to the Texas Manufacturing Outlook Survey. The production index, a key measure of state manufacturing conditions, rose eight points to 9.3, a reading suggestive of stronger output growth.
Other measures of manufacturing activity showed mixed signals this month. The new orders index ticked down to -6.4―the fourth month in a row in negative territory—suggesting a continued decrease in demand. The growth rate of orders index also remained negative but moved up 13 points to -1.7. The capacity utilization index jumped to 13.4 after posting a near-zero reading in August, and the shipments index moved up to 7.1.
Perceptions of broader business conditions continued to worsen in September. The general business activity index pushed further negative, from -12.9 to -17.2. The company outlook index moved down three points to -10.7. The outlook uncertainty index remained elevated and inched up to 27.2.
Labor market measures continued to indicate robust employment growth and longer workweeks. The employment index was largely unchanged at 15.0, a reading significantly above its series average of 7.8. Twenty-four percent of firms noted net hiring, while 9 percent noted net layoffs. The hours worked index remained slightly elevated but moved down six points to 8.0.
Prices and wages continued to increase at an elevated pace. The raw materials prices index ticked up from 34.4 to 37.1, ending a three-month trend of easing price pressures. The finished goods prices index, however, continued its downward trend and fell nine points to 18.1, a reading still well above average. The wages and benefits index also fell nine points, coming in at 36.6.
Expectations regarding future manufacturing activity were mixed in September. While the future production index pushed further into positive territory at 28.3, the future general business activity index remained negative and dropped 14 points to -22.4. Other measures of future manufacturing activity, like new orders and employment, pushed further positive in September.
Next release: Monday, October 31
Data were collected Sept. 13–21, and 89 Texas manufacturers responded to the survey. The Dallas Fed conducts the Texas Manufacturing Outlook Survey monthly to obtain a timely assessment of the state’s factory activity. Firms are asked whether output, employment, orders, prices and other indicators increased, decreased or remained unchanged over the previous month.
Survey responses are used to calculate an index for each indicator. Each index is calculated by subtracting the percentage of respondents reporting a decrease from the percentage reporting an increase. When the share of firms reporting an increase exceeds the share reporting a decrease, the index will be greater than zero, suggesting the indicator has increased over the prior month. If the share of firms reporting a decrease exceeds the share reporting an increase, the index will be below zero, suggesting the indicator has decreased over the prior month. An index will be zero when the number of firms reporting an increase is equal to the number of firms reporting a decrease. Data have been seasonally adjusted as necessary.
Results Summary
Historical data are available from June 2004 to the most current release month.
| Business Indicators Relating to Facilities and Products in Texas Current (versus previous month) | ||||||||
| Indicator | Sep Index | Aug Index | Change | Series Average | Trend* | % Reporting Increase | % Reporting No Change | % Reporting Decrease |
Production | 9.3 | 1.2 | +8.1 | 10.8 | 28(+) | 32.6 | 44.2 | 23.3 |
Capacity Utilization | 13.4 | –0.6 | +14.0 | 8.7 | 1(+) | 32.0 | 49.5 | 18.6 |
New Orders | –6.4 | –4.4 | –2.0 | 6.7 | 4(–) | 25.3 | 43.0 | 31.7 |
Growth Rate of Orders | –1.7 | –14.7 | +13.0 | 0.6 | 5(–) | 22.2 | 53.9 | 23.9 |
Unfilled Orders | –0.1 | –1.9 | +1.8 | –1.4 | 2(–) | 19.5 | 60.9 | 19.6 |
Shipments | 7.1 | 3.4 | +3.7 | 9.6 | 28(+) | 32.3 | 42.5 | 25.2 |
Delivery Time | 0.9 | –3.5 | +4.4 | 1.4 | 1(+) | 18.9 | 63.1 | 18.0 |
Finished Goods Inventories | 3.3 | 1.2 | +2.1 | –3.2 | 5(+) | 20.2 | 62.9 | 16.9 |
Prices Paid for Raw Materials | 37.1 | 34.4 | +2.7 | 28.1 | 29(+) | 49.5 | 38.1 | 12.4 |
Prices Received for Finished Goods | 18.1 | 26.8 | –8.7 | 8.9 | 26(+) | 24.4 | 69.3 | 6.3 |
Wages and Benefits | 36.6 | 45.8 | –9.2 | 20.6 | 29(+) | 37.8 | 61.0 | 1.2 |
Employment | 15.0 | 15.6 | –0.6 | 7.8 | 27(+) | 24.4 | 66.2 | 9.4 |
Hours Worked | 8.0 | 14.4 | –6.4 | 3.8 | 27(+) | 23.3 | 61.4 | 15.3 |
Capital Expenditures | 13.6 | 14.2 | –0.6 | 7.0 | 26(+) | 20.6 | 72.4 | 7.0 |
| General Business Conditions Current (versus previous month) | ||||||||
| Indicator | Sep Index | Aug Index | Change | Series Average | Trend** | % Reporting Improved | % Reporting No Change | % Reporting Worsened |
Company Outlook | –10.7 | –7.6 | –3.1 | 6.4 | 7(–) | 14.2 | 60.8 | 24.9 |
General Business Activity | –17.2 | –12.9 | –4.3 | 2.7 | 5(–) | 12.8 | 57.2 | 30.0 |
| Indicator | Sep Index | Aug Index | Change | Series Average | Trend* | % Reporting Increase | % Reporting No Change | % Reporting Decrease |
Outlook Uncertainty† | 27.2 | 24.4 | +2.8 | 16.2 | 17(+) | 38.6 | 50.0 | 11.4 |
| Business Indicators Relating to Facilities and Products in Texas Future (six months ahead) | ||||||||
| Indicator | Sep Index | Aug Index | Change | Series Average | Trend* | % Reporting Increase | % Reporting No Change | % Reporting Decrease |
Production | 28.3 | 23.9 | +4.4 | 38.2 | 29(+) | 41.9 | 44.5 | 13.6 |
Capacity Utilization | 19.3 | 19.0 | +0.3 | 35.0 | 29(+) | 35.7 | 48.0 | 16.4 |
New Orders | 22.1 | 6.7 | +15.4 | 35.6 | 29(+) | 37.3 | 47.5 | 15.2 |
Growth Rate of Orders | 16.2 | 6.4 | +9.8 | 26.5 | 3(+) | 30.2 | 55.8 | 14.0 |
Unfilled Orders | –6.2 | –8.6 | +2.4 | 3.5 | 4(–) | 13.7 | 66.4 | 19.9 |
Shipments | 16.3 | 15.4 | +0.9 | 36.5 | 29(+) | 34.6 | 47.0 | 18.3 |
Delivery Time | –1.3 | –10.0 | +8.7 | –1.2 | 2(–) | 14.8 | 69.1 | 16.1 |
Finished Goods Inventories | 5.0 | –9.7 | +14.7 | 0.4 | 1(+) | 18.8 | 67.5 | 13.8 |
Prices Paid for Raw Materials | 22.9 | 14.7 | +8.2 | 34.6 | 30(+) | 41.0 | 41.0 | 18.1 |
Prices Received for Finished Goods | 22.8 | 21.0 | +1.8 | 21.2 | 29(+) | 37.3 | 48.2 | 14.5 |
Wages and Benefits | 50.9 | 54.7 | –3.8 | 39.4 | 29(+) | 50.9 | 49.1 | 0.0 |
Employment | 28.2 | 24.5 | +3.7 | 23.4 | 28(+) | 40.2 | 47.8 | 12.0 |
Hours Worked | 5.4 | –0.5 | +5.9 | 9.4 | 1(+) | 18.1 | 69.2 | 12.7 |
Capital Expenditures | 15.4 | 16.4 | –1.0 | 20.0 | 28(+) | 31.5 | 52.4 | 16.1 |
| General Business Conditions Future (six months ahead) | ||||||||
| Indicator | Sep Index | Aug Index | Change | Series Average | Trend** | % Reporting Increase | % Reporting No Change | % Reporting Worsened |
Company Outlook | –6.9 | –3.0 | –3.9 | 19.9 | 5(–) | 18.7 | 55.7 | 25.6 |
General Business Activity | –22.4 | –8.8 | –13.6 | 14.0 | 5(–) | 13.4 | 50.8 | 35.8 |
*Shown is the number of consecutive months of expansion or contraction in the underlying indicator. Expansion is indicated by a positive index reading and denoted by a (+) in the table. Contraction is indicated by a negative index reading and denoted by a (–) in the table.
**Shown is the number of consecutive months of improvement or worsening in the underlying indicator. Improvement is indicated by a positive index reading and denoted by a (+) in the table. Worsening is indicated by a negative index reading and denoted by a (–) in the table.
†Added to survey in January 2018.
Data have been seasonally adjusted as necessary, with the exception of the outlook uncertainty index, which does not yet have a sufficiently long time series to test for seasonality.
Production Index
Comments from Survey Respondents
These comments are from respondents’ completed surveys and have been edited for publication.
- Our order rate has decreased over the past month. We are only working four days on some of our equipment.
- Although we continue to see surges in new orders, there are still several uncertainties and key issues that give us pause on overall business conditions. While both low-skill and mid-skill jobs are nearly impossible to fill, this isn’t the only challenge manufacturing companies are facing. Continued talk of proposed rulemaking from the U.S. Department of Labor and Environmental Protection Agency give a vast majority of manufacturers concern. That coupled with evolving tax increases, inflationary woes and supply shortages simply do not seem conducive to any long-term growth confidence. The potential is there to realize significant post-COVID gains; however, the current administration is truly hindering the overall manufacturing sector with new regulatory and tax burdens.
- Lead times for some components are climbing (pumps, instrumentation and some coded vessel components).
- We see the general economic situation worsening, but our customers are still buying because the oil industry is still making money and they see a bright future even though they will not talk about it. Therefore, we have hired a few new people to support the business that is coming over the next couple of months.
- We are living in Alice in Wonderland ... it just gets worser and worser.
- Our company has been extremely fortunate to have developed a strong presence in the medical market, which is doing very well at the present time. However, our business in the electronics market is starting to contract.
- Workloads are increasing, but customers are still very slow to pay and do not agree to increases in pricing resulting from higher raw materials costs.
- We still have issues with items needed to produce, and lead time issues with processors and aluminum. It is causing a cash crunch.
- The personal electronics market shows signs of weakness and is expected to weaken further. Other markets, especially automobiles, remain strong. Inventory builds are reported throughout all channels.
- We have a critical supply component that we have not been able to procure for over six months, which has finally caused a partial shutdown on production for units that use that component.
- There is no optimism in the most positive outlook. Interest rate hikes will hit our industry hard. Poor federal polices and spending are just more economic “piling on.”
- We are beginning to see a slowdown in requests for bids on projects.
- We have seen a dramatic shift in consumer behavior and it is impacting our volume. Beginning in May, demand for our premium products started to wane as consumers shifted to less-expensive brands. This has accelerated as fuel and other costs have risen. We are taking aggressive steps to recoup the volume loss and are cutting expenses in order to hit our financial targets for the year. We are unsure of the duration of this shift in consumer behavior.
- There is a decline in optimism with regard to the business climate as well as our ability to stabilize it. The loss of domestic tranquility, the irresponsibility of governors and the Biden administration, and the loss of common defense and border security will have long-range and far-reaching consequences.
- Sales have started to slow this summer, as has our general outlook on business over the short and long term. Inflation and general uncertainty seem high with customers; as a luxury product [producer], we expect sales to fall as customers cut discretionary spending.
- Workforce shortages remain. Hiring is expensive or nonexistent. Customers are becoming more restless and looking for better service and price. Inflation is on everyone’s mind. It is not a healthy environment.
- We continue to be very busy; however, it feels like things are starting to slow down some, and I believe we will be slower in the coming months than we have been. It is very hard to tell what inflation with rising interest rates will do for discretionary spending, which drives a lot of the products we make.
Historical Data
Historical data can be downloaded dating back to June 2004.
Indexes
Download indexes for all indicators. For the definitions of all variables, see Data Definitions.
| Unadjusted |
| Seasonally adjusted |
All Data
Download indexes and components of the indexes (percentage of respondents reporting increase, decrease, or no change). For the definitions of all variables, see Data Definitions.
| Unadjusted |
| Seasonally adjusted |
Questions regarding the Texas Manufacturing Outlook Survey can be addressed to Emily Kerr at emily.kerr@dal.frb.org.
Sign up for our email alert to be automatically notified as soon as the latest Texas Manufacturing Outlook Survey is released on the web.