Texas Manufacturing Outlook Survey

Texas manufacturing sector growth remains solid
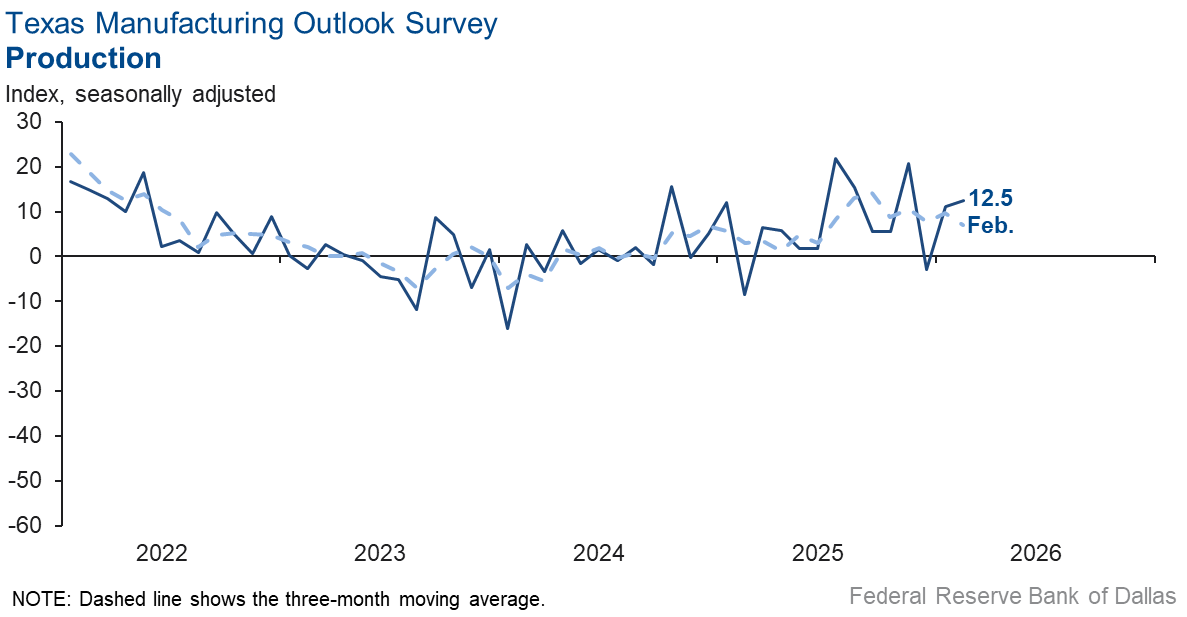
Texas factory activity continued to rise in February, according to business executives responding to the Texas Manufacturing Outlook Survey. The production index, a key measure of state manufacturing conditions, was largely unchanged at 12.5, a reading suggestive of an above-average pace of output expansion.
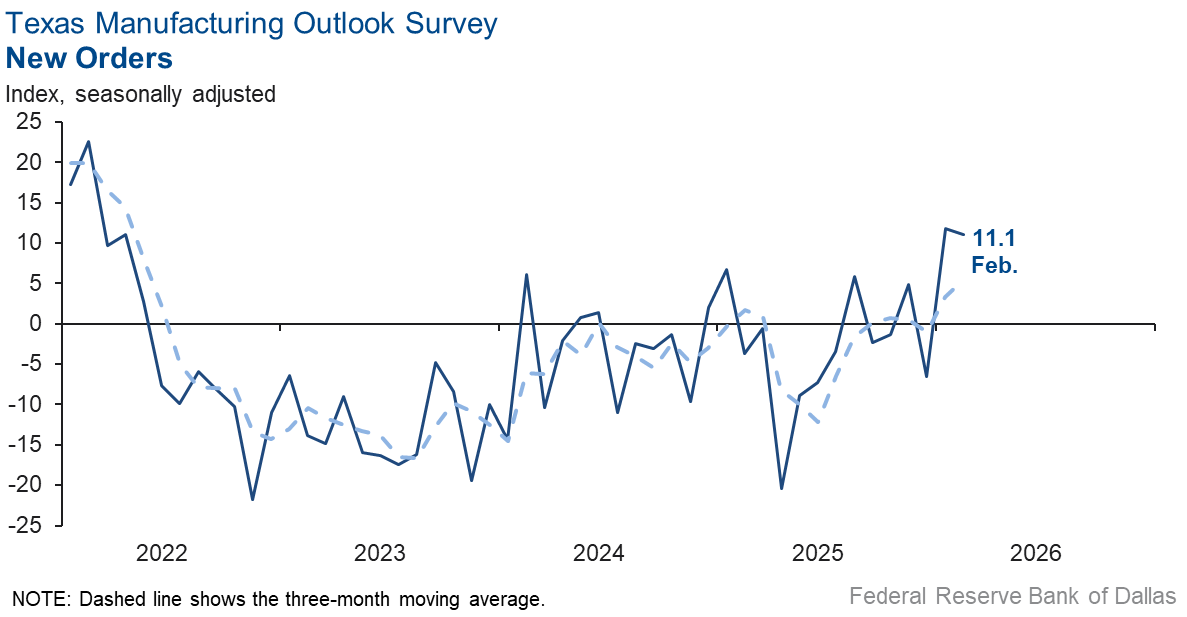
Other measures of manufacturing activity also showed signs of continued growth this month. The capacity utilization index moved up five points to 11.8, the new orders index was unchanged at 11.1, and the shipments index fell to 9.9 from 12.0.
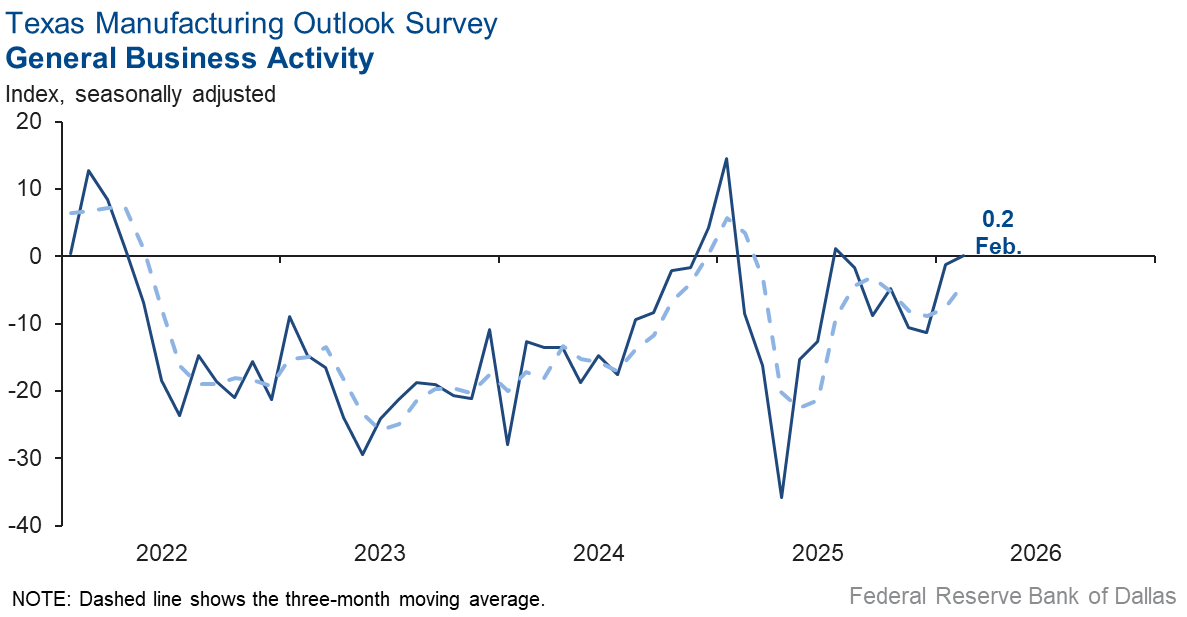
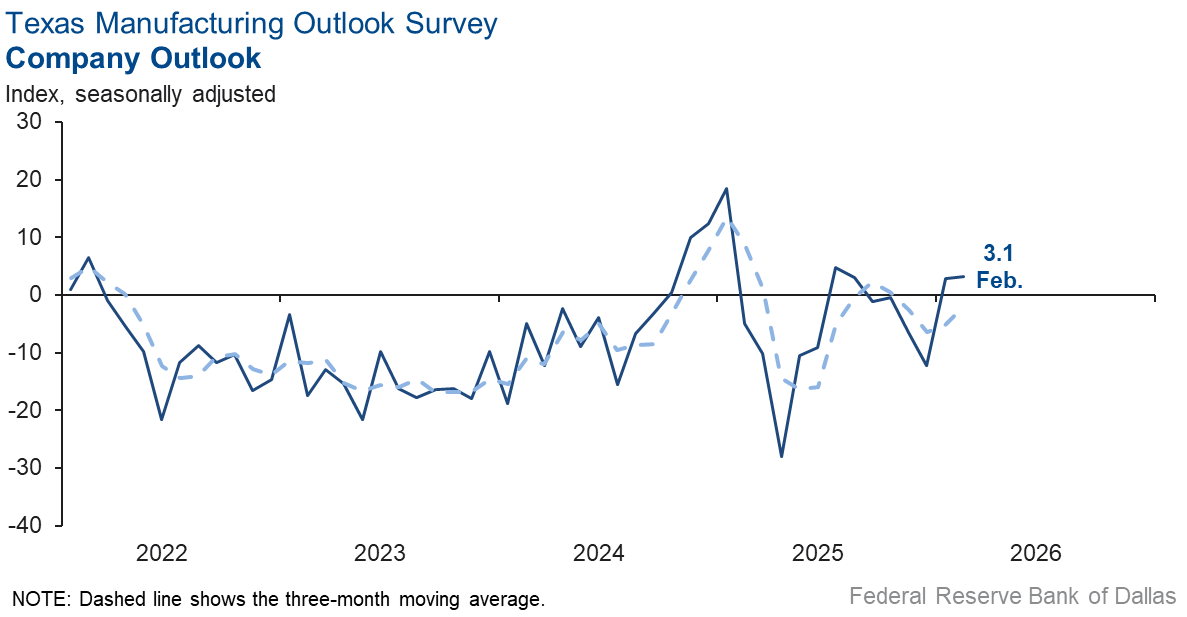
Perceptions of broader business conditions were stable in February. The general business activity index edged up to 0.2 from -1.2, with the near-zero reading indicating no change in business activity from January. The company outlook index was relatively unchanged at 3.1, with the low February reading signaling a slight improvement in company outlooks. The outlook uncertainty index increased to 6.5 but remained well below its average reading.
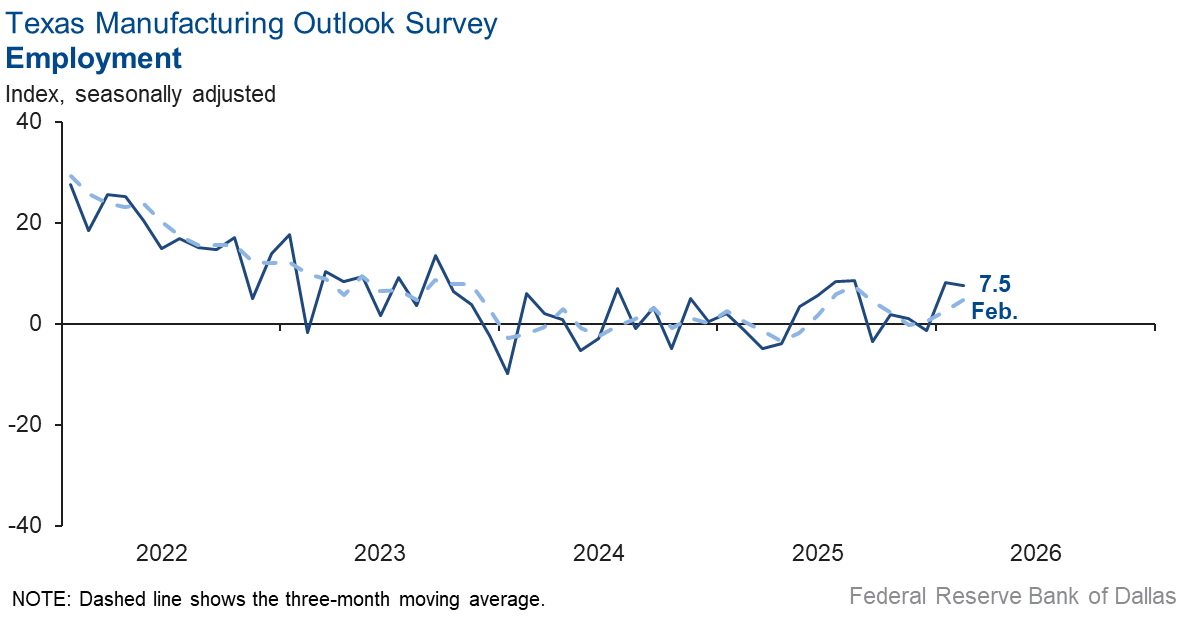
Employment growth continued, and workweeks got longer in February. The employment index held steady at 7.5, indicating employment grew at the same pace as last month. The hours worked index moved up to 6.1 from 0.7.
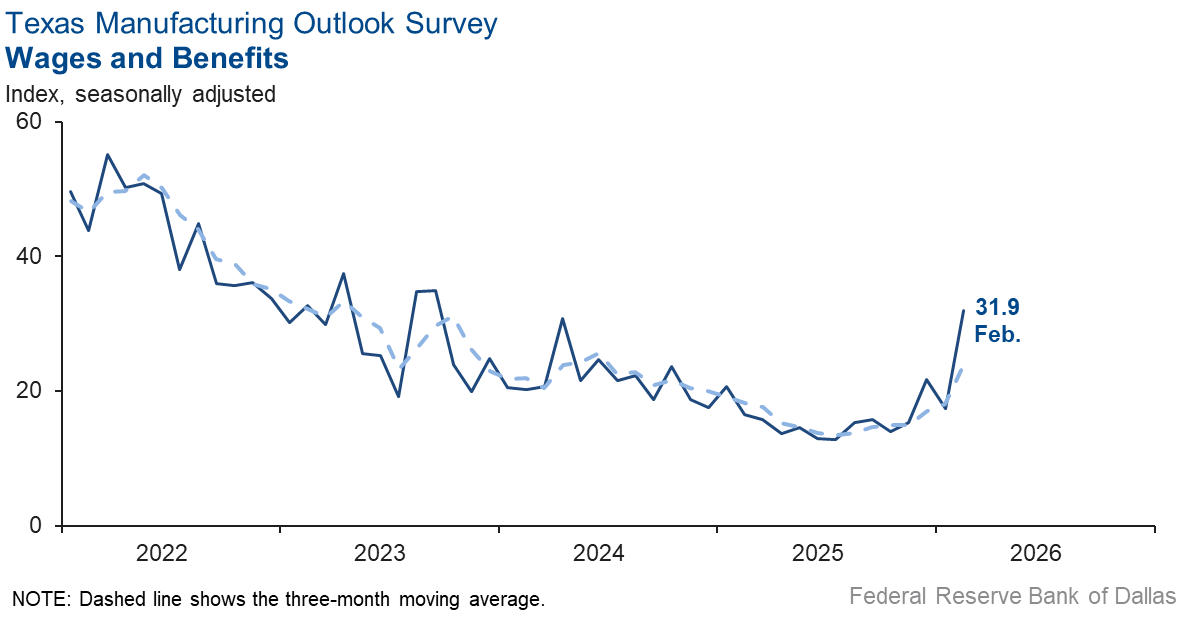
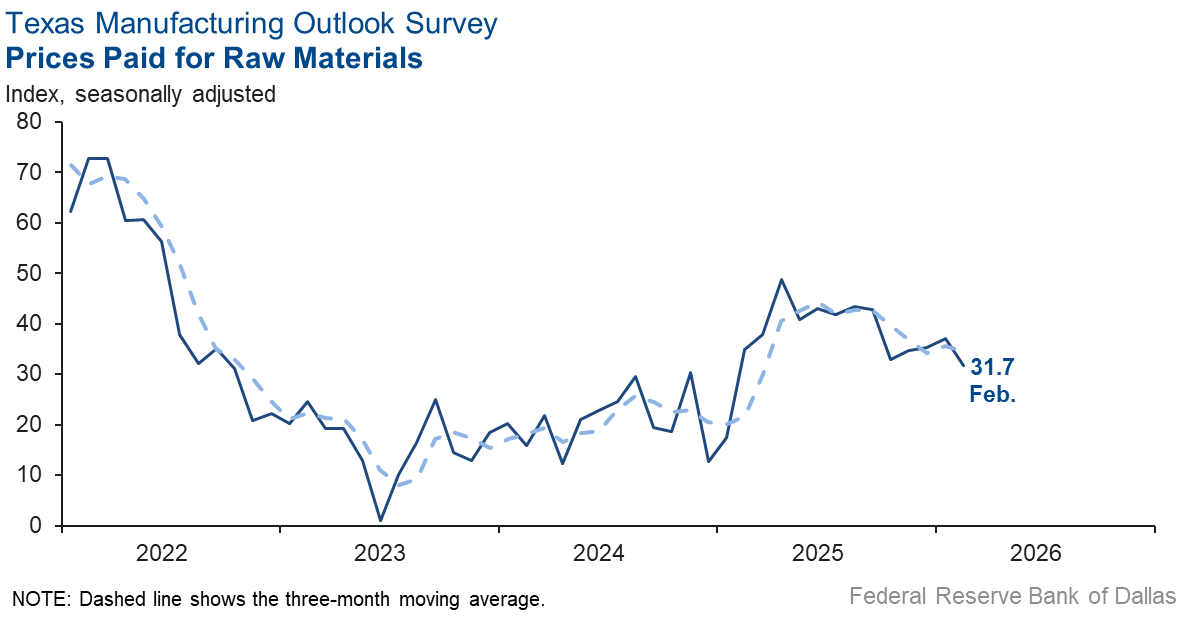
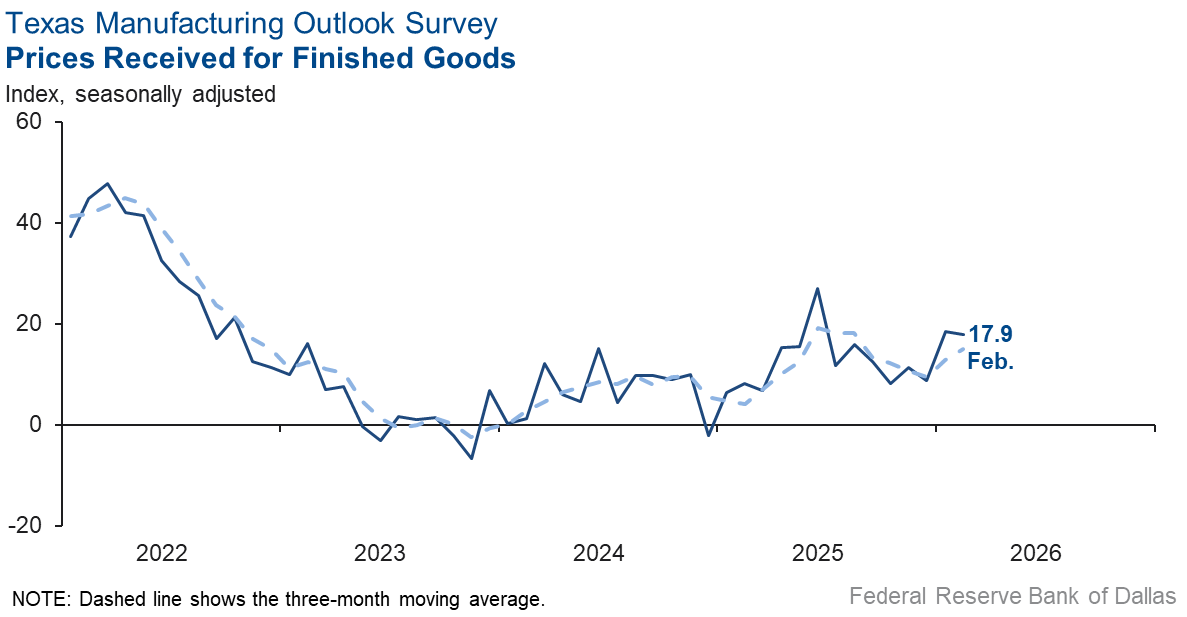
Selling price pressures were little changed, input price pressures eased, and wage growth increased considerably in February. The finished goods prices index held steady at 17.9 and the raw materials prices index fell five points to 31.7. The wages and benefits index rose to 31.9 from 17.4.
Expectations are for increased manufacturing activity six months from now. The future production index increased five points to 34.3, and the future general business activity index remained in positive territory but fell four points to 12.7. Other indexes of future manufacturing activity fell but remained in positive territory, indicating increased activity six months ahead.
Next release: Monday, March 30
Data were collected Feb. 10–18, and 80 of the 116 Texas manufacturers surveyed submitted responses. The Dallas Fed conducts the Texas Manufacturing Outlook Survey monthly to obtain a timely assessment of the state’s factory activity. Firms are asked whether output, employment, orders, prices and other indicators increased, decreased or remained unchanged over the previous month.
Survey responses are used to calculate an index for each indicator. Each index is calculated by subtracting the percentage of respondents reporting a decrease from the percentage reporting an increase. When the share of firms reporting an increase exceeds the share reporting a decrease, the index will be greater than zero, suggesting the indicator has increased over the prior month. If the share of firms reporting a decrease exceeds the share reporting an increase, the index will be below zero, suggesting the indicator has decreased over the prior month. An index will be zero when the number of firms reporting an increase is equal to the number of firms reporting a decrease. Data have been seasonally adjusted as necessary.
Results summary
Historical data are available from June 2004 to the most current release month.
| Business Indicators Relating to Facilities and Products in Texas Current (versus previous month) | ||||||||
| Indicator | Feb Index | Jan Index | Change | Series Average | Trend* | % Reporting Increase | % Reporting No Change | % Reporting Decrease |
Production | 12.5 | 11.2 | +1.3 | 9.6 | 2(+) | 31.6 | 49.3 | 19.1 |
Capacity Utilization | 11.8 | 7.1 | +4.7 | 7.4 | 2(+) | 29.3 | 53.2 | 17.5 |
New Orders | 11.1 | 11.8 | –0.7 | 4.7 | 2(+) | 33.9 | 43.3 | 22.8 |
Growth Rate of Orders | 8.6 | –6.7 | +15.3 | –1.2 | 1(+) | 31.7 | 45.3 | 23.1 |
Unfilled Orders | 2.9 | –6.1 | +9.0 | –2.7 | 1(+) | 17.9 | 67.1 | 15.0 |
Shipments | 9.9 | 12.0 | –2.1 | 7.8 | 2(+) | 32.3 | 45.3 | 22.4 |
Delivery Time | 11.6 | –2.7 | +14.3 | 0.6 | 1(+) | 15.0 | 81.6 | 3.4 |
Finished Goods Inventories | 8.9 | –12.2 | +21.1 | –3.3 | 1(+) | 22.8 | 63.3 | 13.9 |
Prices Paid for Raw Materials | 31.7 | 37.1 | –5.4 | 27.6 | 70(+) | 40.1 | 51.5 | 8.4 |
Prices Received for Finished Goods | 17.9 | 18.5 | –0.6 | 8.8 | 14(+) | 22.4 | 73.1 | 4.5 |
Wages and Benefits | 31.9 | 17.4 | +14.5 | 21.0 | 70(+) | 32.6 | 66.7 | 0.7 |
Employment | 7.5 | 8.2 | –0.7 | 7.1 | 2(+) | 18.0 | 71.5 | 10.5 |
Hours Worked | 6.1 | 0.7 | +5.4 | 3.0 | 2(+) | 17.4 | 71.3 | 11.3 |
Capital Expenditures | –0.4 | 8.2 | –8.6 | 6.6 | 1(–) | 15.2 | 69.2 | 15.6 |
| General Business Conditions Current (versus previous month) | ||||||||
| Indicator | Feb Index | Jan Index | Change | Series Average | Trend** | % Reporting Improved | % Reporting No Change | % Reporting Worsened |
Company Outlook | 3.1 | 2.9 | +0.2 | 4.1 | 2(+) | 24.2 | 54.7 | 21.1 |
General Business Activity | 0.2 | –1.2 | +1.4 | 0.2 | 1(+) | 24.5 | 51.2 | 24.3 |
| Indicator | Feb Index | Jan Index | Change | Series Average | Trend* | % Reporting Increase | % Reporting No Change | % Reporting Decrease |
Outlook Uncertainty | 6.5 | 4.8 | +1.7 | 16.8 | 2(+) | 22.1 | 62.3 | 15.6 |
| Business Indicators Relating to Facilities and Products in Texas Future (six months ahead) | ||||||||
| Indicator | Feb Index | Jan Index | Change | Series Average | Trend* | % Reporting Increase | % Reporting No Change | % Reporting Decrease |
Production | 34.3 | 29.2 | +5.1 | 36.0 | 70(+) | 48.0 | 38.4 | 13.7 |
Capacity Utilization | 27.3 | 25.1 | +2.2 | 32.8 | 70(+) | 41.4 | 44.5 | 14.1 |
New Orders | 25.0 | 32.0 | –7.0 | 33.4 | 40(+) | 41.2 | 42.6 | 16.2 |
Growth Rate of Orders | 14.5 | 24.9 | –10.4 | 24.7 | 30(+) | 32.0 | 50.5 | 17.5 |
Unfilled Orders | 5.8 | 0.6 | +5.2 | 2.7 | 3(+) | 18.0 | 69.8 | 12.2 |
Shipments | 31.6 | 28.4 | +3.2 | 34.3 | 70(+) | 46.8 | 38.1 | 15.2 |
Delivery Time | 1.1 | 3.2 | –2.1 | –1.3 | 3(+) | 11.2 | 78.7 | 10.1 |
Finished Goods Inventories | 2.7 | 11.7 | –9.0 | –0.2 | 3(+) | 17.8 | 67.1 | 15.1 |
Prices Paid for Raw Materials | 42.7 | 35.9 | +6.8 | 33.9 | 71(+) | 48.1 | 46.5 | 5.4 |
Prices Received for Finished Goods | 39.5 | 37.7 | +1.8 | 21.6 | 70(+) | 42.3 | 54.9 | 2.8 |
Wages and Benefits | 41.7 | 32.0 | +9.7 | 39.0 | 261(+) | 44.3 | 53.1 | 2.6 |
Employment | 16.8 | 18.1 | –1.3 | 22.7 | 69(+) | 32.6 | 51.6 | 15.8 |
Hours Worked | –0.4 | –1.3 | +0.9 | 8.5 | 2(–) | 10.7 | 78.2 | 11.1 |
Capital Expenditures | 10.7 | 22.0 | –11.3 | 19.3 | 69(+) | 24.0 | 62.7 | 13.3 |
| General Business Conditions Future (six months ahead) | ||||||||
| Indicator | Feb Index | Jan Index | Change | Series Average | Trend** | % Reporting Increase | % Reporting No Change | % Reporting Worsened |
Company Outlook | 25.7 | 23.2 | +2.5 | 18.3 | 10(+) | 38.2 | 49.4 | 12.5 |
General Business Activity | 12.7 | 16.6 | –3.9 | 12.3 | 10(+) | 28.0 | 56.7 | 15.3 |
*Shown is the number of consecutive months of expansion or contraction in the underlying indicator. Expansion is indicated by a positive index reading and denoted by a (+) in the table. Contraction is indicated by a negative index reading and denoted by a (–) in the table.
**Shown is the number of consecutive months of improvement or worsening in the underlying indicator. Improvement is indicated by a positive index reading and denoted by a (+) in the table. Worsening is indicated by a negative index reading and denoted by a (–) in the table.
Data have been seasonally adjusted as necessary.
Comments from survey respondents
Survey participants are given the opportunity to submit comments on current issues that may be affecting their businesses. Some comments have been edited for grammar and clarity.
- Our sales got off to a surprisingly strong start this year, which has us playing catch-up. That, along with a planned shutdown for a week in January for annual maintenance, has us scrambling right now. Whether these strong sales continue for the year or are just an anomaly is unknown, but we are treating this as a trend that will last for most of the year.
- Extreme volatility in the price of silver has affected us, but we have been able to pass price increases through to customers. In spite of the AI sound and fury in the stock market, the "real economy" continues to chug along. Our customers continue to place regular orders and have accepted price increases averaging 5-6 percent over last year.
- Availability dried [up], and prices increased significantly. Larger orders that need multiple management approval are difficult to manage since prices and availability are unpredictable. Prices tend to increase without notice; in some cases, twofold.
- We do not have debt, [and we] own our property. But we are closing our family business, active since 1958, because customers [either] are not buying or [are not] paying on time. Solid production demand in first half [of 2026], expected to slow a bit in second half.
- The federal and state policy issues have frozen us. which are fine with us.
- Things are looking good, but the week we closed because of the ice storm hurt our local customers and affected us as well.
- Business has been slow.
- Business remains strong, and we are receiving many new large opportunities.
- The floodgates have opened! What we've been praying for and hoping for is finally coming to fruition. We look to be firing on all cylinders this year and making up for lost time.
- Nice and steady which is good.
- Tariffs still have an impact in our business; they are a big unknown
- Tariffs are still a problem. Since we're direct-to-customer, it's also clear that consumers are being negatively impacted by the economy. Consumer spending has declined considerably.
- Continued depressed demand.
- It's just crazy how little demand is out there right now. We are seeing some uptick in quoting, and we will soon start to get jobs that normally occur in the spring and summer. We blame it all on the chaos and lack of consistency coming out of the federal government.
- The new tariffs are killing small-to-medium-sized manufacturing firms in several instances. One such example is the importation of tungsten. We purchase tungsten carbide from a U.S. firm, but they have no option but to purchase their raw materials from China, so the [tariff] costs get passed on to us. Our competitors in Ireland and Sweden are able to purchase the material from China with no tariffs involved. So, they can manufacture at lower prices and export to the U.S. U.S. manufacturing firms like us cannot compete under these circumstances.
- While we and our customers are seeing positive market signs, they are not large enough or consistent enough to instill any degree of confidence.
- Consumer confidence for large purchases is still weak.
Historical Data
Historical data can be downloaded dating back to June 2004.
Indexes
Download indexes for all indicators. For the definitions of all variables, see Data Definitions.
| Unadjusted |
| Seasonally adjusted |
All Data
Download indexes and components of the indexes (percentage of respondents reporting increase, decrease, or no change). For the definitions of all variables, see Data Definitions.
| Unadjusted |
| Seasonally adjusted |
Special questions
For this month’s survey, Texas business executives were asked supplemental questions on demand, regulation and hiring. Results below include responses from participants from both the Texas Manufacturing Outlook Survey and Texas Service Sector Outlook Survey. View individual survey results.
Questions regarding the Texas Business Outlook Surveys can be addressed to Jesus Cañas.
Sign up for our email alert to be automatically notified as soon as the latest Texas Manufacturing Outlook Survey is released on the web.