Texas Manufacturing Outlook Survey

Texas manufacturing sector contracts slightly
For this month’s survey, Texas business executives were asked supplemental questions on operating margins and expected demand. Results for these questions from the Texas Manufacturing Outlook Survey, Texas Service Sector Outlook Survey and Texas Retail Outlook Survey have been released together. Read the special questions results.
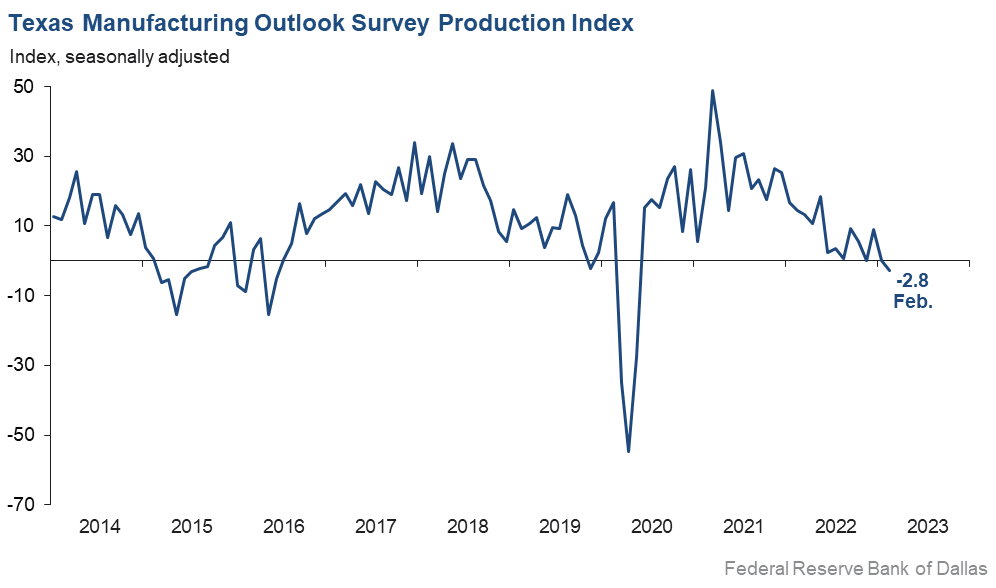
Texas factory activity declined in February for the first time since May 2020, according to business executives responding to the Texas Manufacturing Outlook Survey. The production index, a key measure of state manufacturing conditions, edged down from 0.2 to -2.8, a reading suggestive of a modest contraction in output.
Other measures of manufacturing activity also indicated contraction this month. The new orders index was negative for a ninth month in a row and moved down nine points to -13.2. The growth rate of orders index fell from -12.3 to -16.9. The capacity utilization index returned to negative territory after two positive readings, falling 10 points to -4.1, while the shipments index was largely unchanged at -5.0.
Perceptions of broader business conditions worsened in February as pessimism increased. The general business activity index pushed down from -8.4 to -13.5. The company outlook index has been negative for a full year and plummeted 15 points this month to -17.5. The outlook uncertainty index moved up to 25.0, a four-month high.
Labor market measures suggest relatively flat employment and longer workweeks. The employment index dipped below zero to -1.0 after tracking above average for more than two years. Fifteen percent of firms noted net hiring, while 16 percent noted net layoffs. The hours worked index held fairly steady at 4.9.
Price and wage pressures increased in February. The raw materials prices index moved up five points to 25.1, though it remained slightly below its series average of 28.0 for the fourth month in a row. The finished goods prices index rose from 9.9 to 15.8, elevated relative to its series average of 9.0. The wages and benefits index remained well above average and inched up two points to 32.7.
Expectations regarding future manufacturing activity were mixed in February. The future production index pushed further positive to 21.3, signaling output growth is expected over the next six months. The future general business activity index was slightly negative, moving up from -9.1 to -2.9. Most other measures of future manufacturing activity were positive this month.
Next release: Monday, March 27
Data were collected Feb. 14–22, and 100 Texas manufacturers responded to the survey. The Dallas Fed conducts the Texas Manufacturing Outlook Survey monthly to obtain a timely assessment of the state’s factory activity. Firms are asked whether output, employment, orders, prices and other indicators increased, decreased or remained unchanged over the previous month.
Survey responses are used to calculate an index for each indicator. Each index is calculated by subtracting the percentage of respondents reporting a decrease from the percentage reporting an increase. When the share of firms reporting an increase exceeds the share reporting a decrease, the index will be greater than zero, suggesting the indicator has increased over the prior month. If the share of firms reporting a decrease exceeds the share reporting an increase, the index will be below zero, suggesting the indicator has decreased over the prior month. An index will be zero when the number of firms reporting an increase is equal to the number of firms reporting a decrease. Data have been seasonally adjusted as necessary.
Results summary
Historical data are available from June 2004 to the most current release month.
| Business Indicators Relating to Facilities and Products in Texas Current (versus previous month) | ||||||||
| Indicator | Feb Index | Jan Index | Change | Series Average | Trend* | % Reporting Increase | % Reporting No Change | % Reporting Decrease |
Production | –2.8 | 0.2 | –3.0 | 10.7 | 1(–) | 24.5 | 48.3 | 27.3 |
Capacity Utilization | –4.1 | 6.0 | –10.1 | 8.6 | 1(–) | 17.5 | 60.9 | 21.6 |
New Orders | –13.2 | –4.0 | –9.2 | 6.3 | 9(–) | 22.3 | 42.2 | 35.5 |
Growth Rate of Orders | –16.9 | –12.3 | –4.6 | 0.3 | 10(–) | 15.1 | 52.9 | 32.0 |
Unfilled Orders | –13.3 | –6.7 | –6.6 | –1.5 | 7(–) | 11.9 | 62.9 | 25.2 |
Shipments | –5.0 | –6.3 | +1.3 | 9.2 | 2(–) | 24.8 | 45.3 | 29.8 |
Delivery Time | 3.4 | –0.2 | +3.6 | 1.4 | 1(+) | 21.0 | 61.5 | 17.6 |
Finished Goods Inventories | –3.0 | –8.9 | +5.9 | –3.2 | 3(–) | 17.2 | 62.6 | 20.2 |
Prices Paid for Raw Materials | 25.1 | 20.5 | +4.6 | 28.0 | 34(+) | 33.0 | 59.1 | 7.9 |
Prices Received for Finished Goods | 15.8 | 9.9 | +5.9 | 9.0 | 31(+) | 22.4 | 71.0 | 6.6 |
Wages and Benefits | 32.7 | 30.5 | +2.2 | 20.9 | 34(+) | 34.4 | 63.9 | 1.7 |
Employment | –1.0 | 17.6 | –18.6 | 7.8 | 1(–) | 15.0 | 68.9 | 16.0 |
Hours Worked | 4.9 | 3.8 | +1.1 | 3.8 | 3(+) | 21.8 | 61.3 | 16.9 |
Capital Expenditures | –1.3 | 11.6 | –12.9 | 6.9 | 1(–) | 12.2 | 74.3 | 13.5 |
| General Business Conditions Current (versus previous month) | ||||||||
| Indicator | Feb Index | Jan Index | Change | Series Average | Trend** | % Reporting Improved | % Reporting No Change | % Reporting Worsened |
Company Outlook | –17.5 | –2.5 | –15.0 | 5.9 | 12(–) | 11.1 | 60.3 | 28.6 |
General Business Activity | –13.5 | –8.4 | –5.1 | 2.3 | 10(–) | 11.7 | 63.1 | 25.2 |
| Indicator | Feb Index | Jan Index | Change | Series Average | Trend* | % Reporting Increase | % Reporting No Change | % Reporting Decrease |
Outlook Uncertainty† | 25.0 | 16.8 | +8.2 | 16.7 | 22(+) | 34.0 | 57.0 | 9.0 |
| Business Indicators Relating to Facilities and Products in Texas Future (six months ahead) | ||||||||
| Indicator | Feb Index | Jan Index | Change | Series Average | Trend* | % Reporting Increase | % Reporting No Change | % Reporting Decrease |
Production | 21.3 | 16.1 | +5.2 | 37.6 | 34(+) | 37.6 | 46.1 | 16.3 |
Capacity Utilization | 15.2 | 19.2 | –4.0 | 34.5 | 34(+) | 29.5 | 56.2 | 14.3 |
New Orders | 10.2 | 14.8 | –4.6 | 35.0 | 4(+) | 26.4 | 57.4 | 16.2 |
Growth Rate of Orders | 0.7 | 8.7 | –8.0 | 26.0 | 8(+) | 18.9 | 62.9 | 18.2 |
Unfilled Orders | –4.7 | –4.1 | –0.6 | 3.3 | 9(–) | 8.0 | 79.3 | 12.7 |
Shipments | 18.0 | 15.5 | +2.5 | 35.9 | 34(+) | 33.5 | 51.0 | 15.5 |
Delivery Time | –9.8 | –12.4 | +2.6 | –1.4 | 4(–) | 8.1 | 74.0 | 17.9 |
Finished Goods Inventories | –1.0 | –1.1 | +0.1 | 0.4 | 5(–) | 16.0 | 67.0 | 17.0 |
Prices Paid for Raw Materials | 25.1 | 14.2 | +10.9 | 34.3 | 35(+) | 38.7 | 47.6 | 13.6 |
Prices Received for Finished Goods | 24.5 | 11.3 | +13.2 | 21.2 | 34(+) | 30.9 | 62.8 | 6.4 |
Wages and Benefits | 38.2 | 43.7 | –5.5 | 39.4 | 34(+) | 42.4 | 53.4 | 4.2 |
Employment | 23.6 | 20.4 | +3.2 | 23.3 | 33(+) | 36.3 | 51.0 | 12.7 |
Hours Worked | 4.7 | 5.4 | –0.7 | 9.3 | 6(+) | 17.6 | 69.5 | 12.9 |
Capital Expenditures | 10.0 | 14.9 | –4.9 | 19.8 | 33(+) | 26.1 | 57.8 | 16.1 |
| General Business Conditions Future (six months ahead) | ||||||||
| Indicator | Feb Index | Jan Index | Change | Series Average | Trend** | % Reporting Increase | % Reporting No Change | % Reporting Worsened |
Company Outlook | –0.4 | 6.0 | –6.4 | 19.3 | 1(–) | 20.7 | 58.2 | 21.1 |
General Business Activity | –2.9 | –9.1 | +6.2 | 13.4 | 10(–) | 18.0 | 61.1 | 20.9 |
*Shown is the number of consecutive months of expansion or contraction in the underlying indicator. Expansion is indicated by a positive index reading and denoted by a (+) in the table. Contraction is indicated by a negative index reading and denoted by a (–) in the table.
**Shown is the number of consecutive months of improvement or worsening in the underlying indicator. Improvement is indicated by a positive index reading and denoted by a (+) in the table. Worsening is indicated by a negative index reading and denoted by a (–) in the table.
†Added to survey in January 2018.
Data have been seasonally adjusted as necessary, with the exception of the outlook uncertainty index, which does not yet have a sufficiently long time series to test for seasonality.
Production index
Comments from survey respondents
These comments are from respondents’ completed surveys and have been edited for publication.
- There has been some improvement in orders, but it is spotty and material specific, and is not showing a broad trend that influences a six-month outlook.
- January and the start of February resulted in headwinds following a strong fourth quarter. Customers are decreasing inventories held and asking for better terms.
- After a slow start to the year, we saw a lot of new orders in late January and early February. Despite the talk of recession, we believe that we'll continue to grow.
- We are seeing all markets slow with the exception of automobiles. Personal electronics is in its third quarter of correction; all other markets (except automobiles) are in their second. We would expect most markets to correct in about four to five quarters, likely when the automobiles segment begins to correct. Long-term demand continues to be strong. We continue to make investments to support growth long term.
- I am currently worried about the time I am seeing it take for my customers to pay me.
- The requirements for the Build America, Buy America Act are a hurdle because they have yet to be settled, and American manufacturing does not have the capacity to provide all the necessary materials for the construction projects. This is causing inflated prices and delayed project starts. Infrastructure projects are essential to the well-being of American citizens, not just the economy. [The water crises in] Jackson, Mississippi, and Flint, Michigan, are just two examples of the results of the high cost and unavailability of materials.
- Bid activity is high and consistent, but there seems to be a lot of projects on hold or being deferred.
- The market seems to have stabilized. Costs have leveled out, but we are seeing an uptick in protein raw material costs.
- All markets served have slowed down and are ordering lower quantities as compared with last year. Automotive OEM [original equipment manufacturers] customers’ volumes are most affected by lower quantities.
- We have seen a slowing the last two quarters and expect the same moving forward.
- Revenue dollars per sale are going down. People are watching their money.
- We expect recession in the second half of this year. We already had a first round of layoffs. We are looking at each employee very carefully to learn who may have to be in a second wave of layoffs, if and when business slows down again.
- Our residential building and construction business has decreased drastically over the past few months due to mortgage rate increases, inflation and other factors. One major factor affecting our industry is foreign competitors dumping product into the U.S. at lower prices than their domestic prices—and lower than U.S. producers’ prices. Mexico, India, Colombia, Ecuador, Vietnam, Malaysia, Turkey and Poland are among countries exporting aluminum extrusions to the U.S. at record levels.
- It seems like someone turned off the spigot, as we have gotten stupid slow, as have others in our industry. We are not sure if it’s the Federal Reserve jacking with interest rates, or else some sort of cyclical slowdown, but it feels like business has ground to a halt. We have some nice work planned for later on this year, but right now we are just stupid slow.
- A continued lack of labor (semi-skilled) is crippling. We have newly established training but can’t find people to train. Absenteeism is high as employees feel free to take time off because we are unable to replace workers, even when they do not comply with normal work rules.
- February has been a slow month; it is hard to know why, but our outlook has worsened for both our business and retail activity in general.
- Customer volumes in soft goods, specifically bed subcomponents, mattresses, comforters and pillows, have seen a sales reduction of 55 percent over last year.
- There is nothing positive with respect to the economy.
- We do believe that the second half of 2023 will see a general reduction in business levels but no contraction of pricing.
Historical Data
Historical data can be downloaded dating back to June 2004.
Indexes
Download indexes for all indicators. For the definitions of all variables, see Data Definitions.
| Unadjusted |
| Seasonally adjusted |
All Data
Download indexes and components of the indexes (percentage of respondents reporting increase, decrease, or no change). For the definitions of all variables, see Data Definitions.
| Unadjusted |
| Seasonally adjusted |
Questions regarding the Texas Manufacturing Outlook Survey can be addressed to Emily Kerr at emily.kerr@dal.frb.org.
Sign up for our email alert to be automatically notified as soon as the latest Texas Manufacturing Outlook Survey is released on the web.