Texas Manufacturing Outlook Survey

Texas manufacturing sees little growth, with production index near zero
For this month’s survey, Texas business executives were asked supplemental questions on labor market and credit conditions. Results for these questions from the Texas Manufacturing Outlook Survey, Texas Service Sector Outlook Survey and Texas Retail Outlook Survey have been released together. Read the special questions results.
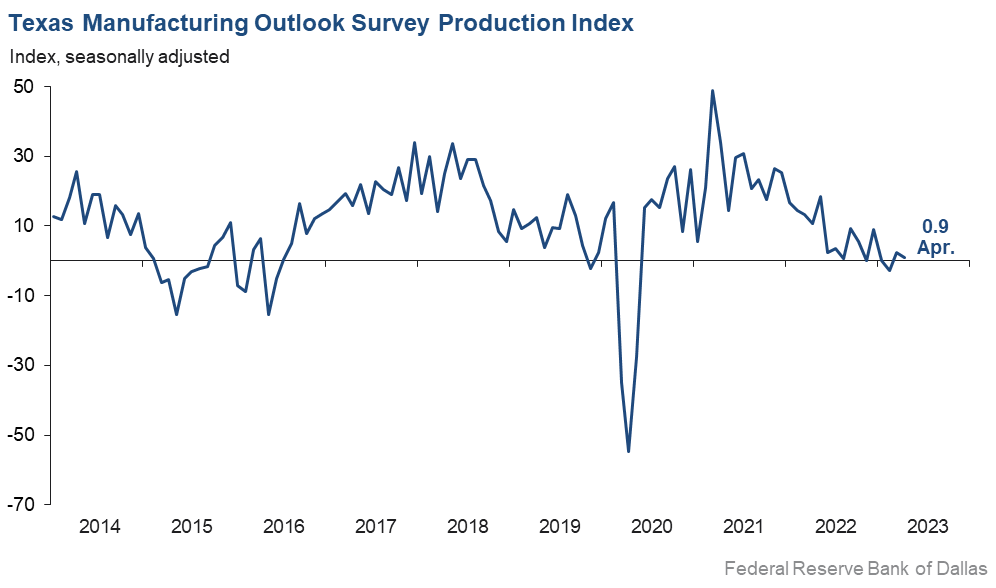
Texas factory activity was flat in April after growing modestly in March, according to business executives responding to the Texas Manufacturing Outlook Survey. The production index, a key measure of state manufacturing conditions, inched down from 2.5 to 0.9, with the near-zero reading suggestive of no change in output from last month.
Other measures of manufacturing activity showed mixed signals in April. The new orders index was negative for an 11th month in a row but moved up five points to -9.6. The growth rate of orders index also remained negative but rose from -15.2 to -11.1. The capacity utilization index edged up to 3.9, while the shipments index pushed up from -10.5 to -2.8.
Perceptions of broader business conditions worsened notably in April. The general business activity index dropped eight points to -23.4, its lowest reading in nine months. The company outlook index remained negative, ticking down two points to -15.6. The outlook uncertainty index pushed up to 24.7, elevated relative to its average reading of 16.9.
Labor market measures suggest moderate employment growth but a slight decline in work hours. The employment index ticked down two points to 8.0, in line with its average reading. Twenty percent of firms noted net hiring, while 12 percent noted net layoffs. The hours worked index dipped into negative territory, coming in at -2.7.
Prices and wages continued to increase in April. The raw materials prices index was largely unchanged at 19.5, a reading indicative of below-average increases in input costs. The finished goods prices index was also little changed, at 8.4. The wages and benefits index moved up seven points to 37.6, a stubbornly elevated reading relative to its average of 21.0.
Expectations regarding future manufacturing activity were mixed in April. The future production index plummeted from 13.5 to 3.0, with the low reading signaling little output growth over the next six months. The future general business activity index pushed further negative, from -11.2 to -16.6. Most other measures of future manufacturing activity remained positive but showed mixed movements this month.
Next release: Tuesday, May 30
Data were collected April 11–19, and 82 Texas manufacturers responded to the survey. The Dallas Fed conducts the Texas Manufacturing Outlook Survey monthly to obtain a timely assessment of the state’s factory activity. Firms are asked whether output, employment, orders, prices and other indicators increased, decreased or remained unchanged over the previous month.
Survey responses are used to calculate an index for each indicator. Each index is calculated by subtracting the percentage of respondents reporting a decrease from the percentage reporting an increase. When the share of firms reporting an increase exceeds the share reporting a decrease, the index will be greater than zero, suggesting the indicator has increased over the prior month. If the share of firms reporting a decrease exceeds the share reporting an increase, the index will be below zero, suggesting the indicator has decreased over the prior month. An index will be zero when the number of firms reporting an increase is equal to the number of firms reporting a decrease. Data have been seasonally adjusted as necessary.
Results summary
Historical data are available from June 2004 to the most current release month.
| Business Indicators Relating to Facilities and Products in Texas Current (versus previous month) | ||||||||
| Indicator | Apr Index | Mar Index | Change | Series Average | Trend* | % Reporting Increase | % Reporting No Change | % Reporting Decrease |
Production | 0.9 | 2.5 | –1.6 | 10.6 | 2(+) | 26.3 | 48.2 | 25.4 |
Capacity Utilization | 3.9 | 2.3 | +1.6 | 8.5 | 2(+) | 24.6 | 54.7 | 20.7 |
New Orders | –9.6 | –14.3 | +4.7 | 6.1 | 11(–) | 19.0 | 52.4 | 28.6 |
Growth Rate of Orders | –11.1 | –15.2 | +4.1 | 0.2 | 12(–) | 12.9 | 63.1 | 24.0 |
Unfilled Orders | –11.3 | –9.4 | –1.9 | –1.6 | 9(–) | 10.5 | 67.7 | 21.8 |
Shipments | –2.8 | –10.5 | +7.7 | 9.1 | 4(–) | 25.3 | 46.7 | 28.1 |
Delivery Time | –0.1 | 0.6 | –0.7 | 1.3 | 1(–) | 15.9 | 68.1 | 16.0 |
Finished Goods Inventories | –3.7 | 6.6 | –10.3 | –3.2 | 1(–) | 18.5 | 59.3 | 22.2 |
Prices Paid for Raw Materials | 19.5 | 20.3 | –0.8 | 27.9 | 36(+) | 28.6 | 62.3 | 9.1 |
Prices Received for Finished Goods | 8.4 | 7.0 | +1.4 | 9.0 | 33(+) | 18.3 | 71.8 | 9.9 |
Wages and Benefits | 37.6 | 30.5 | +7.1 | 21.0 | 36(+) | 38.6 | 60.4 | 1.0 |
Employment | 8.0 | 10.4 | –2.4 | 7.9 | 2(+) | 20.2 | 67.6 | 12.2 |
Hours Worked | –2.7 | 2.6 | –5.3 | 3.7 | 1(–) | 13.4 | 70.5 | 16.1 |
Capital Expenditures | 2.8 | 2.9 | –0.1 | 6.9 | 2(+) | 15.8 | 71.2 | 13.0 |
| General Business Conditions Current (versus previous month) | ||||||||
| Indicator | Apr Index | Mar Index | Change | Series Average | Trend** | % Reporting Improved | % Reporting No Change | % Reporting Worsened |
Company Outlook | –15.6 | –13.3 | –2.3 | 5.7 | 14(–) | 7.8 | 68.8 | 23.4 |
General Business Activity | –23.4 | –15.7 | –7.7 | 2.1 | 12(–) | 7.4 | 61.8 | 30.8 |
| Indicator | Apr Index | Mar Index | Change | Series Average | Trend* | % Reporting Increase | % Reporting No Change | % Reporting Decrease |
Outlook Uncertainty | 24.7 | 22.0 | +2.7 | 16.9 | null | 32.1 | 60.5 | 7.4 |
| Business Indicators Relating to Facilities and Products in Texas Future (six months ahead) | ||||||||
| Indicator | Apr Index | Mar Index | Change | Series Average | Trend* | % Reporting Increase | % Reporting No Change | % Reporting Decrease |
Production | 3.0 | 13.5 | –10.5 | 37.3 | 36(+) | 27.0 | 49.0 | 24.0 |
Capacity Utilization | 3.7 | 9.2 | –5.5 | 34.3 | 36(+) | 25.1 | 53.5 | 21.4 |
New Orders | 7.7 | 6.0 | +1.7 | 34.7 | 6(+) | 24.6 | 58.5 | 16.9 |
Growth Rate of Orders | 3.9 | 0.0 | +3.9 | 25.7 | 1(+) | 21.3 | 61.3 | 17.4 |
Unfilled Orders | –5.3 | –4.5 | –0.8 | 3.2 | 11(–) | 9.1 | 76.5 | 14.4 |
Shipments | 6.7 | 12.7 | –6.0 | 35.7 | 36(+) | 29.2 | 48.3 | 22.5 |
Delivery Time | –1.2 | 0.7 | –1.9 | –1.4 | 1(–) | 11.6 | 75.6 | 12.8 |
Finished Goods Inventories | 1.3 | 0.0 | +1.3 | 0.4 | 1(+) | 15.4 | 70.5 | 14.1 |
Prices Paid for Raw Materials | 7.6 | 24.9 | –17.3 | 34.2 | 37(+) | 24.1 | 59.4 | 16.5 |
Prices Received for Finished Goods | 1.3 | 18.6 | –17.3 | 21.1 | 36(+) | 21.8 | 57.7 | 20.5 |
Wages and Benefits | 30.4 | 41.2 | –10.8 | 39.4 | 36(+) | 33.9 | 62.6 | 3.5 |
Employment | 23.2 | 16.1 | +7.1 | 23.3 | 35(+) | 28.9 | 65.4 | 5.7 |
Hours Worked | 5.3 | –1.0 | +6.3 | 9.2 | 1(+) | 17.6 | 70.1 | 12.3 |
Capital Expenditures | 14.6 | 16.9 | –2.3 | 19.8 | 35(+) | 28.5 | 57.6 | 13.9 |
| General Business Conditions Future (six months ahead) | ||||||||
| Indicator | Apr Index | Mar Index | Change | Series Average | Trend** | % Reporting Increase | % Reporting No Change | % Reporting Worsened |
Company Outlook | –3.8 | –7.7 | +3.9 | 19.1 | 3(–) | 16.6 | 63.0 | 20.4 |
General Business Activity | –16.6 | –11.2 | –5.4 | 13.2 | 12(–) | 6.2 | 71.0 | 22.8 |
*Shown is the number of consecutive months of expansion or contraction in the underlying indicator. Expansion is indicated by a positive index reading and denoted by a (+) in the table. Contraction is indicated by a negative index reading and denoted by a (–) in the table.
**Shown is the number of consecutive months of improvement or worsening in the underlying indicator. Improvement is indicated by a positive index reading and denoted by a (+) in the table. Worsening is indicated by a negative index reading and denoted by a (–) in the table.
Data have been seasonally adjusted as necessary.
Production index
Comments from survey respondents
These comments are from respondents’ completed surveys and have been edited for publication.
- We are decreasing our systems sales business and transitioning to software as a service.
- The first quarter came in about as expected; all markets weakened with the exception of automotive. There are signs that inventories are building quickly in auto, so expect that market to weaken soon. There are no concerns in long-term demand outside of a significant macro deceleration. Inventory overbuild was expected/anticipated and usually takes three to six quarters to burn through to ship back to end demand.
- We have already been notified that our credit line renewal may be difficult. Our monthly increase in costs (rate) is at highs not seen since 2007.
- Some customers are pulling back due to high raw material costs.
- Funding has dried up to purchase our products.
- Federal Reserve efforts to subdue inflation are not over; further rate increases are anticipated. Will higher rates slow down economic activity and, if so, by how much?
- There is a definite slowdown. New orders virtually stopped.
- We are starting to see a real slowdown. We are hoping it is short lived.
- A slight decrease in material costs is offset by a continued increase in labor costs.
- Almost all of our customers have high inventories from overbuying last year. So, they are all cutting back on ordering new inventory. Business is slow as customers are waiting to see when recession starts. Most customers, when pressed, think the recession will start in summer. We are getting ready for our second layoff in the last four months.
- Business has gotten stupid slow, and we estimate having many days of just a few hours’ work due to low volume. This is crazy—as busy as we were last year, and now for this year to have it turn off so quickly, it is hard to understand why. We hear from many others in our industry, and they are all saying the same thing: that it's gotten slower without any signs of turning around in the near term. Perhaps it’s the Federal Reserve actions that are causing this.
- We are in the trucking industry. There has been some continued degradation of indicators in our market, such as dropping freight rates. We are still planning on a solid business year but with some decrease compared with the past 12 months.
Historical Data
Historical data can be downloaded dating back to June 2004.
Indexes
Download indexes for all indicators. For the definitions of all variables, see Data Definitions.
| Unadjusted |
| Seasonally adjusted |
All Data
Download indexes and components of the indexes (percentage of respondents reporting increase, decrease, or no change). For the definitions of all variables, see Data Definitions.
| Unadjusted |
| Seasonally adjusted |
Questions regarding the Texas Manufacturing Outlook Survey can be addressed to Emily Kerr at emily.kerr@dal.frb.org.
Sign up for our email alert to be automatically notified as soon as the latest Texas Manufacturing Outlook Survey is released on the web.