Texas Manufacturing Outlook Survey

Texas manufacturing output contracts again
For this month’s survey, Texas business executives were asked supplemental questions on the labor market. Results for these questions from the Texas Manufacturing Outlook Survey, Texas Service Sector Outlook Survey and Texas Retail Outlook Survey have been released together. Read the special questions results.
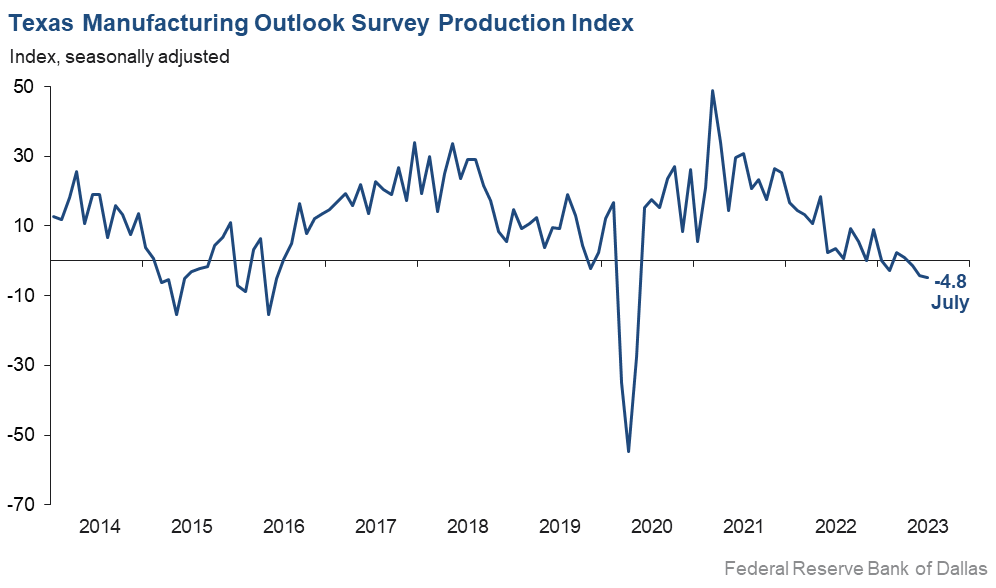
Texas factory activity declined in July, according to business executives responding to the Texas Manufacturing Outlook Survey. The production index, a key measure of state manufacturing conditions, held fairly steady at -4.8, a reading indicative of a modest contraction in output.
Other measures of manufacturing activity also indicated contraction in July. The new orders index has been in negative territory for more than a year and edged down to -18.1. The capacity utilization and shipments indexes remained negative but moved up to -2.4 and -2.2, respectively. The capital expenditures index continued to bounce around in the same low or slightly negative range since February; the July reading was -2.4.
Perceptions of broader business conditions continued to worsen in July. The general business activity index stayed negative but ticked up to -20.0, while the company outlook index pushed further negative to -16.9. The outlook uncertainty index moved up four points to 20.5.
Labor market measures suggest faster growth in employment and longer workweeks in July. The employment index rose eight points to 10.0, pushing back above its average reading of 7.9 after dipping below last month. Twenty-three percent of firms noted net hiring, while 13 percent noted net layoffs. The hours worked index returned to positive territory after three months, coming in at 3.9.
Price pressures increased in July but remained subdued, and wage growth moderated. The raw materials prices index rose nine points to 10.5, still well below its average reading of 27.6. The finished goods prices index moved up to 2.3, suggesting modest price growth this month. The wages and benefits index fell six points to 19.1, with the near-average reading indicative of a moderate increase in compensation costs.
Expectations regarding future manufacturing activity improved in July. The future production index remained positive but slipped to 15.5. The future general business activity index rose from -4.5 to 4.6, entering positive territory for the first time in more than a year. Other measures of future manufacturing activity showed mixed movements this month but remained solidly in positive territory.
Next release: Monday, August 28
Data were collected July 18–26, and 84 Texas manufacturers responded to the survey. The Dallas Fed conducts the Texas Manufacturing Outlook Survey monthly to obtain a timely assessment of the state’s factory activity. Firms are asked whether output, employment, orders, prices and other indicators increased, decreased or remained unchanged over the previous month.
Survey responses are used to calculate an index for each indicator. Each index is calculated by subtracting the percentage of respondents reporting a decrease from the percentage reporting an increase. When the share of firms reporting an increase exceeds the share reporting a decrease, the index will be greater than zero, suggesting the indicator has increased over the prior month. If the share of firms reporting a decrease exceeds the share reporting an increase, the index will be below zero, suggesting the indicator has decreased over the prior month. An index will be zero when the number of firms reporting an increase is equal to the number of firms reporting a decrease. Data have been seasonally adjusted as necessary.
Results summary
Historical data are available from June 2004 to the most current release month.
| Business Indicators Relating to Facilities and Products in Texas Current (versus previous month) | ||||||||
| Indicator | Jul Index | Jun Index | Change | Series Average | Trend* | % Reporting Increase | % Reporting No Change | % Reporting Decrease |
Production | –4.8 | –4.2 | –0.6 | 10.4 | 3(–) | 26.5 | 42.2 | 31.3 |
Capacity Utilization | –2.4 | –6.0 | +3.6 | 8.4 | 3(–) | 26.1 | 45.4 | 28.5 |
New Orders | –18.1 | –16.6 | –1.5 | 5.8 | 14(–) | 17.5 | 46.8 | 35.6 |
Growth Rate of Orders | –20.6 | –23.7 | +3.1 | –0.1 | 15(–) | 12.9 | 53.6 | 33.5 |
Unfilled Orders | –13.8 | –8.5 | –5.3 | –1.7 | 12(–) | 8.0 | 70.2 | 21.8 |
Shipments | –2.2 | –17.0 | +14.8 | 8.9 | 7(–) | 29.9 | 37.9 | 32.1 |
Delivery Time | –11.4 | –4.3 | –7.1 | 1.2 | 4(–) | 9.1 | 70.4 | 20.5 |
Finished Goods Inventories | –1.2 | –4.7 | +3.5 | –3.2 | 2(–) | 19.3 | 60.2 | 20.5 |
Prices Paid for Raw Materials | 10.5 | 1.4 | +9.1 | 27.6 | 39(+) | 22.3 | 65.9 | 11.8 |
Prices Received for Finished Goods | 2.3 | –1.9 | +4.2 | 8.9 | 1(+) | 16.0 | 70.3 | 13.7 |
Wages and Benefits | 19.1 | 25.3 | –6.2 | 21.0 | 39(+) | 21.9 | 75.3 | 2.8 |
Employment | 10.0 | 2.2 | +7.8 | 7.9 | 5(+) | 22.7 | 64.6 | 12.7 |
Hours Worked | 3.9 | –4.3 | +8.2 | 3.7 | 1(+) | 19.3 | 65.3 | 15.4 |
Capital Expenditures | –2.4 | 0.3 | –2.7 | 6.8 | 1(–) | 15.2 | 67.2 | 17.6 |
| General Business Conditions Current (versus previous month) | ||||||||
| Indicator | Jul Index | Jun Index | Change | Series Average | Trend** | % Reporting Improved | % Reporting No Change | % Reporting Worsened |
Company Outlook | –16.9 | –10.7 | –6.2 | 5.5 | 17(–) | 8.3 | 66.5 | 25.2 |
General Business Activity | –20.0 | –23.2 | +3.2 | 1.7 | 15(–) | 10.2 | 59.6 | 30.2 |
| Indicator | Jul Index | Jun Index | Change | Series Average | Trend* | % Reporting Increase | % Reporting No Change | % Reporting Decrease |
Outlook Uncertainty | 20.5 | 16.7 | +3.8 | 16.9 | 27(+) | 28.9 | 62.7 | 8.4 |
| Business Indicators Relating to Facilities and Products in Texas Future (six months ahead) | ||||||||
| Indicator | Jul Index | Jun Index | Change | Series Average | Trend* | % Reporting Increase | % Reporting No Change | % Reporting Decrease |
Production | 15.5 | 24.2 | –8.7 | 37.1 | 39(+) | 33.4 | 48.7 | 17.9 |
Capacity Utilization | 10.8 | 18.4 | –7.6 | 34.0 | 39(+) | 31.0 | 48.8 | 20.2 |
New Orders | 19.7 | 17.0 | +2.7 | 34.4 | 9(+) | 35.8 | 48.1 | 16.1 |
Growth Rate of Orders | 12.3 | 11.0 | +1.3 | 25.5 | 2(+) | 24.2 | 63.9 | 11.9 |
Unfilled Orders | 2.3 | –2.8 | +5.1 | 3.1 | 1(+) | 11.3 | 79.7 | 9.0 |
Shipments | 16.9 | 25.4 | –8.5 | 35.4 | 39(+) | 33.1 | 50.7 | 16.2 |
Delivery Time | –5.4 | –2.3 | –3.1 | –1.4 | 4(–) | 6.3 | 82.0 | 11.7 |
Finished Goods Inventories | –5.1 | –12.5 | +7.4 | 0.2 | 3(–) | 12.8 | 69.2 | 17.9 |
Prices Paid for Raw Materials | 13.6 | 4.4 | +9.2 | 33.8 | 40(+) | 27.4 | 58.8 | 13.8 |
Prices Received for Finished Goods | 11.6 | 2.5 | +9.1 | 20.9 | 39(+) | 24.4 | 62.8 | 12.8 |
Wages and Benefits | 42.7 | 34.9 | +7.8 | 39.4 | 39(+) | 44.9 | 52.9 | 2.2 |
Employment | 21.9 | 27.2 | –5.3 | 23.3 | 38(+) | 29.8 | 62.3 | 7.9 |
Hours Worked | 4.1 | 3.3 | +0.8 | 9.1 | 2(+) | 16.6 | 70.9 | 12.5 |
Capital Expenditures | 24.3 | 17.2 | +7.1 | 19.7 | 38(+) | 31.8 | 60.7 | 7.5 |
| General Business Conditions Future (six months ahead) | ||||||||
| Indicator | Jul Index | Jun Index | Change | Series Average | Trend** | % Reporting Increase | % Reporting No Change | % Reporting Worsened |
Company Outlook | 5.9 | 2.0 | +3.9 | 18.9 | 2(+) | 20.7 | 64.5 | 14.8 |
General Business Activity | 4.6 | –4.5 | +9.1 | 12.9 | 1(+) | 18.8 | 67.0 | 14.2 |
*Shown is the number of consecutive months of expansion or contraction in the underlying indicator. Expansion is indicated by a positive index reading and denoted by a (+) in the table. Contraction is indicated by a negative index reading and denoted by a (–) in the table.
**Shown is the number of consecutive months of improvement or worsening in the underlying indicator. Improvement is indicated by a positive index reading and denoted by a (+) in the table. Worsening is indicated by a negative index reading and denoted by a (–) in the table.
Data have been seasonally adjusted as necessary.
Production index
Comments from survey respondents
These comments are from respondents’ completed surveys and have been edited for publication.
- The chemical industry in general is in a slump currently.
- Interest hikes obviously significantly affect industrial production. We are seeing it across the board in 12 different segments of our industry. I wish the Federal Reserve would look at the industrial side and start cutting interest rates slowly. How much does the industrial backbone of this country have to suffer to lower inflation? We know the effect of interest [actions] does have a lag in economic results—why not prevent a recession by starting to lower interest rates now, rather than creating havoc in manufacturing?
- We continue to be concerned by all of the talk of a recession. We aren’t seeing that reflected in reduced customer demand yet. We intend to make significant capital investments over the next six months to expand capacity and reduce our unit costs, as we hope to gain market share in the event of a recession.
- We have the biggest backlog of projects ever. We are not able to expand due to the difficulty in hiring workers for the plant.
- Supply constraints are improving, but there are still some ongoing challenges.
- The summer doldrums are real … at least they are this month. Order interest has declined significantly, and order entry has slowed to a crawl. We’re bidding smaller jobs now than we have in 24 months. Raw material prices have eased, but so have selling prices to the point of creating margin erosion.
- We are seeing a slight increase in business; however, we will have to see if this trend will continue.
- Our industry is down approximately 6 to 7 percent for four quarters in a row.
- High interest rates are hurting some businesses like real estate and commercial construction. Other industries like transportation are still good. The Federal Reserve needs to stop rate increases to let businesses and consumers settle down.
- We are very fortunate to have some nice large jobs in the plant right now that are keeping us busy when many in our industry, including our competitors, are slow right now. We see our activity staying pretty strong into the fall, so we are fortunate. We had hoped to not have to raise prices but are having pressure from others to hire away our workers, so we are implementing wage increases that need to be covered by raising prices again.
- Our manufacturing of home goods, like mattress components, comforters and pillows, has decreased. Talking to suppliers and customers, the consensus of the bedding industry outlook continues to look bleak. High interest rates appear to be the main driver, as home sales are weak, and the associated new-mattress purchase that is known in our industry to go hand in hand is not happening. We have had to downsize the company three times in the past nine months—from three production sites to one.
Historical Data
Historical data can be downloaded dating back to June 2004.
Indexes
Download indexes for all indicators. For the definitions of all variables, see Data Definitions.
| Unadjusted |
| Seasonally adjusted |
All Data
Download indexes and components of the indexes (percentage of respondents reporting increase, decrease, or no change). For the definitions of all variables, see Data Definitions.
| Unadjusted |
| Seasonally adjusted |
Questions regarding the Texas Business Outlook Surveys can be addressed to Jesus Cañas at jesus.canas@dal.frb.org.
Sign up for our email alert to be automatically notified as soon as the latest Texas Manufacturing Outlook Survey is released on the web.