Texas Manufacturing Outlook Survey

Texas manufacturing activity slips in September, but production expectations remain solid
For this month’s survey, Texas business executives were asked supplemental questions on wages, prices, outlook concerns and remote work. Results for these questions from the Texas Manufacturing Outlook Survey, Texas Service Sector Outlook Survey and Texas Retail Outlook Survey have been released together. Read the special questions results.
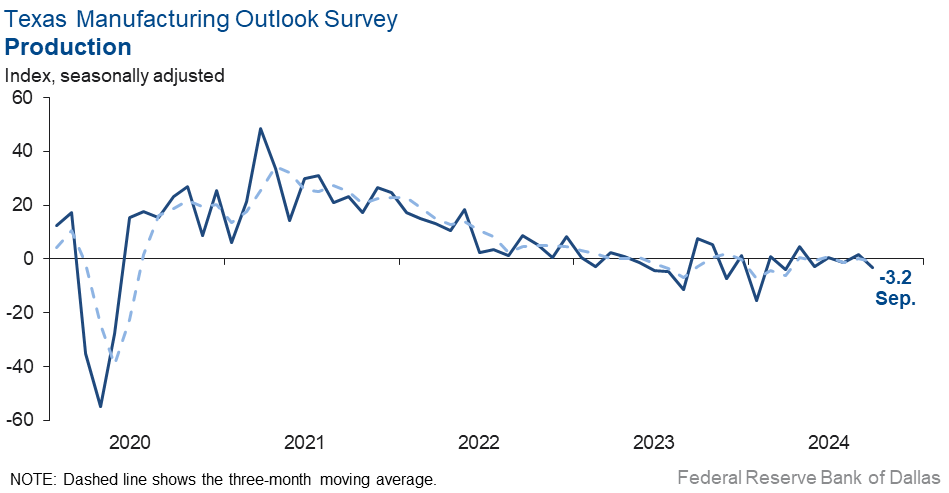
Texas factory activity fell modestly in September, according to business executives responding to the Texas Manufacturing Outlook Survey. The production index, a key measure of state manufacturing conditions, slipped to -3.2, with the negative reading signaling a slight decline in output from August.
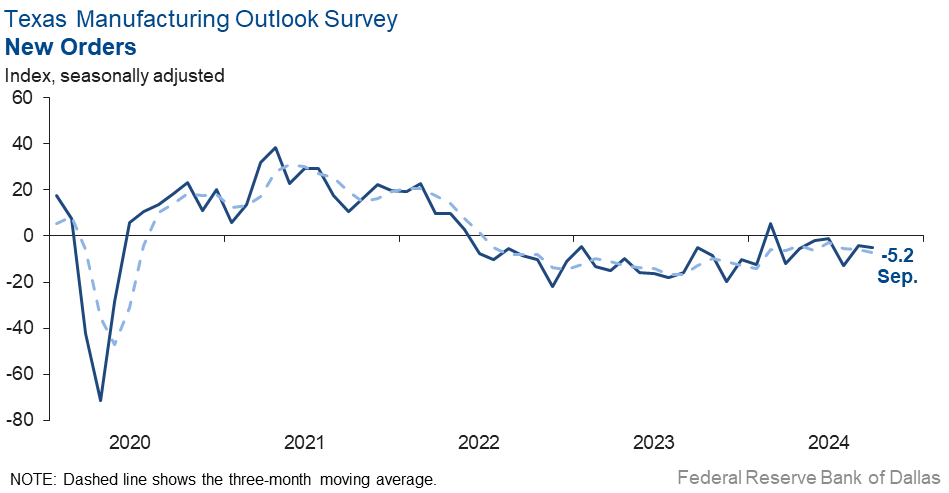
Most other measures of manufacturing activity also indicated declines this month. The new orders index was largely unchanged at -5.2. The capacity utilization index fell five points to -7.0, and the shipments index retreated back into negative territory, falling eight points to -7.0.
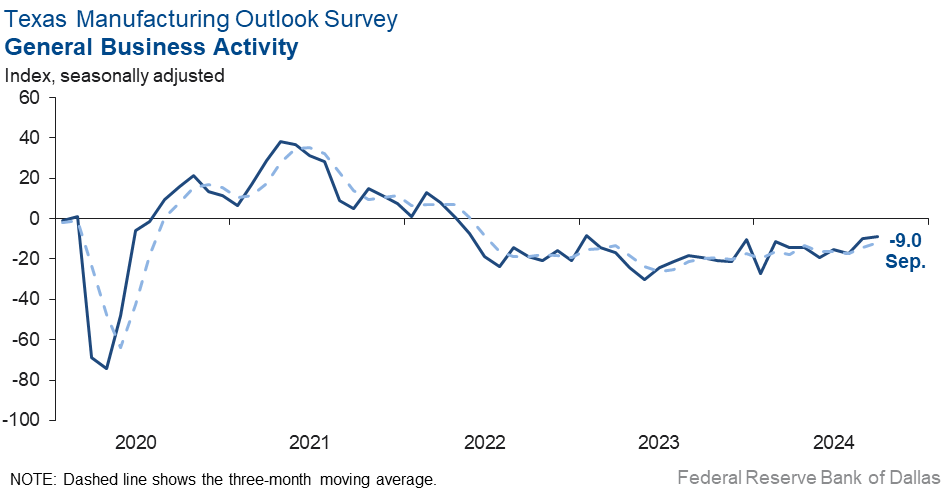
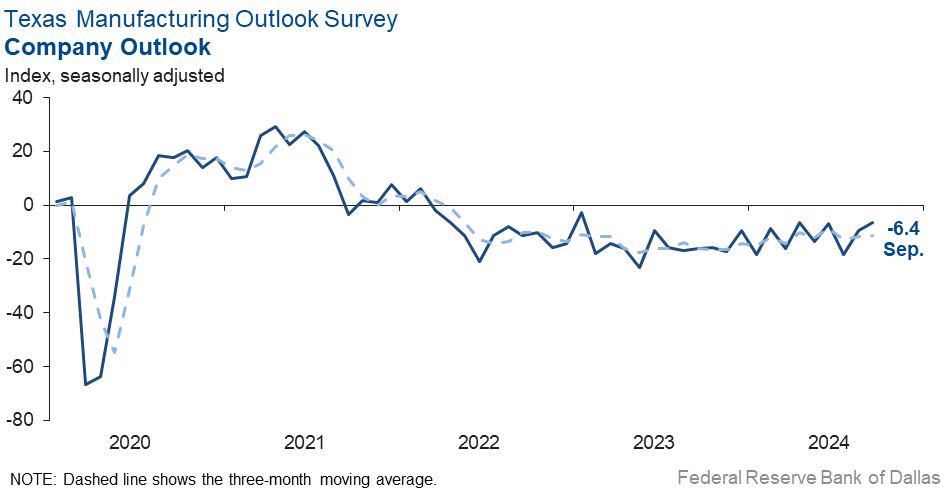
Perceptions of broader business conditions remained negative in September. The general business activity index held fairly steady at -9.0, while the company outlook index stayed negative but inched up three points to -6.4. The outlook uncertainty index spiked 10 points to 17.3.
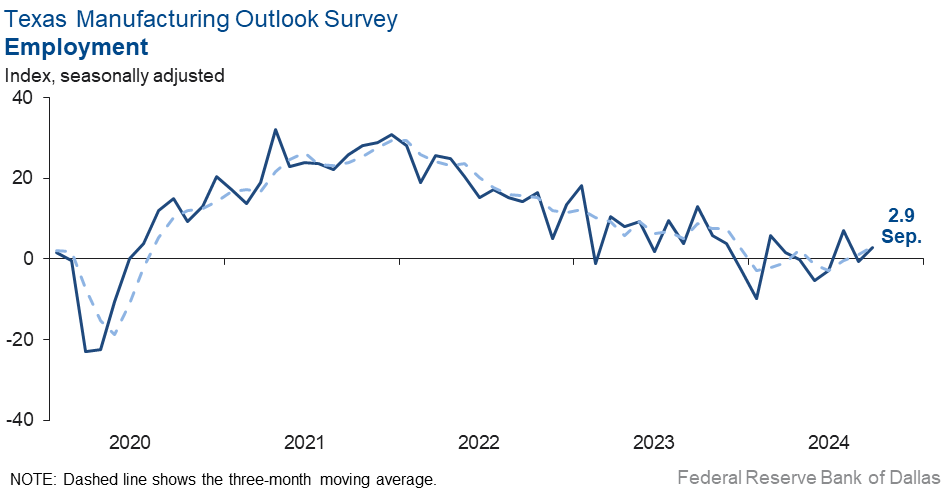
Labor market measures suggested some employment growth but slightly shorter workweeks this month. The employment index moved up four points to 2.9. Twenty percent of firms noted net hiring, while 17 percent noted net layoffs. The hours worked index held steady at -2.5.
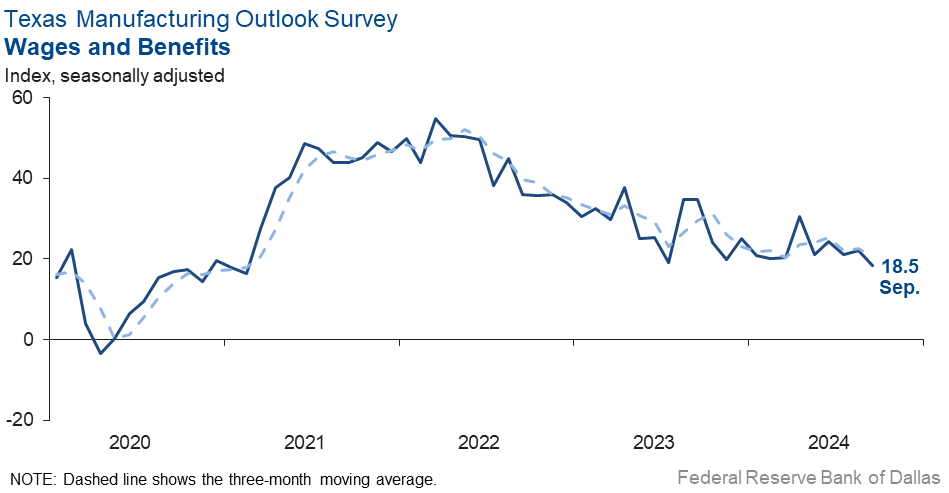
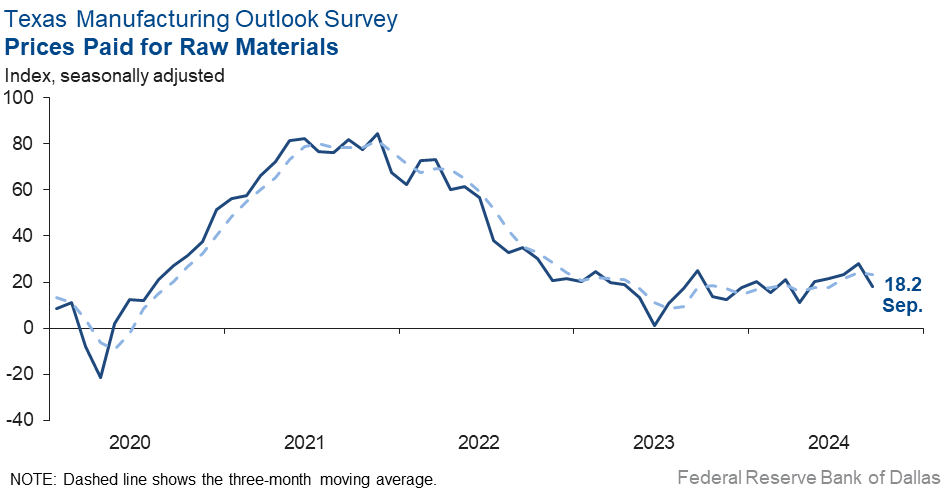
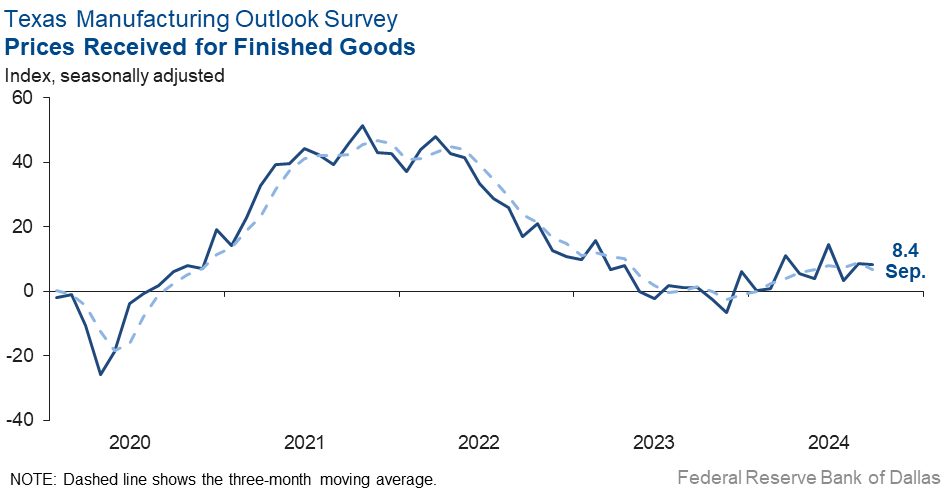
Moderate upward pressure on prices and wages continued in September. The wages and benefits index ticked down to 18.5, a reading roughly in line with the historical average. The raw materials prices index fell 10 points to 18.2, while the finished goods prices index was unchanged at 8.4.
Expectations are for increased manufacturing activity six months from now. The future production index edged up to 35.2, reaching its highest reading since early 2022. The future general business activity held steady at 11.4.
Next release: Monday, October 28
Data were collected Sept. 17–25, and 83 of the 124 Texas manufacturers surveyed submitted a response. The Dallas Fed conducts the Texas Manufacturing Outlook Survey monthly to obtain a timely assessment of the state’s factory activity. Firms are asked whether output, employment, orders, prices and other indicators increased, decreased or remained unchanged over the previous month.
Survey responses are used to calculate an index for each indicator. Each index is calculated by subtracting the percentage of respondents reporting a decrease from the percentage reporting an increase. When the share of firms reporting an increase exceeds the share reporting a decrease, the index will be greater than zero, suggesting the indicator has increased over the prior month. If the share of firms reporting a decrease exceeds the share reporting an increase, the index will be below zero, suggesting the indicator has decreased over the prior month. An index will be zero when the number of firms reporting an increase is equal to the number of firms reporting a decrease. Data have been seasonally adjusted as necessary.
Results summary
Historical data are available from June 2004 to the most current release month.
| Business Indicators Relating to Facilities and Products in Texas Current (versus previous month) | ||||||||
| Indicator | Sep Index | Aug Index | Change | Series Average | Trend* | % Reporting Increase | % Reporting No Change | % Reporting Decrease |
Production | –3.2 | 1.6 | –4.8 | 9.7 | 1(–) | 22.6 | 51.6 | 25.8 |
Capacity Utilization | –7.0 | –2.5 | –4.5 | 7.7 | 5(–) | 18.9 | 55.2 | 25.9 |
New Orders | –5.2 | –4.2 | –1.0 | 5.0 | 7(–) | 23.6 | 47.6 | 28.8 |
Growth Rate of Orders | –8.6 | –5.1 | –3.5 | –0.7 | 5(–) | 20.9 | 49.6 | 29.5 |
Unfilled Orders | –18.0 | 1.0 | –19.0 | –2.3 | 1(–) | 5.7 | 70.6 | 23.7 |
Shipments | –7.0 | 0.8 | –7.8 | 8.0 | 1(–) | 20.9 | 51.2 | 27.9 |
Delivery Time | –7.5 | –1.0 | –6.5 | 0.8 | 18(–) | 9.2 | 74.1 | 16.7 |
Finished Goods Inventories | –3.7 | 6.1 | –9.8 | –3.1 | 1(–) | 18.3 | 59.8 | 22.0 |
Prices Paid for Raw Materials | 18.2 | 28.2 | –10.0 | 27.1 | 53(+) | 23.3 | 71.6 | 5.1 |
Prices Received for Finished Goods | 8.4 | 8.5 | –0.1 | 8.6 | 10(+) | 17.5 | 73.4 | 9.1 |
Wages and Benefits | 18.5 | 22.0 | –3.5 | 21.2 | 53(+) | 18.8 | 80.9 | 0.3 |
Employment | 2.9 | –0.7 | +3.6 | 7.5 | 1(+) | 19.8 | 63.3 | 16.9 |
Hours Worked | –2.5 | –2.6 | +0.1 | 3.2 | 12(–) | 12.0 | 73.5 | 14.5 |
Capital Expenditures | 11.9 | 15.7 | –3.8 | 6.6 | 12(+) | 21.6 | 68.7 | 9.7 |
| General Business Conditions Current (versus previous month) | ||||||||
| Indicator | Sep Index | Aug Index | Change | Series Average | Trend** | % Reporting Improved | % Reporting No Change | % Reporting Worsened |
Company Outlook | –6.4 | –9.6 | +3.2 | 4.4 | 31(–) | 10.6 | 72.4 | 17.0 |
General Business Activity | –9.0 | –9.7 | +0.7 | 0.7 | 29(–) | 9.9 | 71.2 | 18.9 |
| Indicator | Sep Index | Aug Index | Change | Series Average | Trend* | % Reporting Increase | % Reporting No Change | % Reporting Decrease |
Outlook Uncertainty | 17.3 | 7.5 | +9.8 | 17.1 | 41(+) | 24.7 | 67.9 | 7.4 |
| Business Indicators Relating to Facilities and Products in Texas Future (six months ahead) | ||||||||
| Indicator | Sep Index | Aug Index | Change | Series Average | Trend* | % Reporting Increase | % Reporting No Change | % Reporting Decrease |
Production | 35.2 | 33.7 | +1.5 | 36.2 | 53(+) | 42.3 | 50.6 | 7.1 |
Capacity Utilization | 35.3 | 32.9 | +2.4 | 33.1 | 53(+) | 40.5 | 54.3 | 5.2 |
New Orders | 33.3 | 30.7 | +2.6 | 33.6 | 23(+) | 40.3 | 52.7 | 7.0 |
Growth Rate of Orders | 28.9 | 17.7 | +11.2 | 24.8 | 16(+) | 34.2 | 60.5 | 5.3 |
Unfilled Orders | 1.7 | 7.0 | –5.3 | 2.8 | 2(+) | 10.1 | 81.5 | 8.4 |
Shipments | 28.8 | 30.1 | –1.3 | 34.6 | 53(+) | 38.0 | 52.8 | 9.2 |
Delivery Time | 10.7 | 4.5 | +6.2 | –1.4 | 3(+) | 16.9 | 76.9 | 6.2 |
Finished Goods Inventories | –5.0 | 3.9 | –8.9 | –0.1 | 1(–) | 11.3 | 72.5 | 16.3 |
Prices Paid for Raw Materials | 26.5 | 25.2 | +1.3 | 33.3 | 54(+) | 31.2 | 64.1 | 4.7 |
Prices Received for Finished Goods | 17.5 | 21.2 | –3.7 | 20.8 | 53(+) | 21.3 | 75.0 | 3.8 |
Wages and Benefits | 41.9 | 38.1 | +3.8 | 39.3 | 244(+) | 42.1 | 57.7 | 0.2 |
Employment | 19.0 | 22.0 | –3.0 | 22.8 | 52(+) | 26.3 | 66.4 | 7.3 |
Hours Worked | 4.1 | 9.2 | –5.1 | 8.8 | 6(+) | 12.4 | 79.3 | 8.3 |
Capital Expenditures | 23.3 | 20.0 | +3.3 | 19.4 | 52(+) | 30.2 | 62.9 | 6.9 |
| General Business Conditions Future (six months ahead) | ||||||||
| Indicator | Sep Index | Aug Index | Change | Series Average | Trend** | % Reporting Increase | % Reporting No Change | % Reporting Worsened |
Company Outlook | 11.1 | 18.5 | –7.4 | 18.2 | 10(+) | 22.7 | 65.7 | 11.6 |
General Business Activity | 11.4 | 11.6 | –0.2 | 12.2 | 4(+) | 24.6 | 62.2 | 13.2 |
*Shown is the number of consecutive months of expansion or contraction in the underlying indicator. Expansion is indicated by a positive index reading and denoted by a (+) in the table. Contraction is indicated by a negative index reading and denoted by a (–) in the table.
**Shown is the number of consecutive months of improvement or worsening in the underlying indicator. Improvement is indicated by a positive index reading and denoted by a (+) in the table. Worsening is indicated by a negative index reading and denoted by a (–) in the table.
Data have been seasonally adjusted as necessary.
Comments from survey respondents
These comments are from respondents’ completed surveys and have been edited for publication.
- Increased imports [is an issue affecting our business].
- Regulation [is an issue affecting our business].
- We are seeing signals of the market inflecting up, but near-term, things remain muted.
- We look at the possibility of a [Kamala] Harris administration with great concern. It will almost certainly lead to a reduction in our general business activity. We sell into many industries, so while "green" industries will be favored, we expect others (e.g., oil and gas) to be politically disfavored, leading to reduced investment.
- Our system business has slowed, while our shop work is very strong. We usually see large system work hold or decline in an election year.
- Now that the Federal Reserve has started to lower interest rates, I feel better about the overall direction of the economy. After the presidential election, we will have a clearer perspective of what to expect in the next six to 18 months. Now, what will happen with oil and the Middle East?
- Interest rates coming down is having a positive impact on capital expenditure and interest payments.
- Business remains slow, which will hopefully change after the election.
- The reality of a Democrat victory is disconcerting for our customer base who have a legitimate fear of declining business conditions going forward. That jeopardizes our forecast and opportunities for success. It's been quite a while since our customers' sentiment has been this negative.
- Improvements are only due to a new product line introduced. We have not seen any business or industry improvements.
- We saw a slight uptick in activity from last month. This was before the interest rate movement.
- We are using capital expenditures to add new product offerings to offset dwindling legacy product. Oil and gas product demand is shrinking.
- All of the major markets we sell into continue to trend downward. That includes transportation and building/construction.
- September will be slower with less billing than August, which is a drag as it's the last month of this fiscal year. We have been feeling the slowness in estimating for a couple of months, and now we are seeing the results. We are optimistic that six months from now we will see better times, especially after the election.
- The outlook is totally controlled by the November election.
- We are seeing constraint from large customers being practiced, [with them] only ordering what's needed immediately, not providing forecasts and not sharing insight. Major customers have been impacted by cyberattacks and ransomware incidents, shutting down operations in August and September.
- We are tied to the trucking/transportation industry. The market continues to soften, with fleets holding onto cash. All other suppliers to the market are seeing the same thing. Overall, the market is down 50 percent year over year.
Historical Data
Historical data can be downloaded dating back to June 2004.
Indexes
Download indexes for all indicators. For the definitions of all variables, see Data Definitions.
| Unadjusted |
| Seasonally adjusted |
All Data
Download indexes and components of the indexes (percentage of respondents reporting increase, decrease, or no change). For the definitions of all variables, see Data Definitions.
| Unadjusted |
| Seasonally adjusted |
Questions regarding the Texas Business Outlook Surveys can be addressed to Emily Kerr at emily.kerr@dal.frb.org.
Sign up for our email alert to be automatically notified as soon as the latest Texas Manufacturing Outlook Survey is released on the web.