Texas Manufacturing Outlook Survey

Texas manufacturing activity grows in December
For this month’s survey, Texas business executives were asked supplemental questions on wages, prices, outlook concerns and potentially higher tariffs in 2025. Results for these questions from the Texas Manufacturing Outlook Survey, Texas Service Sector Outlook Survey and Texas Retail Outlook Survey have been released together. Read the special questions results.
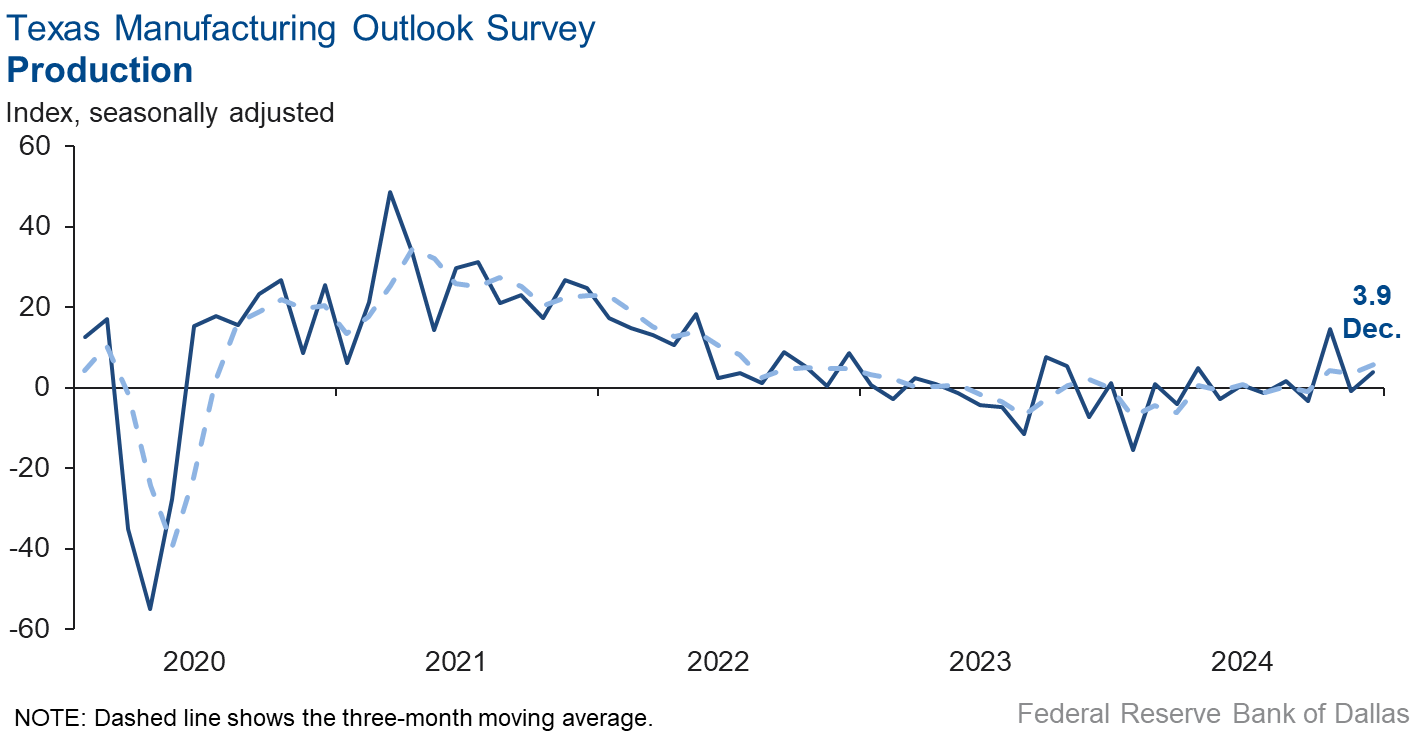
Texas factory activity increased in December, according to business executives responding to the Texas Manufacturing Outlook Survey. The production index, a key measure of state manufacturing conditions, rose to 3.9 from a near-zero reading last month.
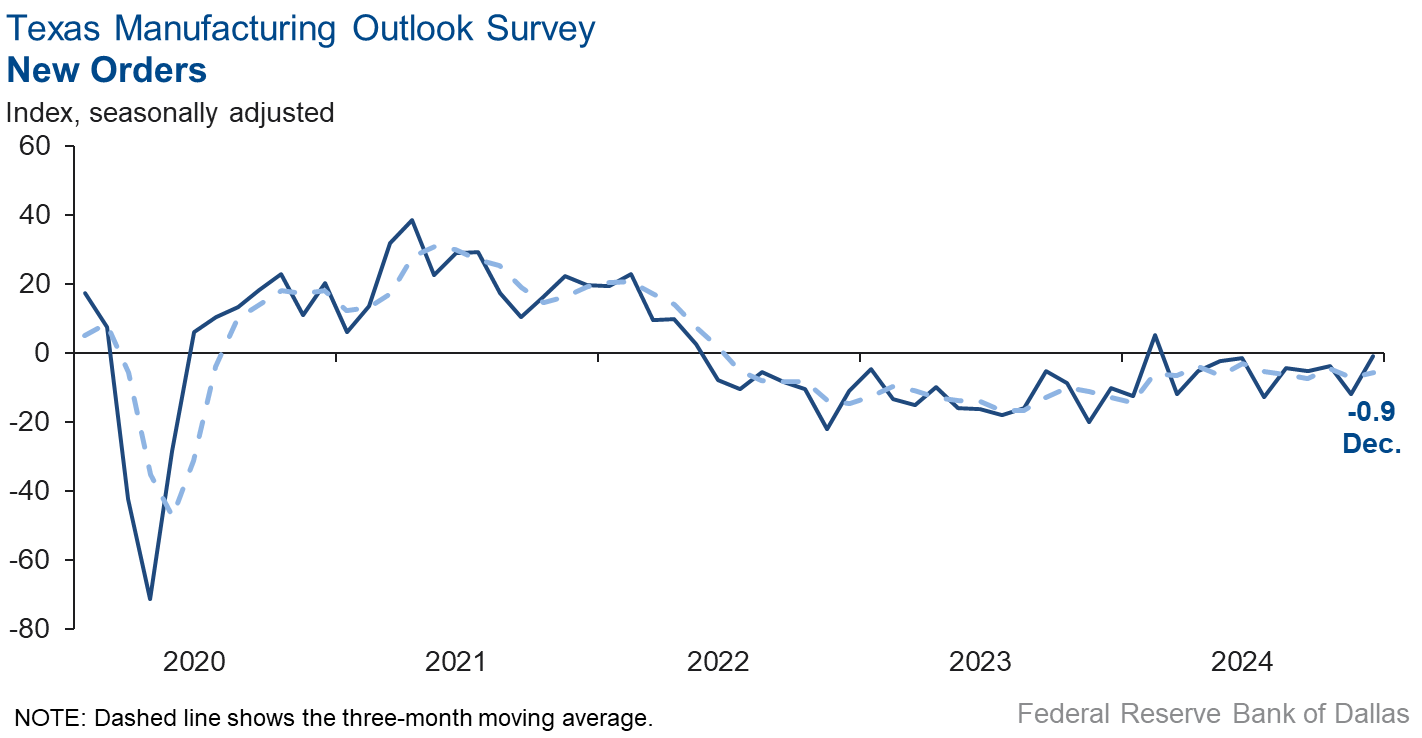
Other measures of manufacturing activity were mixed. The new orders index shot up 11 points to -0.9, suggesting demand was unchanged from November. The capacity utilization and shipments indexes both edged up but remained in negative territory, coming in at -2.5 and -2.0, respectively.
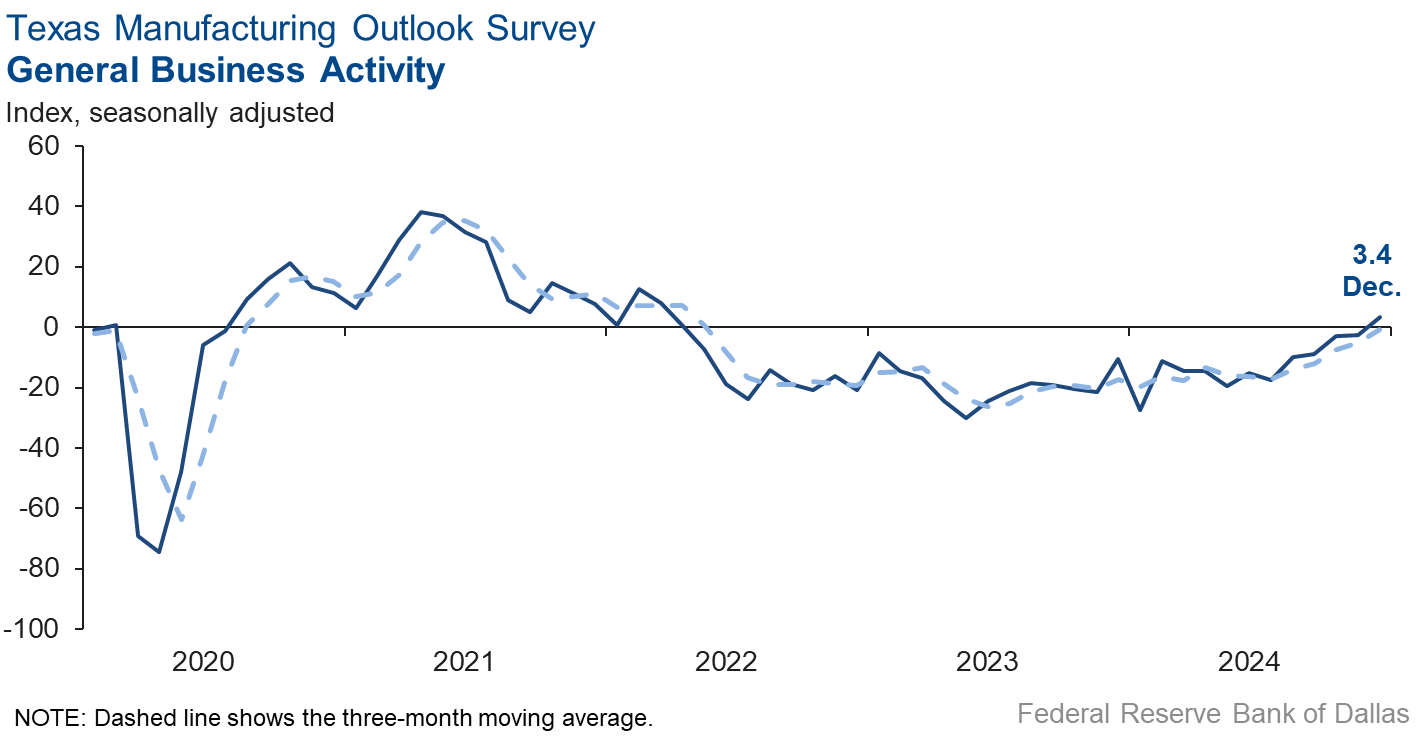
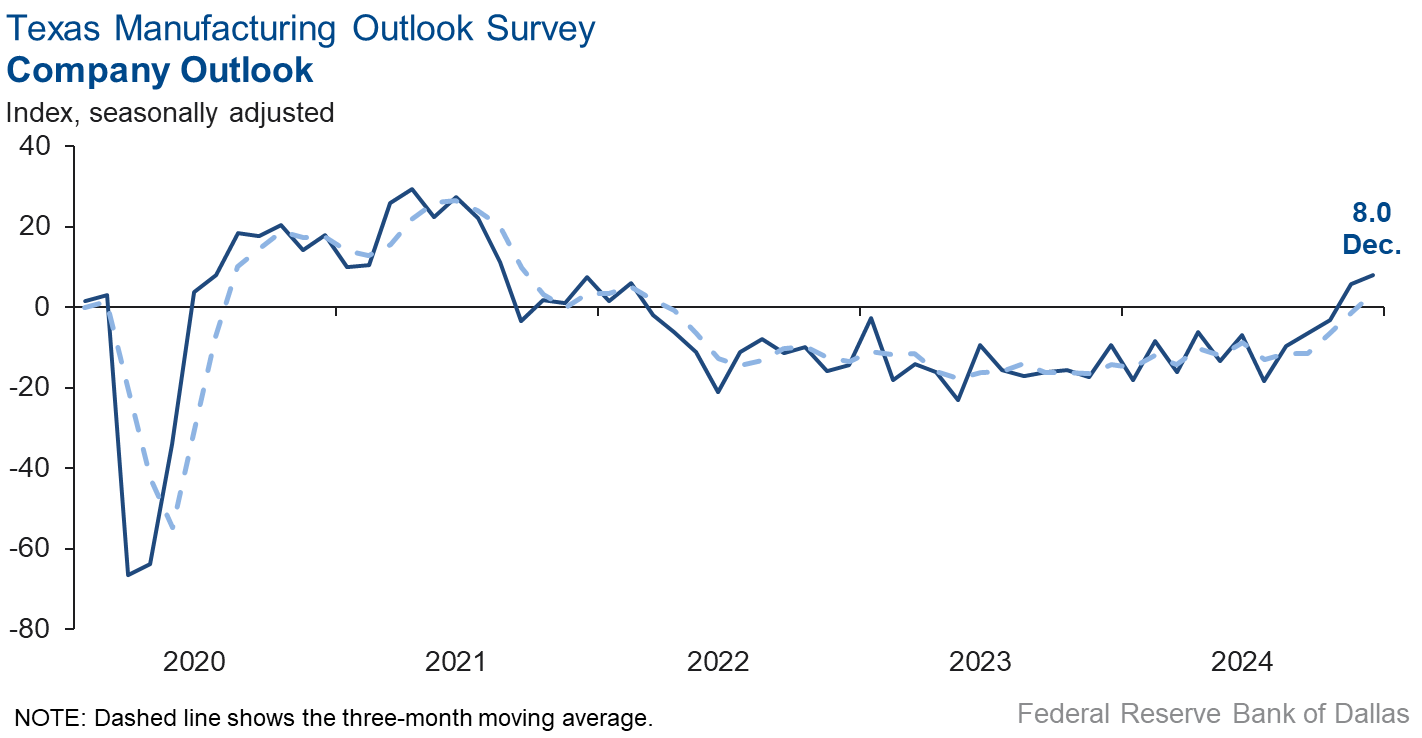
Perceptions of broader business conditions improved in December. The general business activity index moved up six points to 3.4, its first positive reading since April 2022. The company outlook index was positive for the second consecutive month, increasing slightly to 8.0. The outlook uncertainty index fell five points to 1.2.
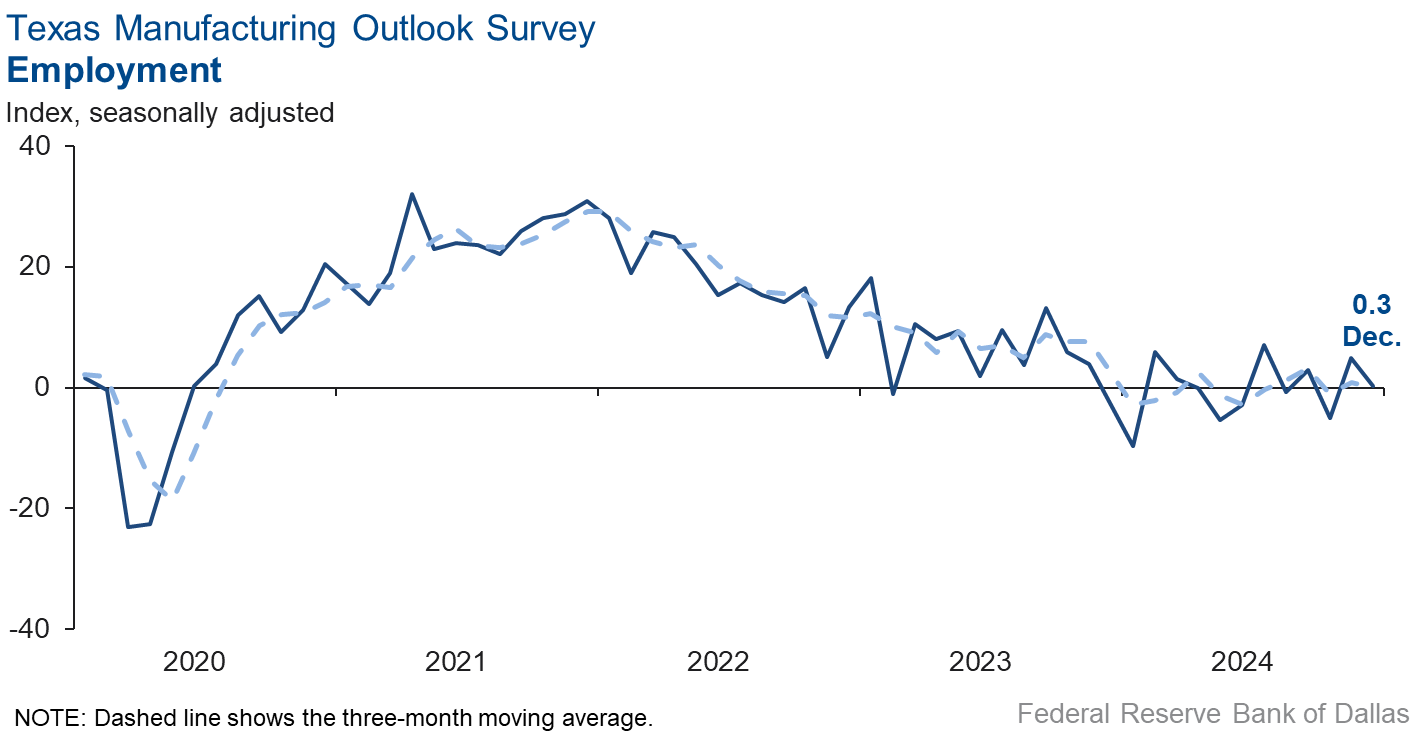
Labor market measures suggested employment and workweeks held steady this month. The employment index fell five points to zero. Sixteen percent of firms noted net hiring, the same proportion that noted net layoffs. The hours worked index held steady at a near-zero reading, indicative of no change in workweek length from November.
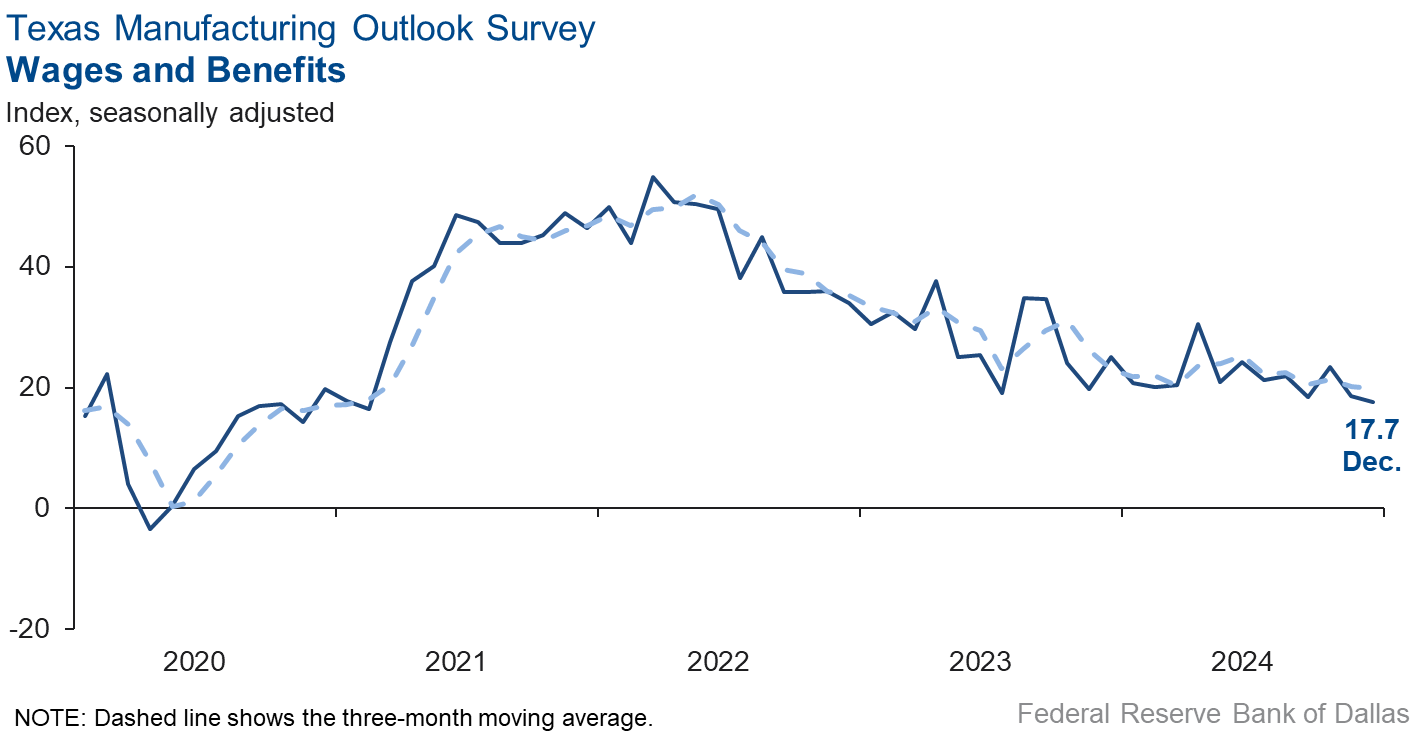
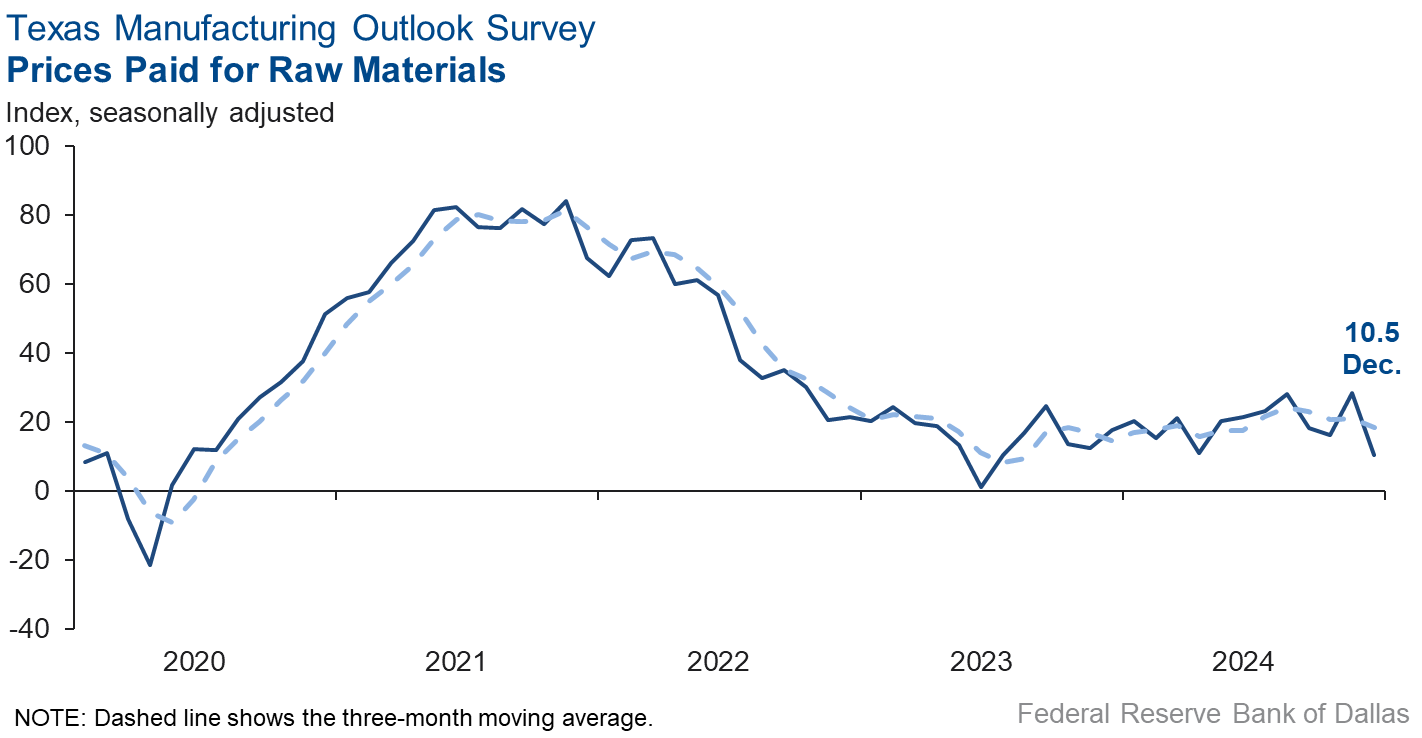
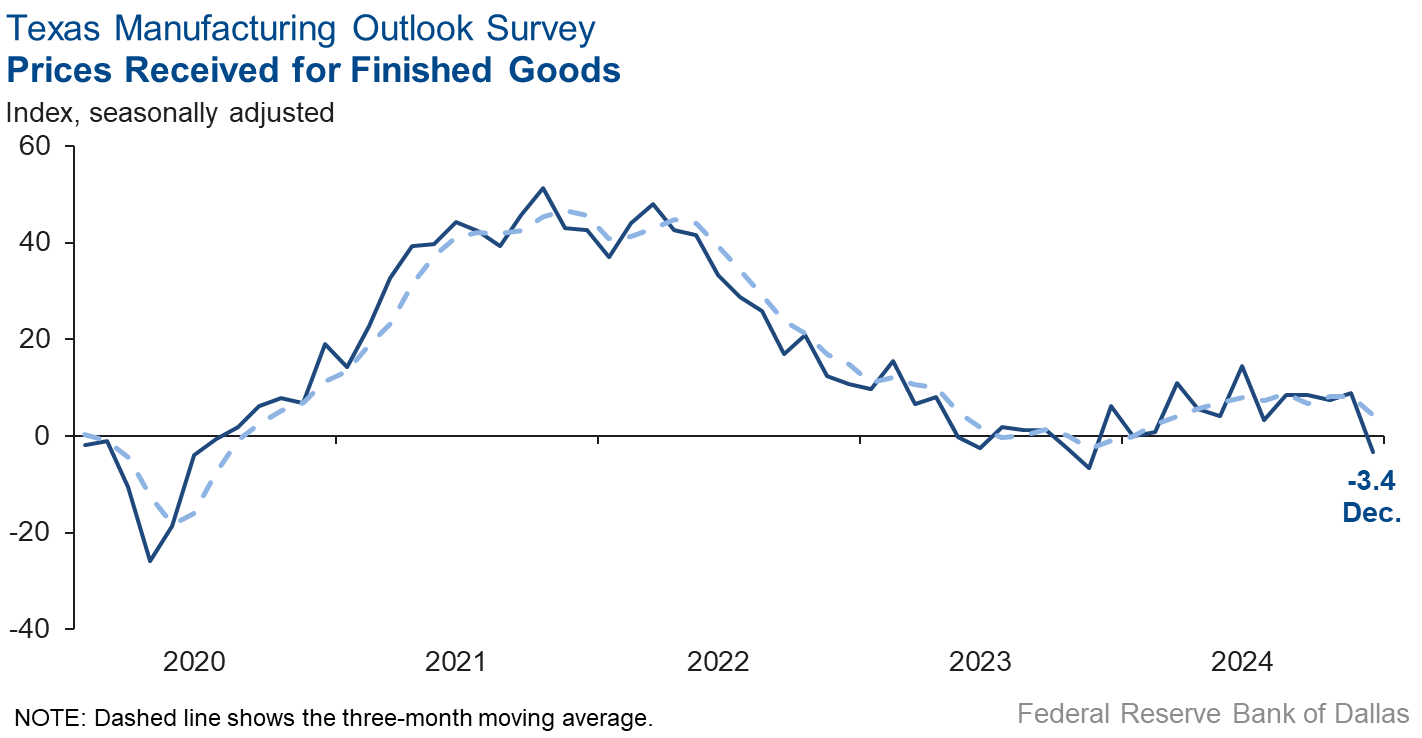
Upward pressure on raw material prices eased this month. Selling prices dropped, and wages rose moderately. The raw materials prices index plunged 18 points to 10.5, its lowest reading in 17 months. The finished goods prices index also dropped, falling 12 points to -3.4, its first negative reading since late 2023. The wages and benefits index was 17.7, similar to November.
Expectations are for increased manufacturing activity six months from now. The future production index remained positive but decreased to 32.7 from 44.0, with 44 percent of firms expecting an increase in production six months from now. The future general business activity index fell to 20.6 from 31.2. Other indexes of future manufacturing activity retreated this month but remained positive.
Next release: Monday, January 27
Data were collected Dec. 17–25, and 87 of the 122 Texas manufacturers surveyed submitted a response. The Dallas Fed conducts the Texas Manufacturing Outlook Survey monthly to obtain a timely assessment of the state’s factory activity. Firms are asked whether output, employment, orders, prices and other indicators increased, decreased or remained unchanged over the previous month.
Survey responses are used to calculate an index for each indicator. Each index is calculated by subtracting the percentage of respondents reporting a decrease from the percentage reporting an increase. When the share of firms reporting an increase exceeds the share reporting a decrease, the index will be greater than zero, suggesting the indicator has increased over the prior month. If the share of firms reporting a decrease exceeds the share reporting an increase, the index will be below zero, suggesting the indicator has decreased over the prior month. An index will be zero when the number of firms reporting an increase is equal to the number of firms reporting a decrease. Data have been seasonally adjusted as necessary.
Results summary
Historical data are available from June 2004 to the most current release month.
| Business Indicators Relating to Facilities and Products in Texas Current (versus previous month) | ||||||||
| Indicator | Dec Index | Nov Index | Change | Series Average | Trend* | % Reporting Increase | % Reporting No Change | % Reporting Decrease |
Production | 3.9 | –0.9 | +4.8 | 9.7 | 1(+) | 30.5 | 43.0 | 26.6 |
Capacity Utilization | –2.5 | –4.8 | +2.3 | 7.6 | 2(–) | 23.8 | 49.9 | 26.3 |
New Orders | –0.9 | –11.9 | +11.0 | 4.9 | 10(–) | 28.1 | 42.9 | 29.0 |
Growth Rate of Orders | –3.8 | –12.5 | +8.7 | –0.9 | 8(–) | 22.3 | 51.6 | 26.1 |
Unfilled Orders | –7.4 | –14.1 | +6.7 | –2.4 | 4(–) | 8.9 | 74.8 | 16.3 |
Shipments | –2.0 | –5.9 | +3.9 | 7.9 | 2(–) | 29.1 | 39.8 | 31.1 |
Delivery Time | –2.1 | –5.2 | +3.1 | 0.8 | 21(–) | 9.7 | 78.5 | 11.8 |
Finished Goods Inventories | 1.1 | –14.1 | +15.2 | –3.2 | 1(+) | 19.0 | 63.1 | 17.9 |
Prices Paid for Raw Materials | 10.5 | 28.5 | –18.0 | 27.0 | 56(+) | 21.6 | 67.3 | 11.1 |
Prices Received for Finished Goods | –3.4 | 8.8 | –12.2 | 8.6 | 1(–) | 10.3 | 76.0 | 13.7 |
Wages and Benefits | 17.7 | 18.6 | –0.9 | 21.2 | 56(+) | 21.3 | 75.1 | 3.6 |
Employment | 0.3 | 4.9 | –4.6 | 7.4 | 2(+) | 16.1 | 68.1 | 15.8 |
Hours Worked | –0.9 | 0.3 | –1.2 | 3.1 | 1(–) | 14.5 | 70.1 | 15.4 |
Capital Expenditures | 11.2 | 7.8 | +3.4 | 6.6 | 15(+) | 22.6 | 66.0 | 11.4 |
| General Business Conditions Current (versus previous month) | ||||||||
| Indicator | Dec Index | Nov Index | Change | Series Average | Trend** | % Reporting Improved | % Reporting No Change | % Reporting Worsened |
Company Outlook | 8.0 | 5.8 | +2.2 | 4.4 | 2(+) | 24.5 | 59.0 | 16.5 |
General Business Activity | 3.4 | –2.7 | +6.1 | 0.7 | 1(+) | 21.2 | 61.0 | 17.8 |
| Indicator | Dec Index | Nov Index | Change | Series Average | Trend* | % Reporting Increase | % Reporting No Change | % Reporting Decrease |
Outlook Uncertainty | 1.2 | 5.9 | –4.7 | 16.8 | 44(+) | 22.6 | 56.0 | 21.4 |
| Business Indicators Relating to Facilities and Products in Texas Future (six months ahead) | ||||||||
| Indicator | Dec Index | Nov Index | Change | Series Average | Trend* | % Reporting Increase | % Reporting No Change | % Reporting Decrease |
Production | 32.7 | 44.0 | –11.3 | 36.3 | 56(+) | 43.9 | 44.9 | 11.2 |
Capacity Utilization | 33.6 | 35.2 | –1.6 | 33.2 | 56(+) | 42.2 | 49.3 | 8.6 |
New Orders | 35.4 | 44.9 | –9.5 | 33.7 | 26(+) | 42.8 | 49.7 | 7.4 |
Growth Rate of Orders | 27.0 | 36.8 | –9.8 | 24.9 | 19(+) | 34.4 | 58.2 | 7.4 |
Unfilled Orders | 0.9 | 10.2 | –9.3 | 2.8 | 5(+) | 8.9 | 83.1 | 8.0 |
Shipments | 33.7 | 37.8 | –4.1 | 34.7 | 56(+) | 42.3 | 49.2 | 8.6 |
Delivery Time | 1.8 | –3.7 | +5.5 | –1.3 | 1(+) | 7.7 | 86.4 | 5.9 |
Finished Goods Inventories | –1.3 | –5.1 | +3.8 | –0.1 | 4(–) | 12.3 | 74.1 | 13.6 |
Prices Paid for Raw Materials | 25.9 | 32.5 | –6.6 | 33.3 | 57(+) | 36.8 | 52.3 | 10.9 |
Prices Received for Finished Goods | 25.9 | 27.8 | –1.9 | 20.8 | 56(+) | 32.1 | 61.7 | 6.2 |
Wages and Benefits | 39.0 | 41.7 | –2.7 | 39.3 | 247(+) | 41.9 | 55.2 | 2.9 |
Employment | 28.2 | 25.3 | +2.9 | 22.9 | 55(+) | 32.4 | 63.4 | 4.2 |
Hours Worked | 11.4 | 11.5 | –0.1 | 8.8 | 9(+) | 21.4 | 68.6 | 10.0 |
Capital Expenditures | 22.2 | 13.2 | +9.0 | 19.4 | 55(+) | 27.7 | 66.8 | 5.5 |
| General Business Conditions Future (six months ahead) | ||||||||
| Indicator | Dec Index | Nov Index | Change | Series Average | Trend** | % Reporting Increase | % Reporting No Change | % Reporting Worsened |
Company Outlook | 18.8 | 36.3 | –17.5 | 18.4 | 13(+) | 29.8 | 59.2 | 11.0 |
General Business Activity | 20.6 | 31.2 | –10.6 | 12.4 | 7(+) | 33.2 | 54.2 | 12.6 |
*Shown is the number of consecutive months of expansion or contraction in the underlying indicator. Expansion is indicated by a positive index reading and denoted by a (+) in the table. Contraction is indicated by a negative index reading and denoted by a (–) in the table.
**Shown is the number of consecutive months of improvement or worsening in the underlying indicator. Improvement is indicated by a positive index reading and denoted by a (+) in the table. Worsening is indicated by a negative index reading and denoted by a (–) in the table.
Data have been seasonally adjusted as necessary.
Comments from survey respondents
These comments are from respondents’ completed surveys and have been edited for publication.
- Widespread tariff risks are causing significant change in our business and a potential loss of orders. This has increased uncertainty.
- We are hopeful for better sales activity starting first quarter 2025. We are hoping for interest rates to drop to at least 1.5 percent so the capital equipment industry starts moving product from inventory.
- Overall, we remain in slow and steady growth mode as we transition to a service provider.
- Backlog has decreased but RFQs (requests for quote) have remained steady. It appears some owners and contractors are holding off until there is clarity from the new administration.
- Talk of tariffs on imported materials and ingredients is a big uncertainty generator for our operations.
- We are worried about tariffs and if there would be an impact on us or not.
- December customer sales looked normal, but Dec. 9–13 several customers (food distributors) placed large orders for delivery in December. This resulted in us having to work every day until Christmas.
- Our scenario is made more complex by our dependence on the farm bill as well as private label/sector sales. Discretionary funding to humanitarian food outlets has decreased as has their cash flow. The politicization of food relief has had an impact on our production. The demand for our product is infinite. Aside from these inherent factors, I remain baffled as to why the Federal Reserve keeps cutting rates while inflation increases.
- We are already seeing the effects of the election result in increased business activity. We are much more optimistic about our industry's future.
- We're quoting again! We can see the light at the end of the tunnel. We're expecting quotes to turn into orders in January and the next six months. It's encouraging; it's a breath of fresh air; it's a general attitude change in the marketplace; and it's what we've been hanging on for over the last 18–24 months.
- We look forward to creating new jobs, improving energy security and reducing the trade deficit.
- Things are looking good for domestic business, but we are concerned about international trade and supply disruption with geopolitical conflict and trade concerns.
- A major raw material (paper) increase was announced for January/February.
- Tariffs are a concern. Particularly the ones on goods from Mexico are the biggest existential threat to this business in its 70 years. Additionally, general uncertainty will not only hurt our macro industry but also our individual customers and businesses. While there will be some who profit from the uncertainty, Main Street will suffer.
- Our industry coalition recently lost an unfair trade case against 14 foreign countries under questionable circumstances. We have filed an appeal, but a decision is still pending. The case involves allegations that these 14 countries are engaging in dumping practices, with four of them receiving government subsidies to export products to the U.S. at artificially low prices. These unfair practices continue to undermine the market, threatening thousands of American jobs and leading to the potential closure of domestic factories.
- It’s a very odd month as we are very slow and struggling to get shop-floor employees hours. Hopefully, things will continue to improve in that regard. We have seen some pickup in incoming orders, but these don't arrive until next month.
Historical Data
Historical data can be downloaded dating back to June 2004.
Indexes
Download indexes for all indicators. For the definitions of all variables, see Data Definitions.
| Unadjusted |
| Seasonally adjusted |
All Data
Download indexes and components of the indexes (percentage of respondents reporting increase, decrease, or no change). For the definitions of all variables, see Data Definitions.
| Unadjusted |
| Seasonally adjusted |
Questions regarding the Texas Business Outlook Surveys can be addressed to Emily Kerr at emily.kerr@dal.frb.org.
Sign up for our email alert to be automatically notified as soon as the latest Texas Manufacturing Outlook Survey is released on the web.