Texas Manufacturing Outlook Survey

Texas manufacturing production flat, new orders fall
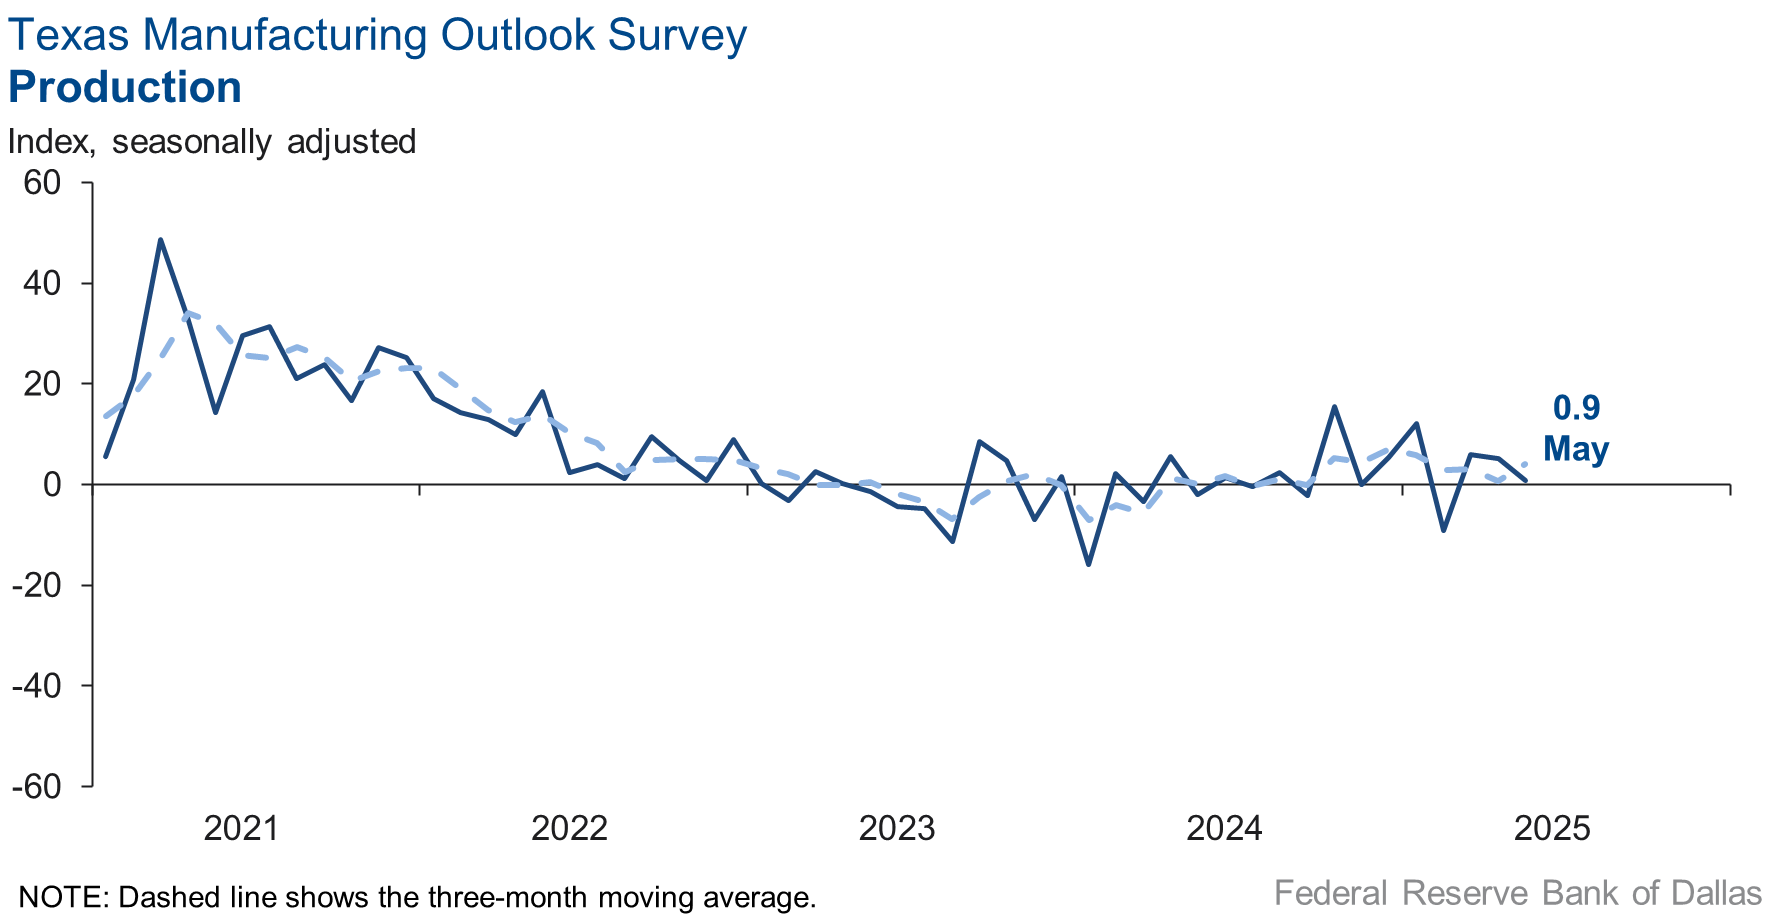
Texas factory activity held steady in May, according to business executives responding to the Texas Manufacturing Outlook Survey. The production index, a key measure of state manufacturing conditions, retreated four points to a near-zero reading, indicating flat output this month after modest growth in March and April.
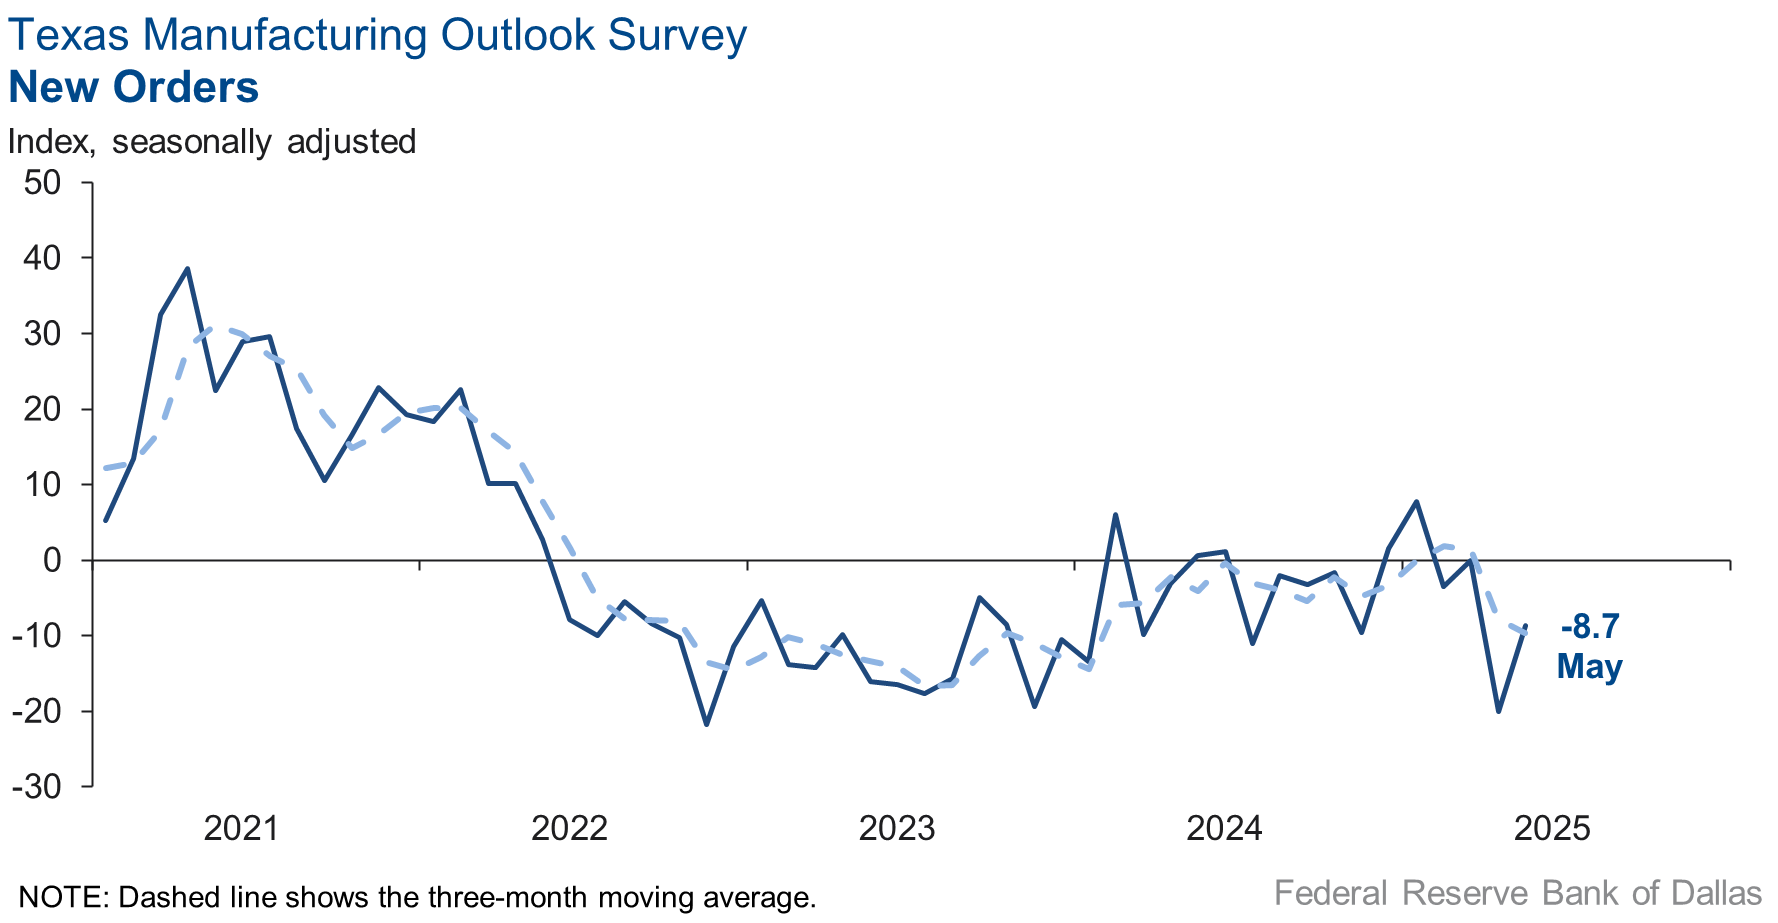
Other measures of manufacturing activity moved up, but some remained in contractionary territory. The new orders index remained negative, signaling contraction, but rose to -8.7 from -20.0. The capacity utilization index also stayed negative but edged up to -1.5. Meanwhile, the shipments index rebounded into positive territory after dipping negative last month, coming in at 0.5.
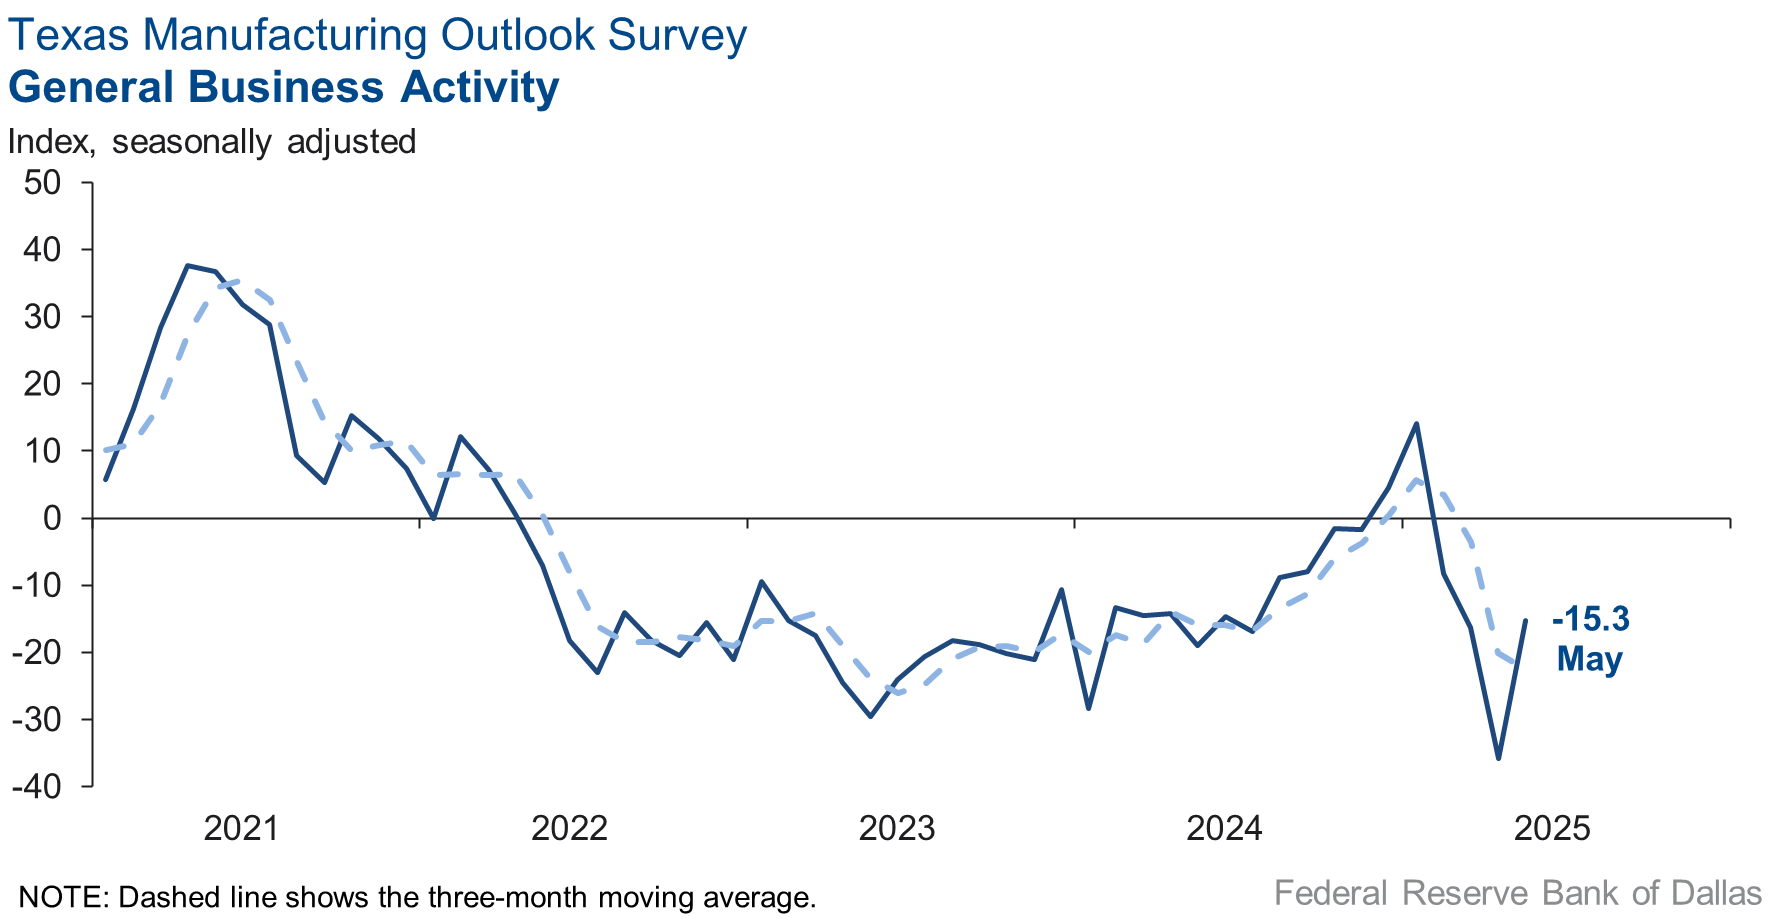
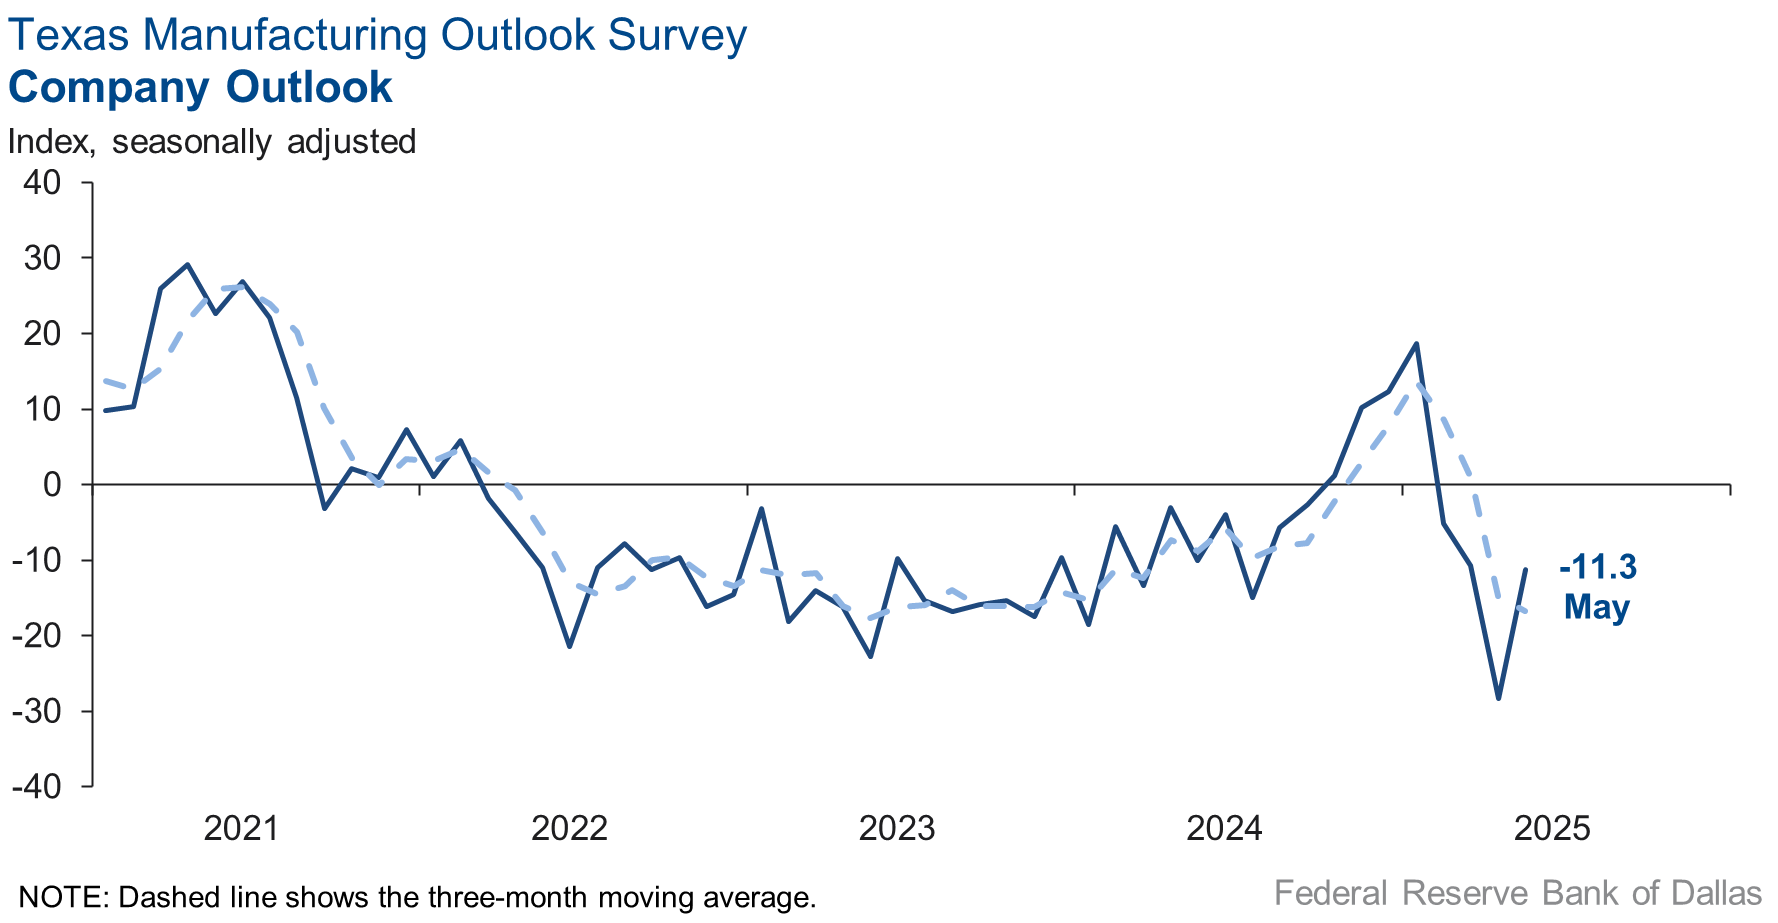
Perceptions of broader business conditions continued to worsen in May, though the indexes were less negative than last month. The general business activity index pushed up 21 points to -15.3. The company outlook index also remained negative but moved up, climbing to -11.3 from -28.3. The outlook uncertainty index retreated 34 points to 12.7, suggesting uncertainty continued to rise but not as notably as in April.
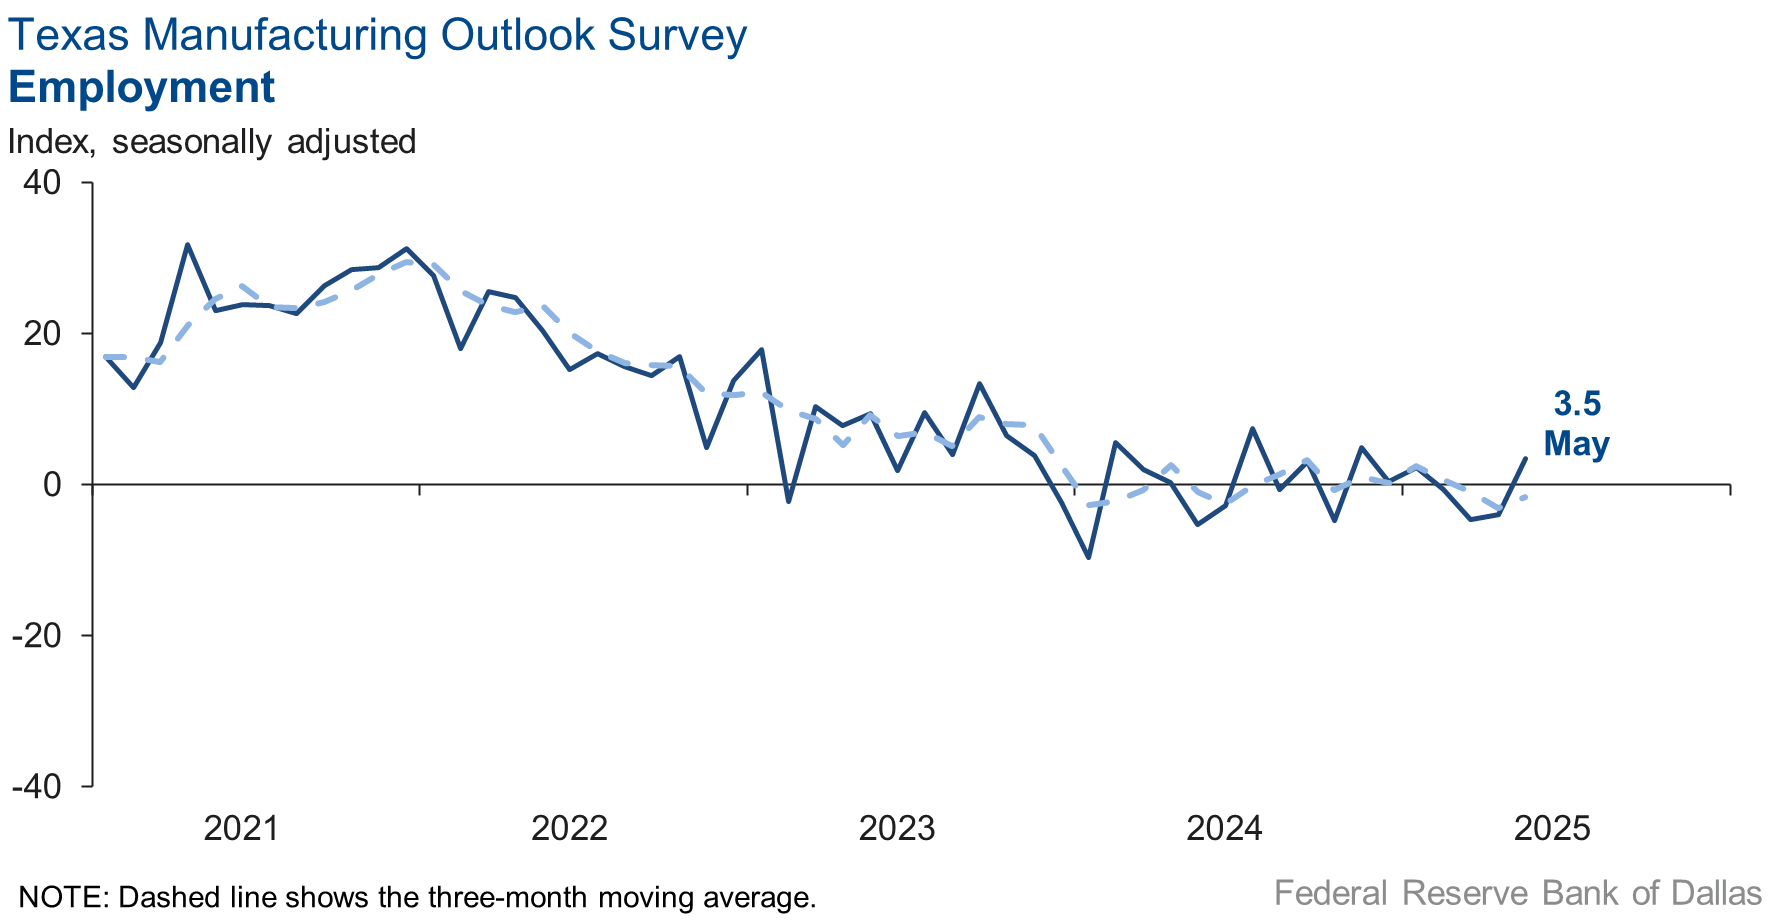
Labor market measures suggested a slight increase in head counts and shorter workweeks this month. The employment index moved up seven points to 3.5, with 12 percent of firms noting net hiring and 8 percent noting net layoffs. The hours worked index remained negative but ticked up to -3.6.
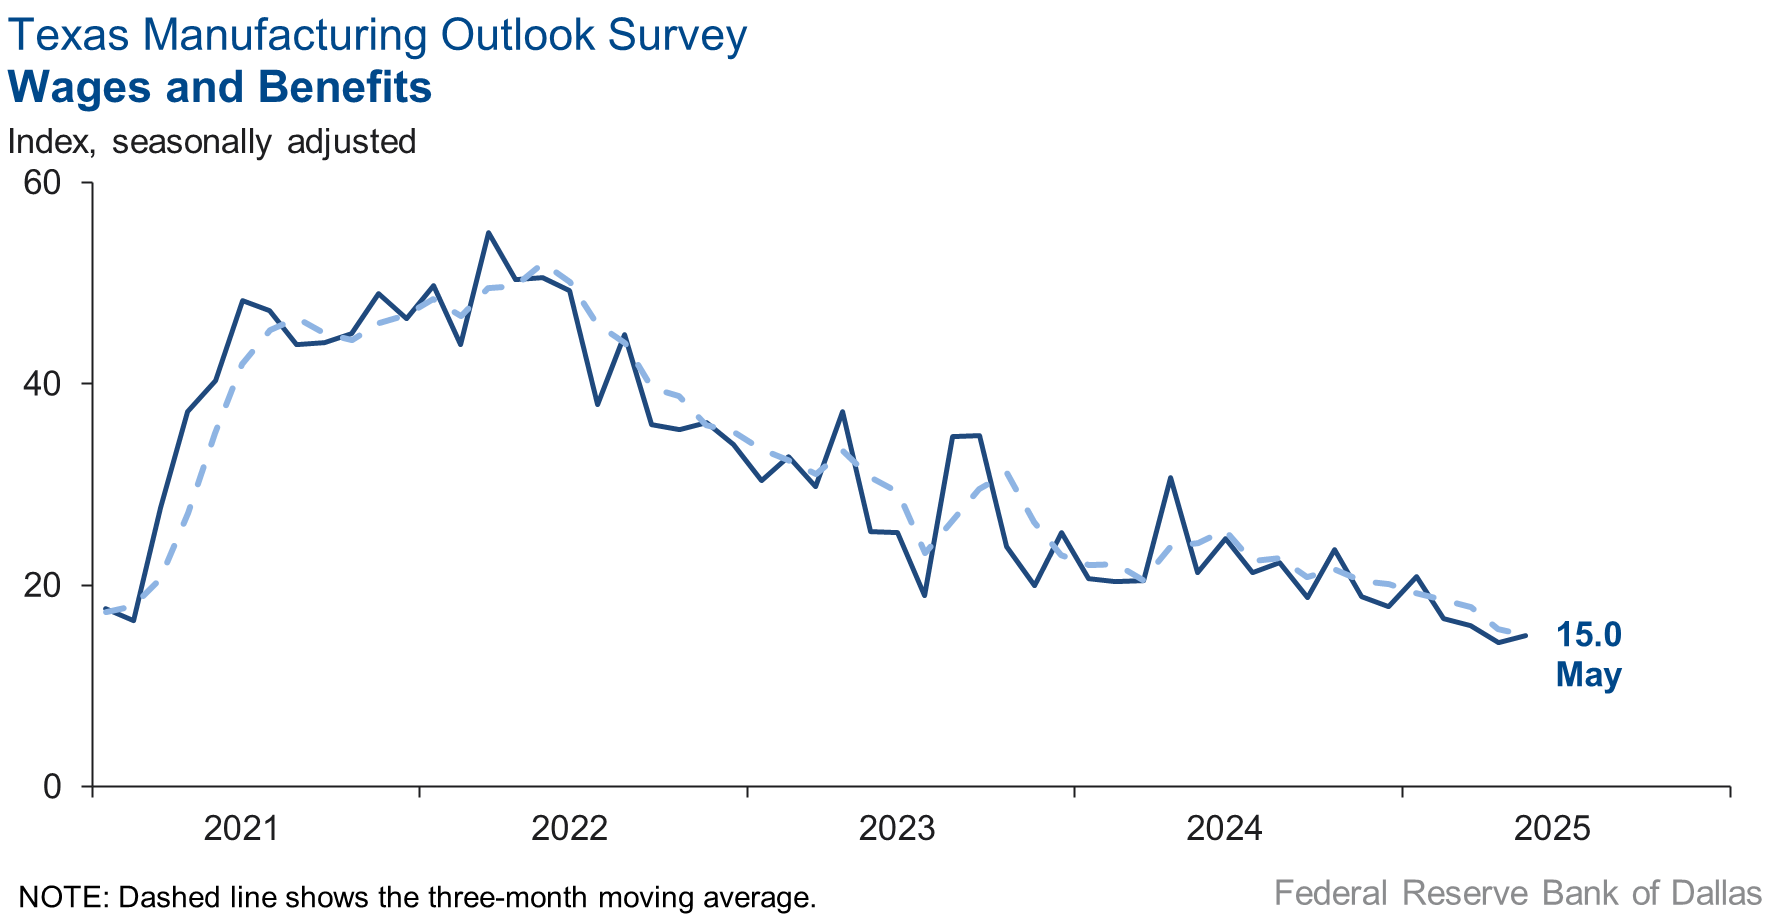
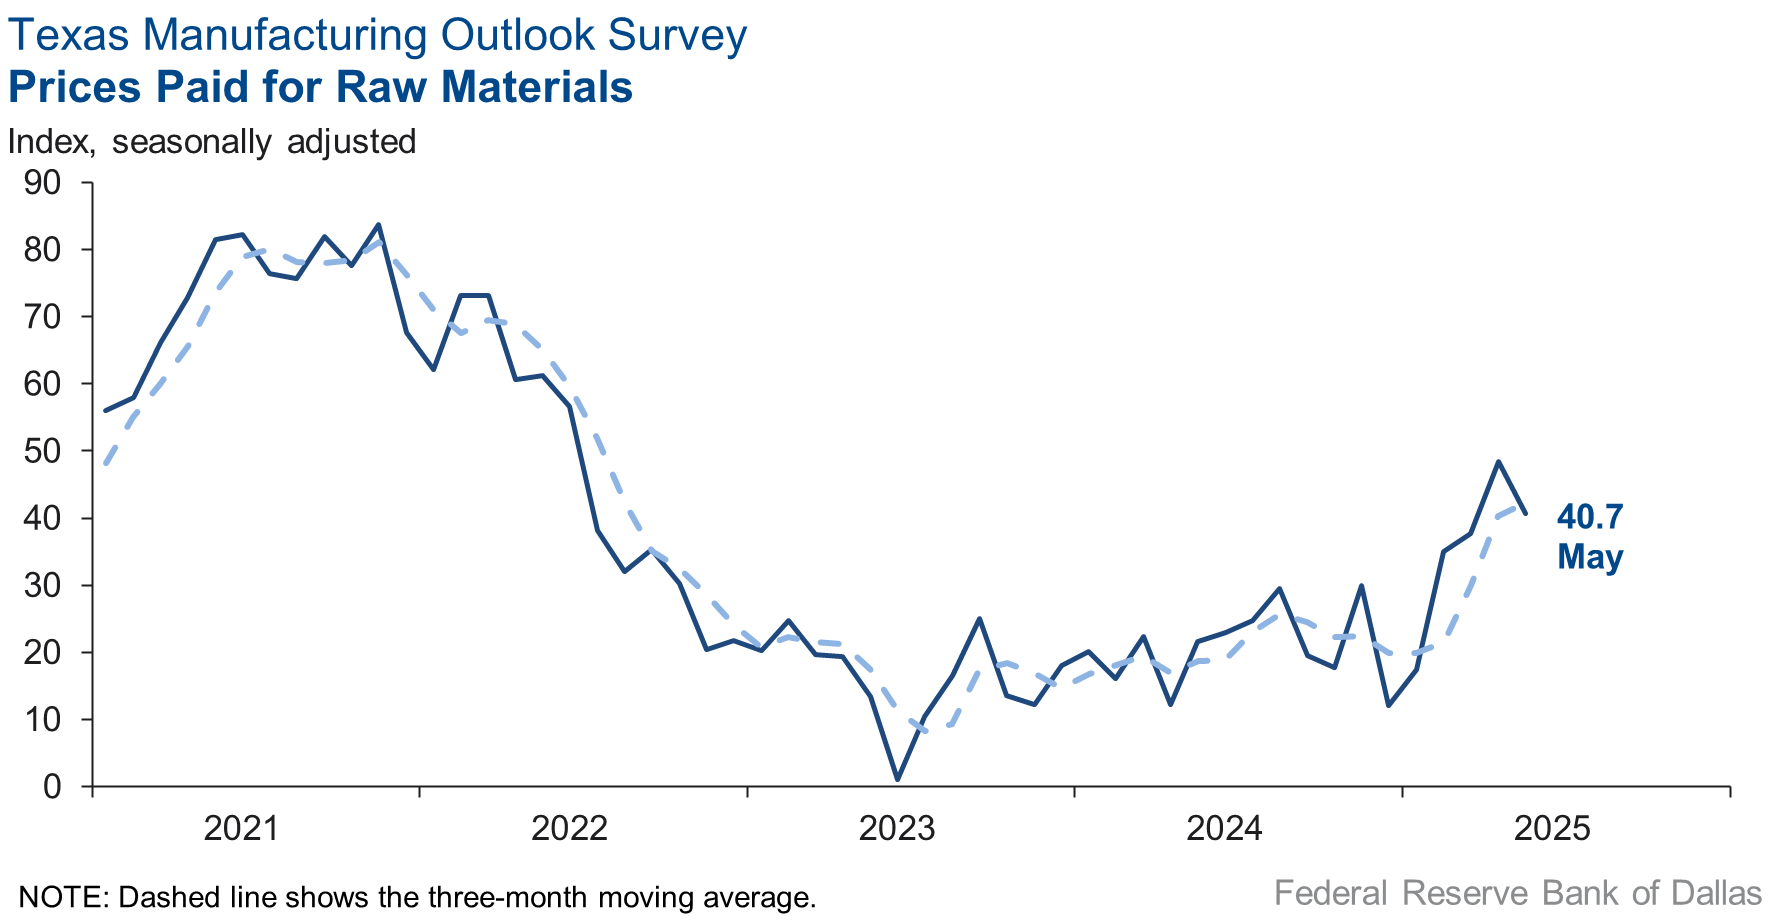
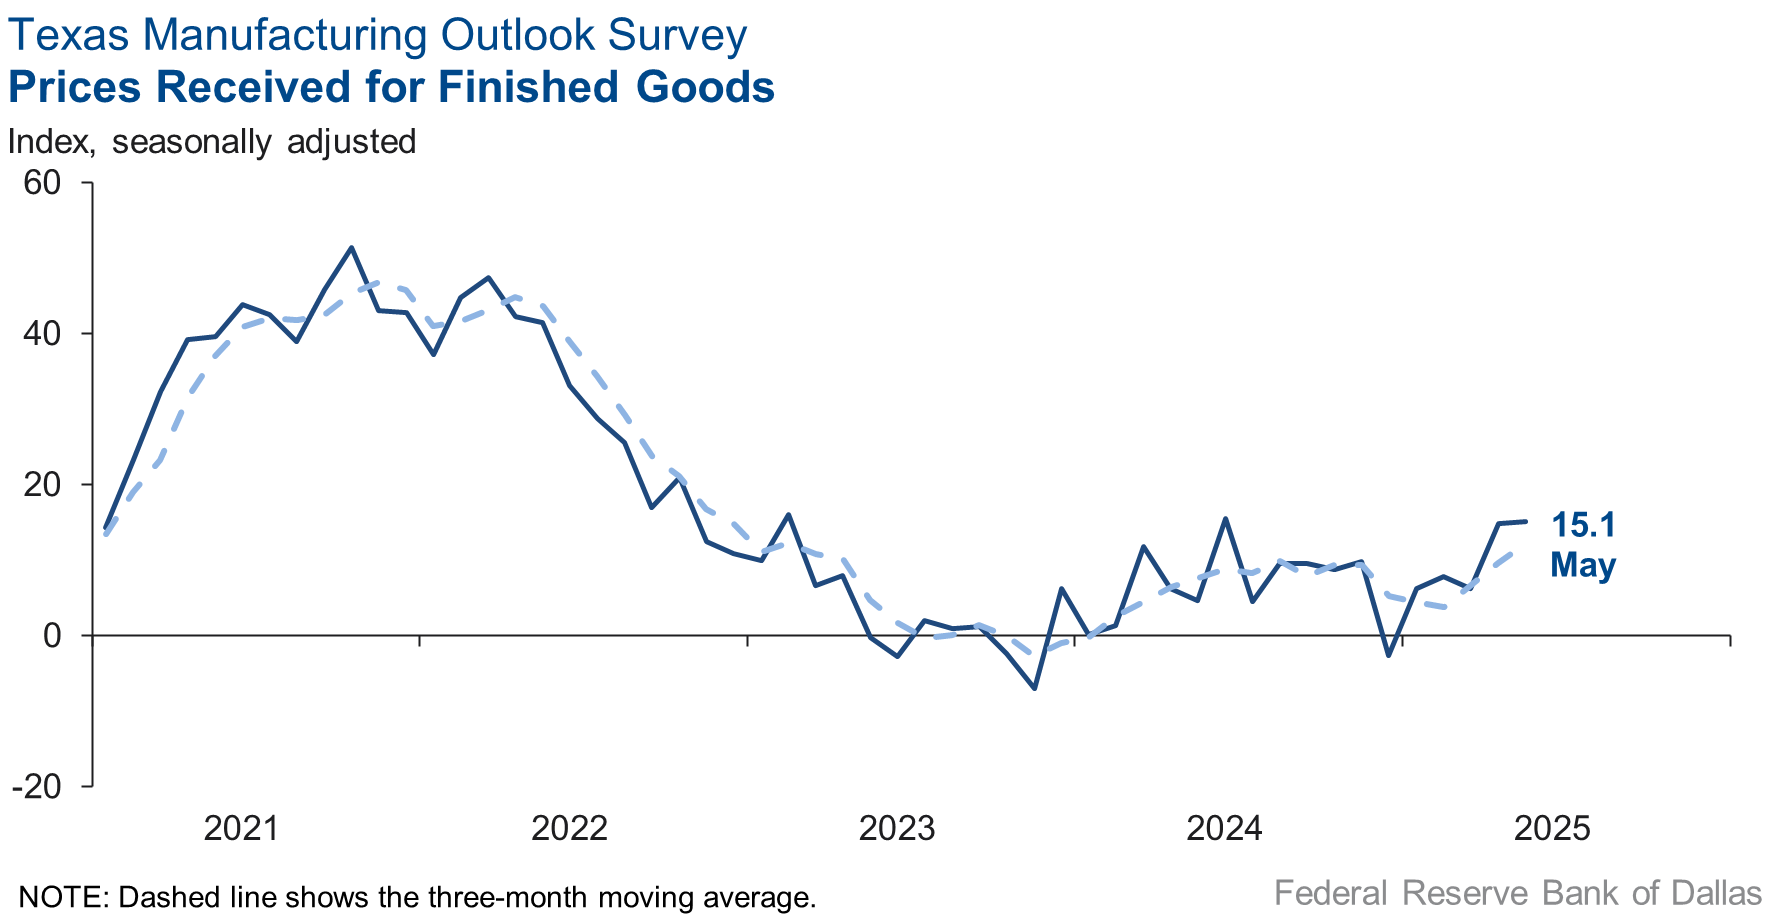
Higher-than-usual price pressures continued in May, while wage growth remained slightly subdued. The raw materials prices index fell 8 points to 40.7, and the finished goods prices index held steady at 15.1—both readings are well above average. Meanwhile, the wages and benefits index remained below average, largely unchanged at a reading of 15.0.
Expectations have increased for manufacturing activity six months from now. The future production index moved up 16 points to 31.1. The future general business activity index also rose 16 points, barely pushing into positive territory to a reading of 1.3. Other indexes of future manufacturing activity rose but remained below average.
Next release: Monday, June 30
Data were collected May 13–21, and 79 of the 118 Texas manufacturers surveyed submitted responses. The Dallas Fed conducts the Texas Manufacturing Outlook Survey monthly to obtain a timely assessment of the state’s factory activity. Firms are asked whether output, employment, orders, prices and other indicators increased, decreased or remained unchanged over the previous month.
Survey responses are used to calculate an index for each indicator. Each index is calculated by subtracting the percentage of respondents reporting a decrease from the percentage reporting an increase. When the share of firms reporting an increase exceeds the share reporting a decrease, the index will be greater than zero, suggesting the indicator has increased over the prior month. If the share of firms reporting a decrease exceeds the share reporting an increase, the index will be below zero, suggesting the indicator has decreased over the prior month. An index will be zero when the number of firms reporting an increase is equal to the number of firms reporting a decrease. Data have been seasonally adjusted as necessary.
Results summary
Historical data are available from June 2004 to the most current release month.
| Business Indicators Relating to Facilities and Products in Texas Current (versus previous month) | ||||||||
| Indicator | May Index | Apr Index | Change | Series Average | Trend* | % Reporting Increase | % Reporting No Change | % Reporting Decrease |
Production | 0.9 | 5.1 | –4.2 | 9.6 | 3(+) | 28.1 | 44.8 | 27.2 |
Capacity Utilization | –1.5 | –3.8 | +2.3 | 7.4 | 4(–) | 25.4 | 47.6 | 26.9 |
New Orders | –8.7 | –20.0 | +11.3 | 4.8 | 4(–) | 23.0 | 45.3 | 31.7 |
Growth Rate of Orders | –16.4 | –22.0 | +5.6 | –1.0 | 4(–) | 15.9 | 51.8 | 32.3 |
Unfilled Orders | –9.3 | –13.4 | +4.1 | –2.5 | 9(–) | 15.2 | 60.3 | 24.5 |
Shipments | 0.5 | –5.5 | +6.0 | 7.9 | 1(+) | 24.1 | 52.3 | 23.6 |
Delivery Time | –2.2 | –9.3 | +7.1 | 0.7 | 2(–) | 14.0 | 69.8 | 16.2 |
Finished Goods Inventories | –1.3 | 4.6 | –5.9 | –3.1 | 1(–) | 17.7 | 63.3 | 19.0 |
Prices Paid for Raw Materials | 40.7 | 48.4 | –7.7 | 27.3 | 61(+) | 50.1 | 40.5 | 9.4 |
Prices Received for Finished Goods | 15.1 | 14.9 | +0.2 | 8.6 | 5(+) | 23.8 | 67.5 | 8.7 |
Wages and Benefits | 15.0 | 14.3 | +0.7 | 21.1 | 61(+) | 15.0 | 85.0 | 0.0 |
Employment | 3.5 | –3.9 | +7.4 | 7.3 | 1(+) | 11.5 | 80.5 | 8.0 |
Hours Worked | –3.6 | –6.4 | +2.8 | 3.0 | 4(–) | 13.2 | 70.0 | 16.8 |
Capital Expenditures | 2.1 | –0.4 | +2.5 | 6.6 | 1(+) | 17.7 | 66.7 | 15.6 |
| General Business Conditions Current (versus previous month) | ||||||||
| Indicator | May Index | Apr Index | Change | Series Average | Trend** | % Reporting Improved | % Reporting No Change | % Reporting Worsened |
Company Outlook | –11.3 | –28.3 | +17.0 | 4.3 | 4(–) | 11.8 | 65.2 | 23.1 |
General Business Activity | –15.3 | –35.8 | +20.5 | 0.4 | 4(–) | 12.2 | 60.3 | 27.5 |
| Indicator | May Index | Apr Index | Change | Series Average | Trend* | % Reporting Increase | % Reporting No Change | % Reporting Decrease |
Outlook Uncertainty | 12.7 | 47.1 | –34.4 | 17.3 | 49(+) | 30.4 | 51.9 | 17.7 |
| Business Indicators Relating to Facilities and Products in Texas Future (six months ahead) | ||||||||
| Indicator | May Index | Apr Index | Change | Series Average | Trend* | % Reporting Increase | % Reporting No Change | % Reporting Decrease |
Production | 31.1 | 14.8 | +16.3 | 36.2 | 61(+) | 45.8 | 39.4 | 14.7 |
Capacity Utilization | 22.1 | 11.5 | +10.6 | 33.0 | 61(+) | 37.3 | 47.5 | 15.2 |
New Orders | 21.3 | 10.1 | +11.2 | 33.6 | 31(+) | 39.0 | 43.3 | 17.7 |
Growth Rate of Orders | 10.9 | 9.5 | +1.4 | 24.8 | 24(+) | 33.2 | 44.6 | 22.3 |
Unfilled Orders | –1.4 | –6.1 | +4.7 | 2.8 | 4(–) | 9.8 | 79.0 | 11.2 |
Shipments | 21.3 | 13.2 | +8.1 | 34.6 | 61(+) | 43.4 | 34.6 | 22.1 |
Delivery Time | –1.6 | –7.3 | +5.7 | –1.4 | 3(–) | 8.3 | 81.8 | 9.9 |
Finished Goods Inventories | –8.2 | –16.5 | +8.3 | –0.2 | 3(–) | 8.2 | 75.3 | 16.4 |
Prices Paid for Raw Materials | 39.8 | 47.6 | –7.8 | 33.6 | 62(+) | 47.8 | 44.2 | 8.0 |
Prices Received for Finished Goods | 28.2 | 29.6 | –1.4 | 21.1 | 61(+) | 35.2 | 57.7 | 7.0 |
Wages and Benefits | 16.0 | 22.5 | –6.5 | 39.1 | 61(+) | 17.9 | 80.2 | 1.9 |
Employment | 13.6 | 13.1 | +0.5 | 22.8 | 60(+) | 26.6 | 60.4 | 13.0 |
Hours Worked | –0.8 | 0.2 | –1.0 | 8.7 | 1(–) | 10.6 | 78.0 | 11.4 |
Capital Expenditures | 24.0 | 7.6 | +16.4 | 19.4 | 60(+) | 32.1 | 59.8 | 8.1 |
| General Business Conditions Future (six months ahead) | ||||||||
| Indicator | May Index | Apr Index | Change | Series Average | Trend** | % Reporting Increase | % Reporting No Change | % Reporting Worsened |
Company Outlook | 5.6 | –6.0 | +11.6 | 18.3 | 1(+) | 22.0 | 61.6 | 16.4 |
General Business Activity | 1.3 | –15.2 | +16.5 | 12.3 | 1(+) | 22.8 | 55.7 | 21.5 |
*Shown is the number of consecutive months of expansion or contraction in the underlying indicator. Expansion is indicated by a positive index reading and denoted by a (+) in the table. Contraction is indicated by a negative index reading and denoted by a (–) in the table.
**Shown is the number of consecutive months of improvement or worsening in the underlying indicator. Improvement is indicated by a positive index reading and denoted by a (+) in the table. Worsening is indicated by a negative index reading and denoted by a (–) in the table.
Data have been seasonally adjusted as necessary.
Comments from survey respondents
Survey participants are given the opportunity to submit comments on current issues that may be affecting their businesses. Some comments have been edited for grammar and clarity.
- The basic materials market is being impacted by the tariff uncertainties and overall lower consumer confidence levels as we work through the policy changes impacting the markets. "Uncertainty" is the key word, and getting to a "new norm" so that business planning and forecasts can stabilize sooner than later is our hope as we look out six months. Fiscal policy decisions on future interest rate adjustments to boost internal U.S. growth are a key factor in the basic materials markets as it relates to the building/construction and automotive sectors.
- Decision-making remains extremely difficult due to extreme tariff uncertainty.
- We are still seeing a slowdown in RFQs [requests for quotations] and new orders, but we believe that is largely due to the uncertainty related to tariffs. As new deals are announced, especially with China, we expect normal business activity and growth to resume. We are moving forward with our capital investment plans to support future growth.
- I would say the uncertainty has decreased in the very short term (up to 90 days) based on the U.S.–China tariff rollback. However, it is hard to be certain of where we are heading next because the process has been so volatile. The rollback is helpful and more manageable for our business and should get us through the summer reasonably well, but we are quite uncertain of what a more lasting solution looks like. Will it be worse or better than what we see in the next 90 days? That remains to be seen.
- We have had a couple of companies contact us recently to buy us. I think the industry is being bought out by private capital.
- We have a large order delayed until 2026.
- DOGE [Department of Government Efficiency] has killed us. Our customers are fighting tariff increases and dramatic funding cuts from USDA [U.S. Department of Agriculture] and USAID [United States Agency for International Development].
- We are still worried about immigration and its impact on employment. We are also concerned about an upcoming recession.
- It appears the customer has remained strong, but my perception of the general economy has gone down. President Trump’s tariff fight will only worsen the world's business activity.
- Some projects are on hold due to uncertainty in the global climate. There is a continued increase in business in hospitality, health care and data centers.
- As a middle-market metal fabricator, we have witnessed policy unfavorably impacting demand. Unfortunately, raw materials costs are increasing from domestic suppliers, and our retail customers are in a complete quandary as they reorganize supply chains (many previously overhauled during/after the pandemic) and understand how the consumer is being impacted by the one-two punch of inflation and tariffs.
- Business sucks.
- We had our best month in two years and hope this trend continues.
- It's a battle! We thought and anticipated things would be more stable, heading in the right direction, and far more productive by now. One-third into the new year and now we're thinking surely things will improve by year-end. It's admittedly frustrating and disconcerting not to have a better plan with greater confidence than what we have presently. Our sales team is kicking over every rock. Our operations team has squeezed every penny. It's just tough sledding in the here and now.
- It looks like business is slowing down again.
- Tariffs [are an issue affecting our business].
- The tariff situation is controlling our business to date.
- Tariffs are causing us many issues: increasing costs as we try to increase U.S. manufacturing, and the price of components has increased.
- Forty-two percent tariffs on our product is much better than 157 percent. But it's still 42 percent. It cuts into profits and sales.
- Business is still moderately slow.
- We are making capital expenditures to open manufacturing processes for new product offerings.
- We should be busier this time of the year, but orders are under last year's.
- We are fortunate to be full of work that was entered months ago and is seasonal to this time of year. We are working overtime and life is good; however, the other jobs that we should be doing are not out there at the moment. It seems all this chaos from the tariffs and ramblings out of Washington, D.C. have caused a rather big decline in activity in the graphic arts segment that we serve. If not for this large amount of seasonal work, we would be stupid slow. When we follow up with our customers, we are hearing the same thing: that they are slow and don't have any projects to send to us to work on.
- We did see orders pick up this month, but there is still a lot of uncertainty regarding tariff implications. Our suppliers haven't passed on price increases yet but have communicated that they are coming (levels and specifics to be determined). We are in a holding pattern until tariff deals are announced and we can react accordingly.
Historical Data
Historical data can be downloaded dating back to June 2004.
Indexes
Download indexes for all indicators. For the definitions of all variables, see Data Definitions.
| Unadjusted |
| Seasonally adjusted |
All Data
Download indexes and components of the indexes (percentage of respondents reporting increase, decrease, or no change). For the definitions of all variables, see Data Definitions.
| Unadjusted |
| Seasonally adjusted |
Questions regarding the Texas Business Outlook Surveys can be addressed to Emily Kerr at emily.kerr@dal.frb.org.
Sign up for our email alert to be automatically notified as soon as the latest Texas Manufacturing Outlook Survey is released on the web.