Texas Manufacturing Outlook Survey

Texas manufacturing expansion strengthens despite flat employment
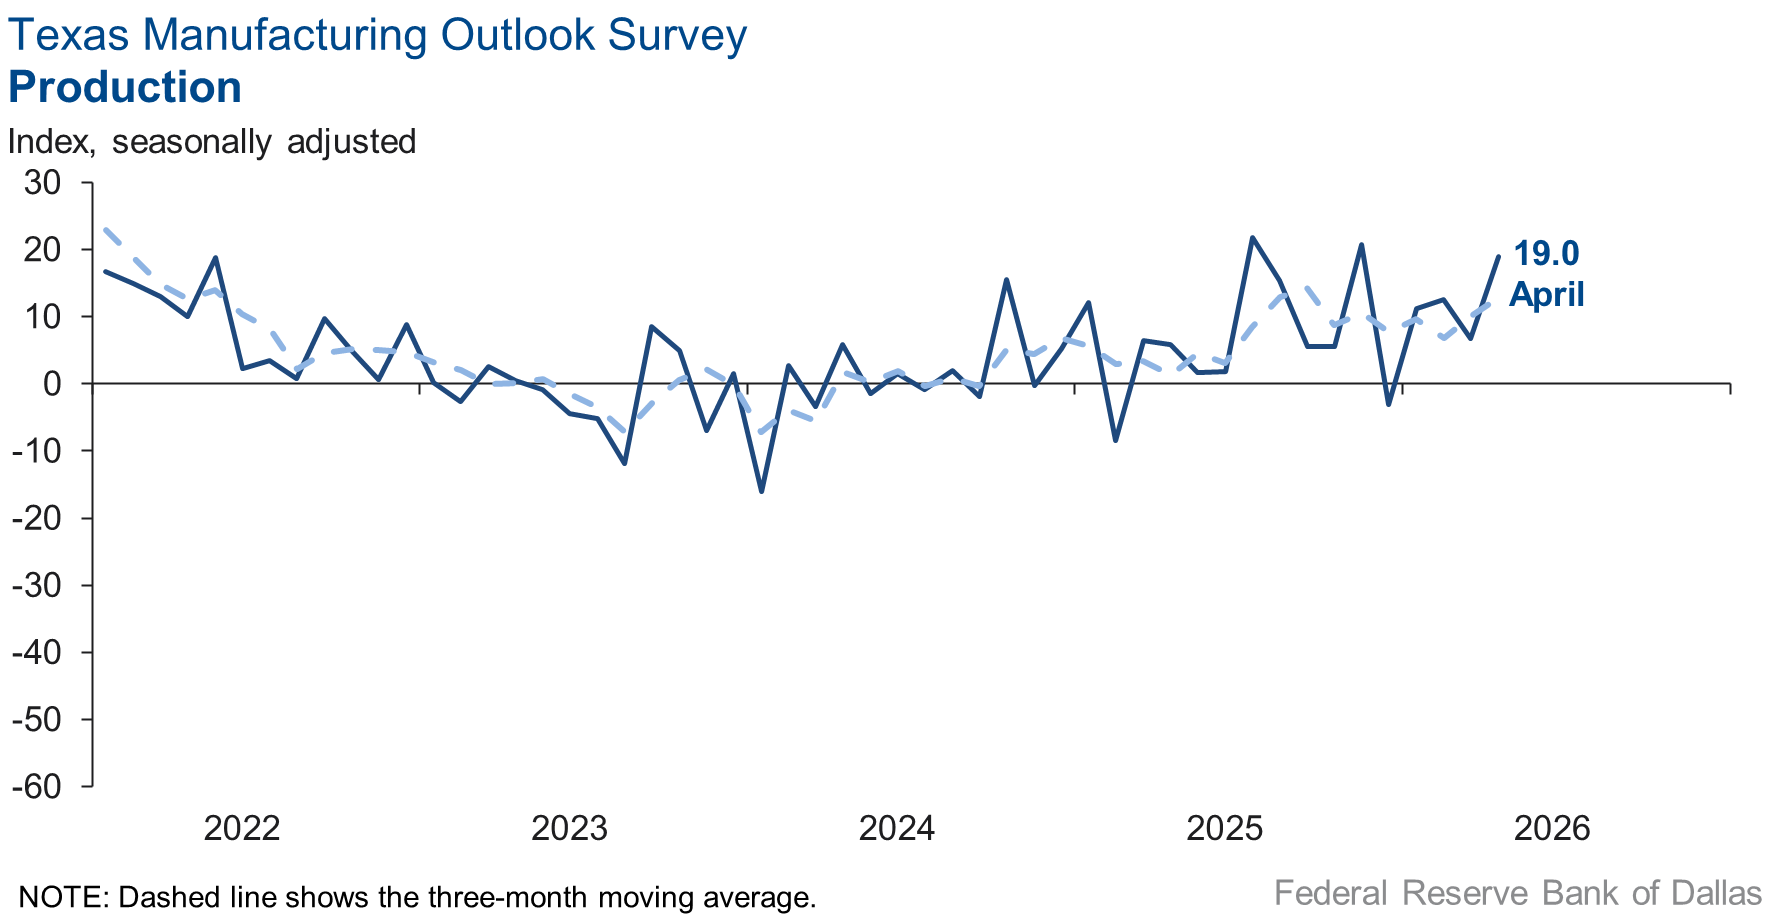
Texas manufacturing output growth accelerated in April, according to business executives responding to the Texas Manufacturing Outlook Survey. The production index, a key measure of state manufacturing conditions, jumped 12 points to 19.0, a reading suggestive of an above-average pace of output expansion.
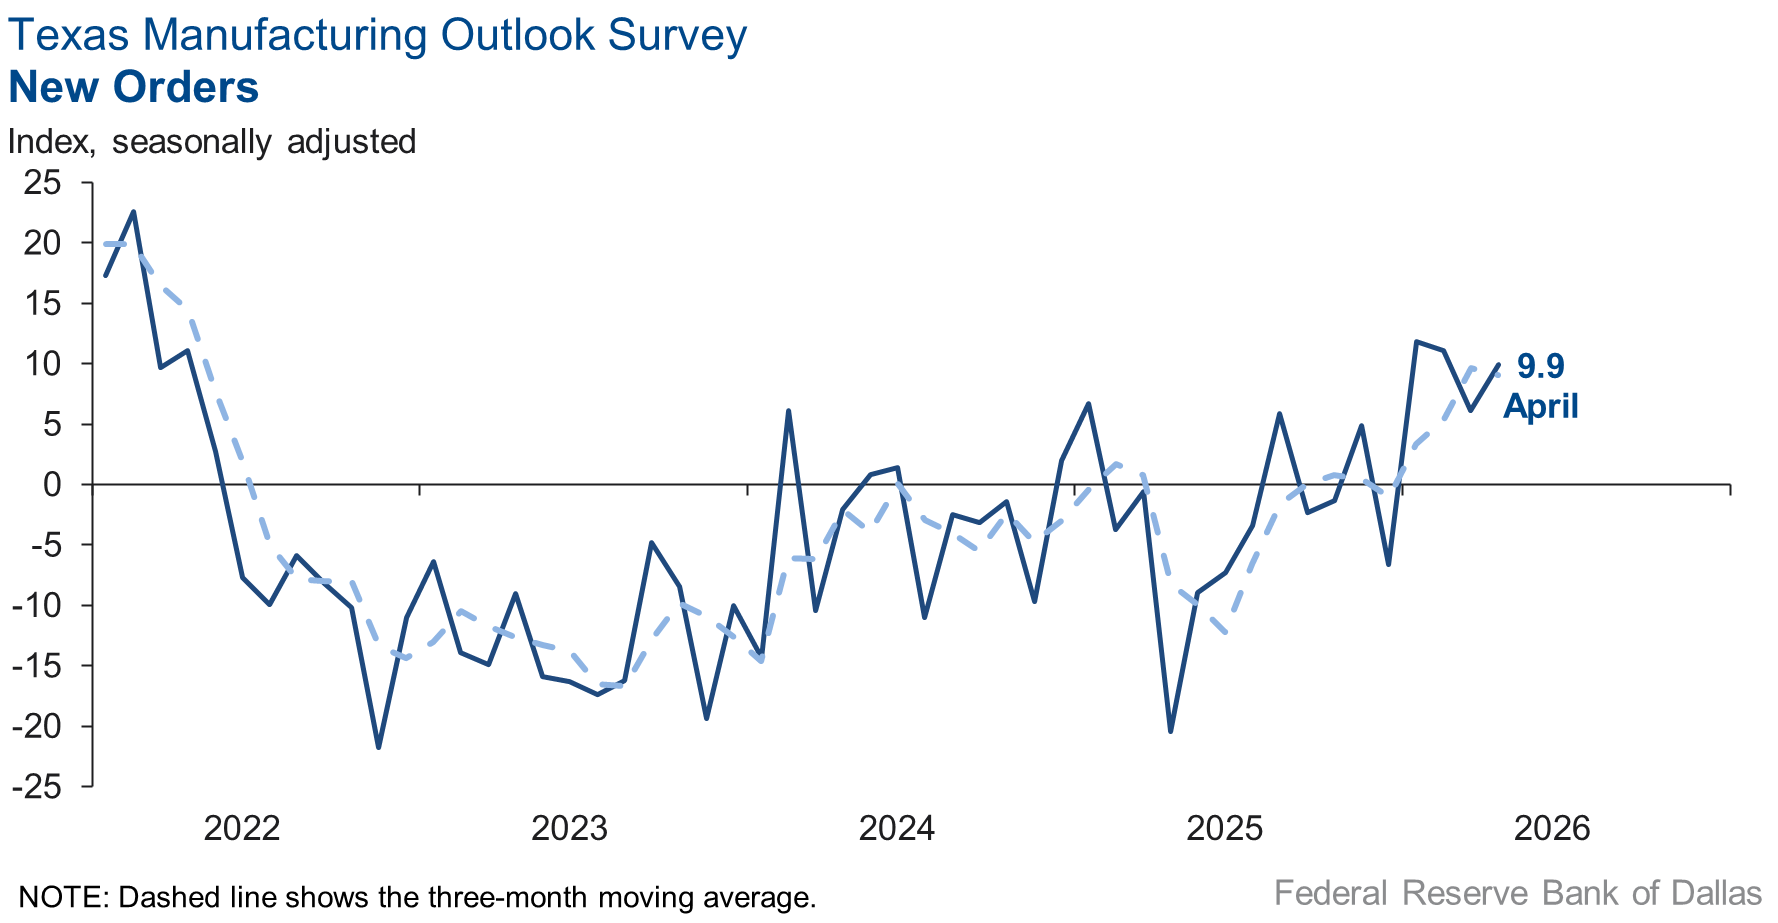
Other measures of manufacturing activity also showed signs of faster growth this month. The capacity utilization index moved up 13 points to 19.8, the new orders index increased four points to 9.9 and the shipments index rose 13 points to 15.0.
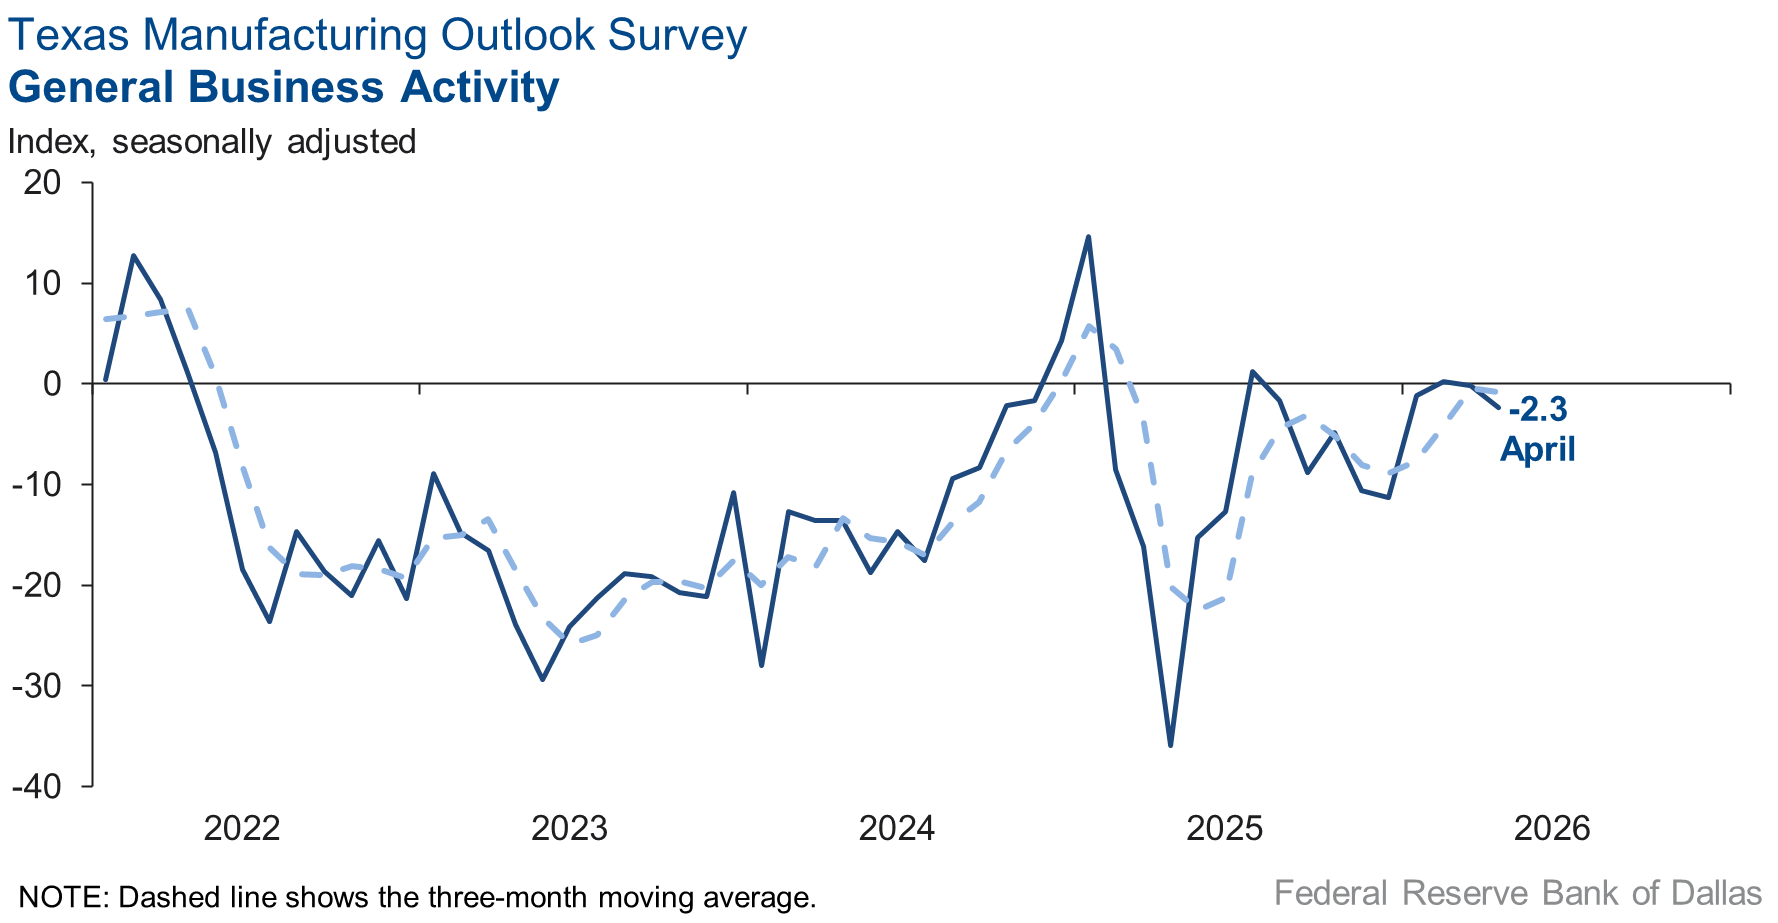
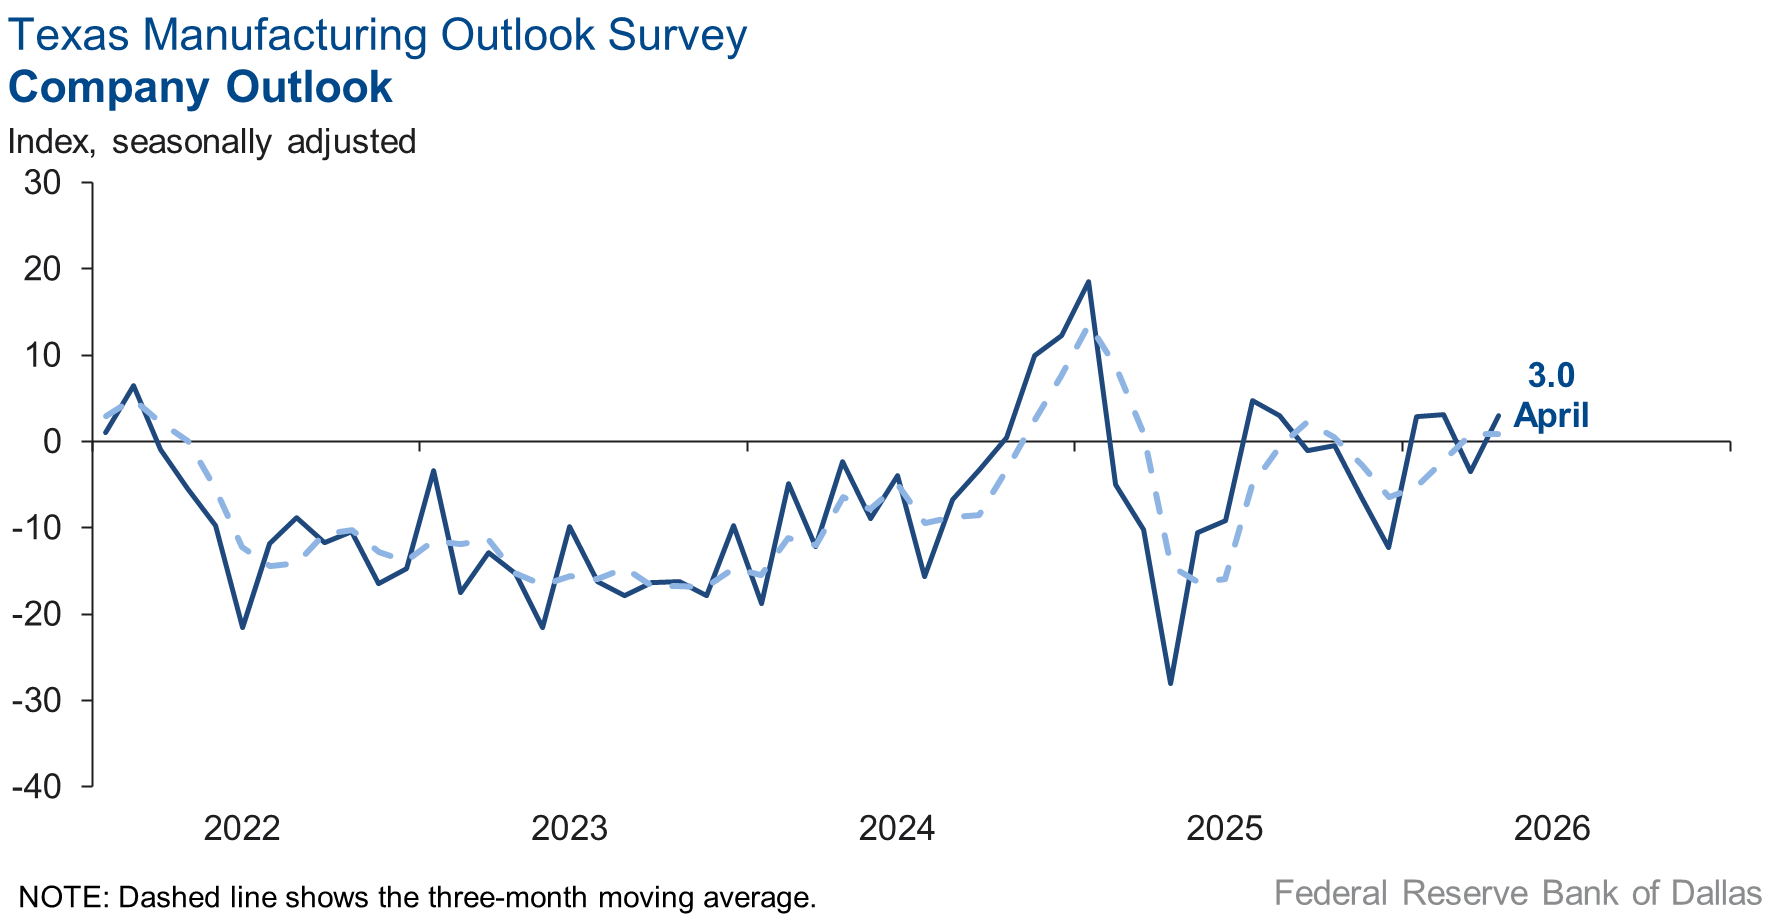
Perceptions of broader business conditions were mixed in April. The general business activity index fell two points to -2.3. However, the company outlook index rebounded into positive territory, rising seven points to 3.0. The outlook uncertainty index fell eight points to 17.9.
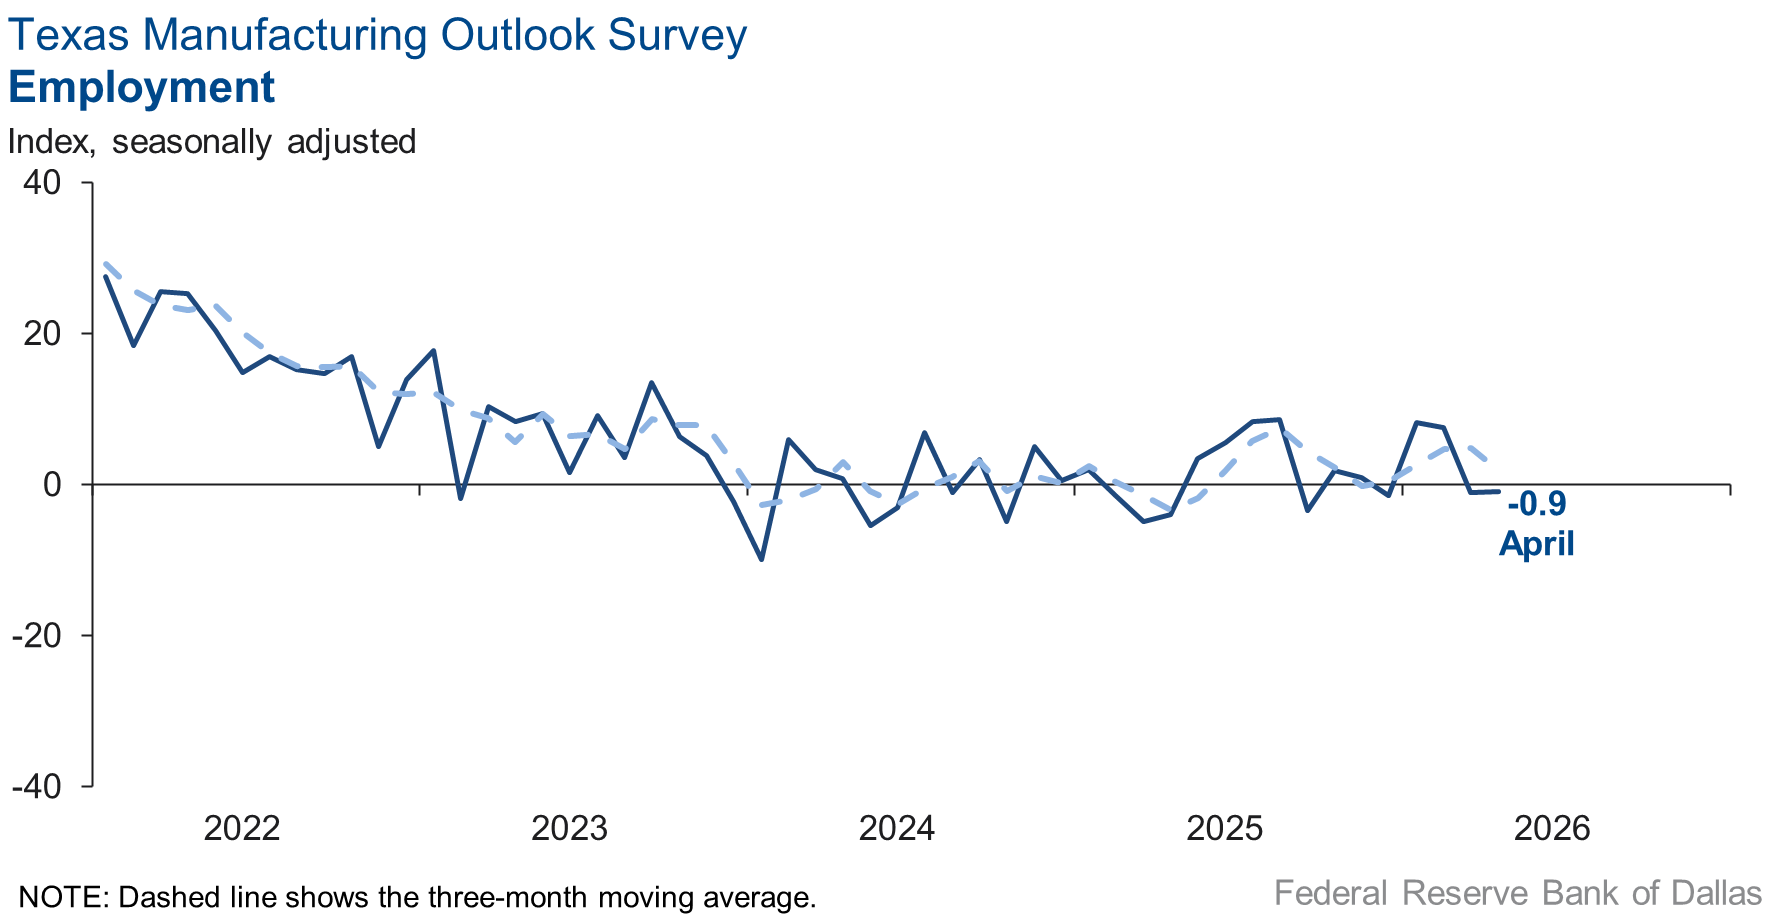
Employment continued to be flat, but workweeks were slightly longer in April. The employment index was unchanged at -0.9, with the near-zero reading indicating no change in payrolls from March. The hours worked index moved up to 4.0 from 0.9.
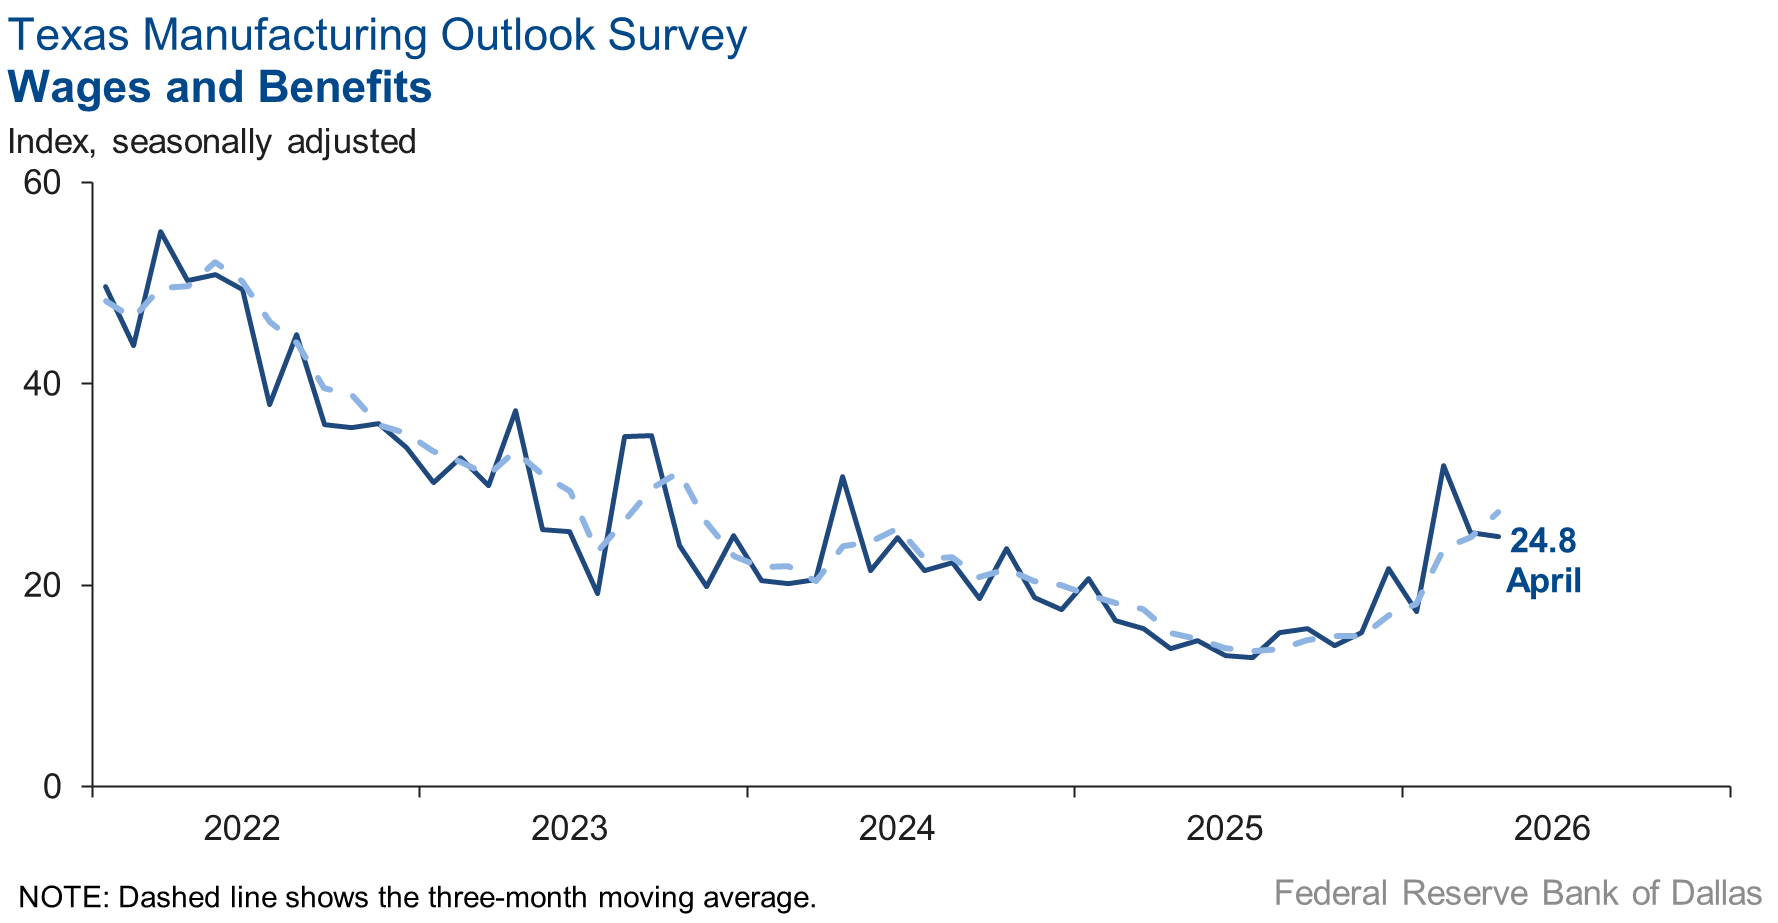
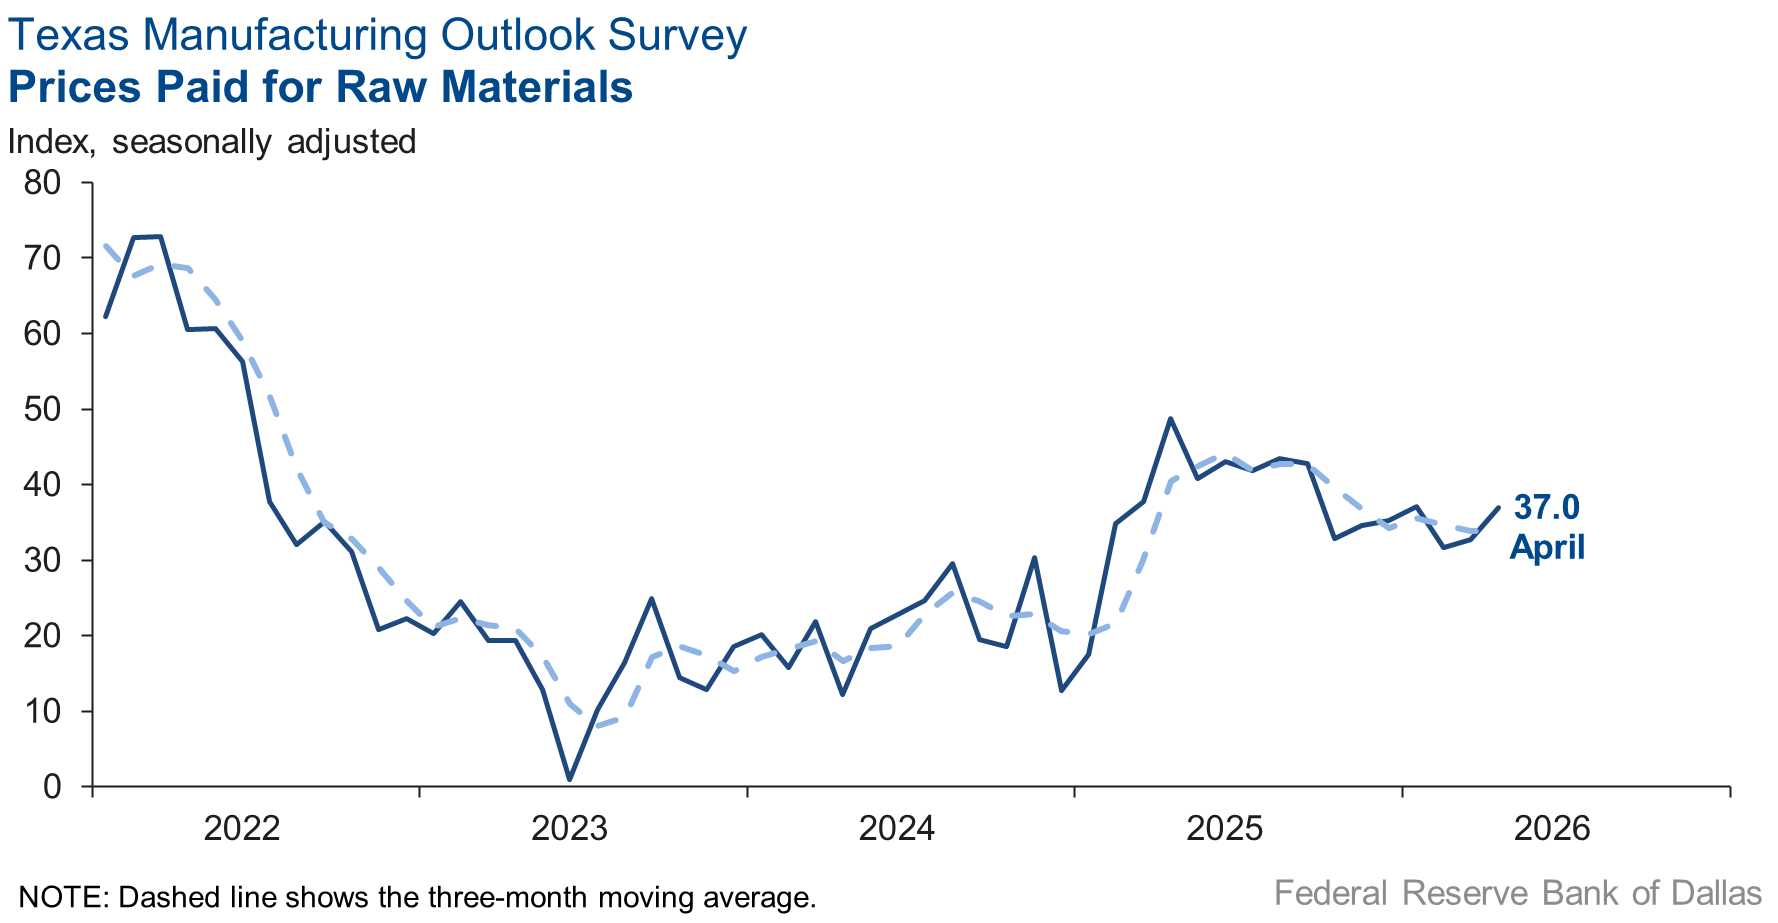
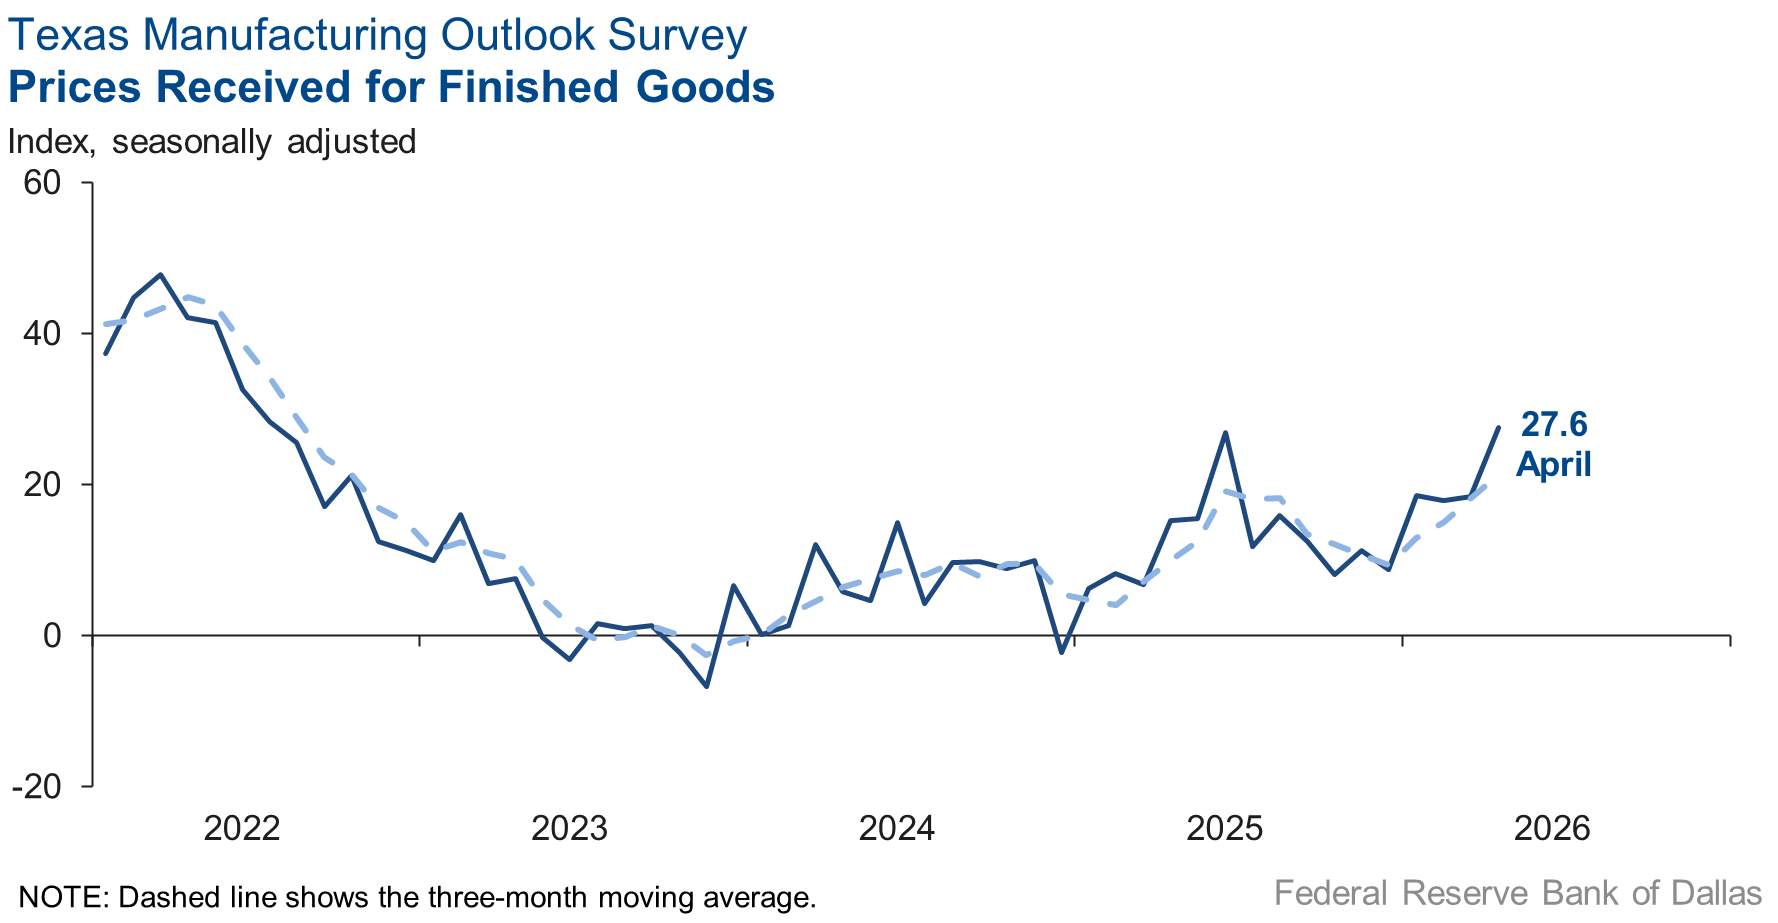
Price pressures increased while wage pressures were little changed this month. The finished goods prices index jumped nine points to 27.6, its highest level since July 2022, while the raw materials prices index increased to 37.0 from 32.7. The wages and benefits index was relatively unchanged at 24.8.
Expectations are for increased manufacturing activity six months from now. The future production index held steady at 34.6, and the future general business activity index rose four points to 14.1. Other indexes of future manufacturing activity remained in positive territory and increased.
Next release: Tuesday, May 26
Data were collected April 14–22, and 67 of the 114 Texas manufacturers surveyed submitted responses. The Dallas Fed conducts the Texas Manufacturing Outlook Survey monthly to obtain a timely assessment of the state’s factory activity. Firms are asked whether output, employment, orders, prices and other indicators increased, decreased or remained unchanged over the previous month.
Survey responses are used to calculate an index for each indicator. Each index is calculated by subtracting the percentage of respondents reporting a decrease from the percentage reporting an increase. When the share of firms reporting an increase exceeds the share reporting a decrease, the index will be greater than zero, suggesting the indicator has increased over the prior month. If the share of firms reporting a decrease exceeds the share reporting an increase, the index will be below zero, suggesting the indicator has decreased over the prior month. An index will be zero when the number of firms reporting an increase is equal to the number of firms reporting a decrease. Data have been seasonally adjusted as necessary.
Results summary
Historical data are available from June 2004 to the most current release month.
| Business Indicators Relating to Facilities and Products in Texas Current (versus previous month) | ||||||||
| Indicator | Apr Index | Mar Index | Change | Series Average | Trend* | % Reporting Increase | % Reporting No Change | % Reporting Decrease |
Production | 19.0 | 6.8 | +12.2 | 9.6 | 4(+) | 36.8 | 45.3 | 17.8 |
Capacity Utilization | 19.8 | 7.2 | +12.6 | 7.5 | 4(+) | 34.2 | 51.4 | 14.4 |
New Orders | 9.9 | 6.1 | +3.8 | 4.7 | 4(+) | 32.5 | 44.8 | 22.6 |
Growth Rate of Orders | 8.5 | 2.2 | +6.3 | –1.1 | 3(+) | 25.8 | 56.9 | 17.3 |
Unfilled Orders | –6.5 | –6.1 | –0.4 | –2.7 | 2(–) | 12.4 | 68.7 | 18.9 |
Shipments | 15.0 | 1.8 | +13.2 | 7.8 | 4(+) | 32.0 | 51.0 | 17.0 |
Delivery Time | –7.4 | 2.8 | –10.2 | 0.5 | 1(–) | 9.8 | 73.0 | 17.2 |
Finished Goods Inventories | –12.1 | –5.0 | –7.1 | –3.3 | 2(–) | 10.6 | 66.7 | 22.7 |
Prices Paid for Raw Materials | 37.0 | 32.7 | +4.3 | 27.7 | 72(+) | 42.8 | 51.4 | 5.8 |
Prices Received for Finished Goods | 27.6 | 18.4 | +9.2 | 9.0 | 16(+) | 31.0 | 65.6 | 3.4 |
Wages and Benefits | 24.8 | 25.2 | –0.4 | 21.0 | 72(+) | 30.3 | 64.2 | 5.5 |
Employment | –0.9 | –1.0 | +0.1 | 7.1 | 2(–) | 14.1 | 70.9 | 15.0 |
Hours Worked | 4.0 | 0.9 | +3.1 | 3.0 | 4(+) | 16.5 | 71.0 | 12.5 |
Capital Expenditures | 3.1 | 5.7 | –2.6 | 6.6 | 2(+) | 15.2 | 72.6 | 12.1 |
| General Business Conditions Current (versus previous month) | ||||||||
| Indicator | Apr Index | Mar Index | Change | Series Average | Trend** | % Reporting Improved | % Reporting No Change | % Reporting Worsened |
Company Outlook | 3.0 | –3.5 | +6.5 | 4.1 | 1(+) | 23.6 | 55.8 | 20.6 |
General Business Activity | –2.3 | –0.2 | –2.1 | 0.2 | 2(–) | 19.6 | 58.5 | 21.9 |
| Indicator | Apr Index | Mar Index | Change | Series Average | Trend* | % Reporting Increase | % Reporting No Change | % Reporting Decrease |
Outlook Uncertainty | 17.9 | 26.0 | –8.1 | 16.9 | 4(+) | 32.8 | 52.2 | 14.9 |
| Business Indicators Relating to Facilities and Products in Texas Future (six months ahead) | ||||||||
| Indicator | Apr Index | Mar Index | Change | Series Average | Trend* | % Reporting Increase | % Reporting No Change | % Reporting Decrease |
Production | 34.6 | 35.7 | –1.1 | 36.0 | 72(+) | 47.8 | 39.0 | 13.2 |
Capacity Utilization | 37.4 | 27.0 | +10.4 | 32.8 | 72(+) | 48.0 | 41.4 | 10.6 |
New Orders | 31.4 | 29.2 | +2.2 | 33.4 | 42(+) | 44.4 | 42.6 | 13.0 |
Growth Rate of Orders | 24.4 | 17.5 | +6.9 | 24.7 | 32(+) | 37.4 | 49.7 | 13.0 |
Unfilled Orders | 6.0 | –0.7 | +6.7 | 2.7 | 1(+) | 11.7 | 82.6 | 5.7 |
Shipments | 36.3 | 28.8 | +7.5 | 34.3 | 72(+) | 46.3 | 43.8 | 10.0 |
Delivery Time | –2.2 | 3.8 | –6.0 | –1.3 | 1(–) | 6.5 | 84.8 | 8.7 |
Finished Goods Inventories | 4.9 | 4.1 | +0.8 | –0.2 | 5(+) | 19.4 | 66.1 | 14.5 |
Prices Paid for Raw Materials | 47.3 | 50.7 | –3.4 | 34.0 | 73(+) | 51.3 | 44.7 | 4.0 |
Prices Received for Finished Goods | 38.1 | 39.2 | –1.1 | 21.7 | 72(+) | 44.4 | 49.2 | 6.3 |
Wages and Benefits | 35.5 | 38.0 | –2.5 | 39.0 | 263(+) | 39.9 | 55.7 | 4.4 |
Employment | 21.6 | 19.5 | +2.1 | 22.7 | 71(+) | 33.4 | 54.8 | 11.8 |
Hours Worked | 0.7 | 1.4 | –0.7 | 8.5 | 2(+) | 9.3 | 82.1 | 8.6 |
Capital Expenditures | 21.6 | 24.8 | –3.2 | 19.4 | 71(+) | 28.9 | 63.8 | 7.3 |
| General Business Conditions Future (six months ahead) | ||||||||
| Indicator | Apr Index | Mar Index | Change | Series Average | Trend** | % Reporting Increase | % Reporting No Change | % Reporting Worsened |
Company Outlook | 15.6 | 18.2 | –2.6 | 18.3 | 12(+) | 30.2 | 55.2 | 14.6 |
General Business Activity | 14.1 | 10.6 | +3.5 | 12.3 | 12(+) | 28.0 | 58.1 | 13.9 |
*Shown is the number of consecutive months of expansion or contraction in the underlying indicator. Expansion is indicated by a positive index reading and denoted by a (+) in the table. Contraction is indicated by a negative index reading and denoted by a (–) in the table.
**Shown is the number of consecutive months of improvement or worsening in the underlying indicator. Improvement is indicated by a positive index reading and denoted by a (+) in the table. Worsening is indicated by a negative index reading and denoted by a (–) in the table.
Data have been seasonally adjusted as necessary.
Comments from survey respondents
Survey participants are given the opportunity to submit comments on current issues that may be affecting their businesses. Some comments have been edited for grammar and clarity.
- We are starting to see some upward pressure on prices, especially with food and anything with a significant energy cost component.
- Middle East conflict, and fuel prices add uncertainty to economic and demand outlook.
- April has returned back to flat, just as January and February were.
- Feeling good about the economy right now based on orders and future business.
- Continued decline in consumer segment purchasing power as well as disarray at the federal level is impacting our customers, input costs, supply chain and financial viability. The long-term effect of the closure of the Strait of Hormuz is yet to be felt.
- Times are good, backlog is building, prices are firm and life is better! Thank the Lord for proactive leaders who understand business, deals and the economy. We are having many new business opportunities, and it appears from our perspective that the economy is starting to improve.
- Diesel fuel cost increases are raising transportation cost for finished goods and raw materials. If they persist, we will have to raise prices. We are currently absorbing the cost.
- Prices of main raw materials are experiencing a 4-6 percent increase that will push an increase in our selling prices 30 days from now. Demand does not seem to warrant these coordinated increases for our suppliers.
- The geopolitical and war-related issues have significantly increased our costs and delays in our supply chain as unusual supply chain ramifications create havoc. Our retail supply business is very vulnerable at this time. The unpredictable future is challenging, to say the least.
- President Trump’s proclamation a couple of weeks ago on Section 232 tariffs cleared up ambiguity in the language that had allowed some importers of aluminum to avoid paying the 50 percent tariff on the full value of covered aluminum products. That clarification has already increased quoting activity with several companies, the majority of them in the building and construction industry, as they begin evaluating onshoring suppliers back into the United States. Our quote activity, along with new orders, has increased tremendously. The industry’s efforts to protect and grow U.S. aluminum extrusion manufacturing jobs are beginning to show results. Our industry focus now shifts to the USMCA renewal. If Mexico and Canada are granted exemptions from Section 232 tariffs, it could be very detrimental to domestic producers, leading to lost jobs and potentially plant closures. China and other Asian countries, along with Europe and South America, based on history, will use Mexico as a pathway to enter the U.S. market at lower tariff ratesWe are actively working to ensure that does not happen again.
- We are getting busy because of work we normally do this time of year. As mentioned in the prior reports, demand has been slow for most of this calendar year. We are very worried about the short-term and long-term effects of the Iran conflict and the chaos and unpredictability coming out of Washington. Inflation is barreling full steam into prime rate increase territory, and no telling when fuel prices will return to where they were. [Demand] continues to be soft and slow, something we credit to the uncertainty in our economy right now.
- Demand has been considerably slow, slower than we can recall in many years. We continue to believe it’s from the chaos and confusion coming out of Washington. In addition, now with the Iran war, prices are going to shoot up due to shipping costs, and tariffs are still in effect. So, there is no telling when business will start to improve. We have some nice work coming in soon, but it's work we knew was coming. We are seeing some improvement in our estimating backlog, which is a good sign of better days to come. The war is causing a disruption of raw materials prices as we are producing plastic-based products, and virtually all of our raw materials are hydrocarbon-based.
- April is slower than March in terms of sales. We are also waiting longer for inventory [due to] both longer production lead times and time spent at ports (for imported goods). Historically, we've seen a seasonal pickup in Q3/Q4 and are hoping 2026 has the same increase in sales and production. There does seem to be additional uncertainty and negative outlook given higher energy prices and war overseas not going away.
- Importing from China is precarious. The costs of product and freight are higher. Suppliers are apprehensive. Their costs are increasing, especially a certain raw material plastic impacted by petrochemicals affected by cost of oil.
Historical Data
Historical data can be downloaded dating back to June 2004.
Indexes
Download indexes for all indicators. For the definitions of all variables, see Data Definitions.
| Unadjusted |
| Seasonally adjusted |
All Data
Download indexes and components of the indexes (percentage of respondents reporting increase, decrease, or no change). For the definitions of all variables, see Data Definitions.
| Unadjusted |
| Seasonally adjusted |
Special questions
For this month’s survey, Texas business executives were asked supplemental questions on the Iran war. Results below include responses from participants from both the Texas Manufacturing Outlook Survey and Texas Service Sector Outlook Survey. View individual survey results.
Questions regarding the Texas Business Outlook Surveys can be addressed to Jesus Cañas.
Sign up for our email alert to be automatically notified as soon as the latest Texas Manufacturing Outlook Survey is released on the web.