Texas Manufacturing Outlook Survey

Growth in Texas manufacturing activity slows amid increased uncertainty
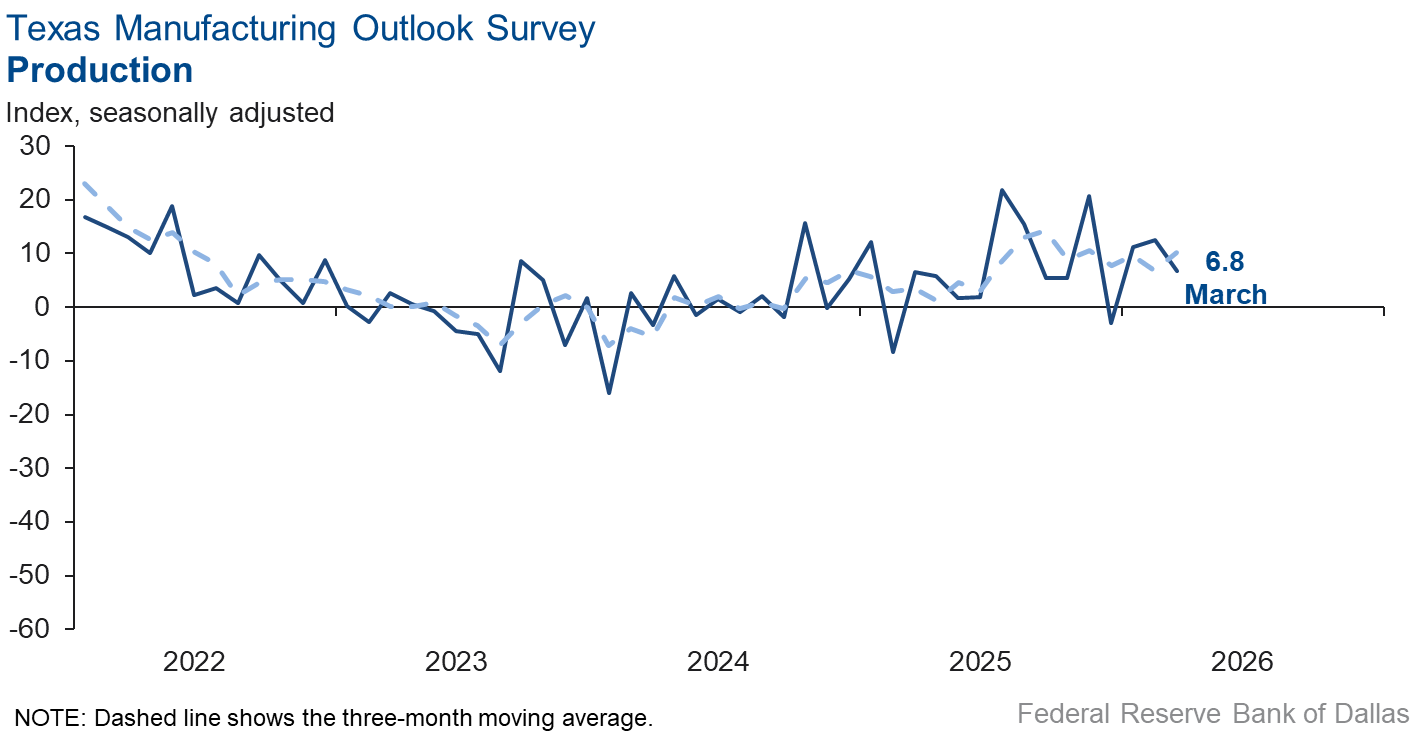
Texas factory activity continued to rise in March, but at a slower pace than the previous month, according to business executives responding to the Texas Manufacturing Outlook Survey. The production index, a key measure of state manufacturing conditions, fell six points to 6.8, a reading suggestive of a below-average pace of output expansion.
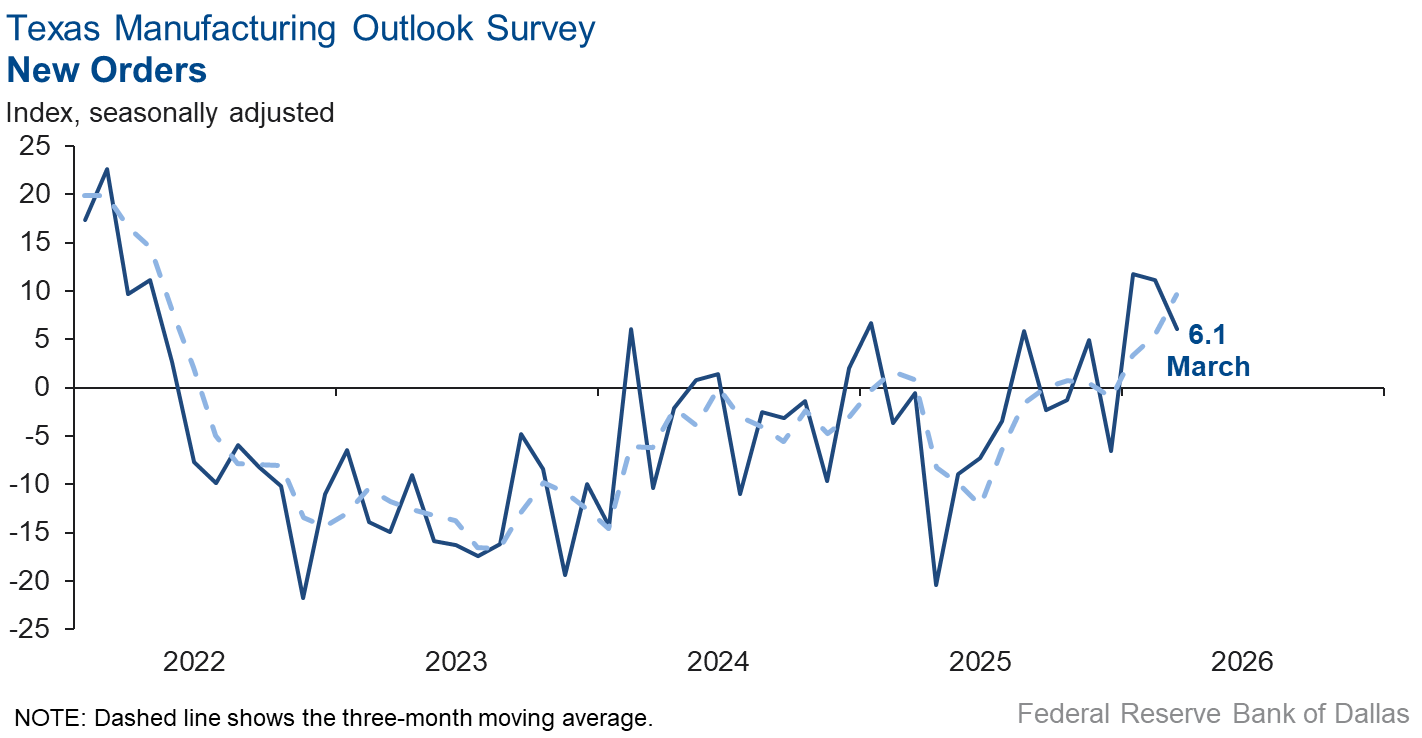
Other measures of manufacturing activity also showed signs of slower growth this month. The capacity utilization index moved down five points to 7.2, the new orders index fell to 6.1 from 11.1, and the shipments index fell eight points to 1.8.
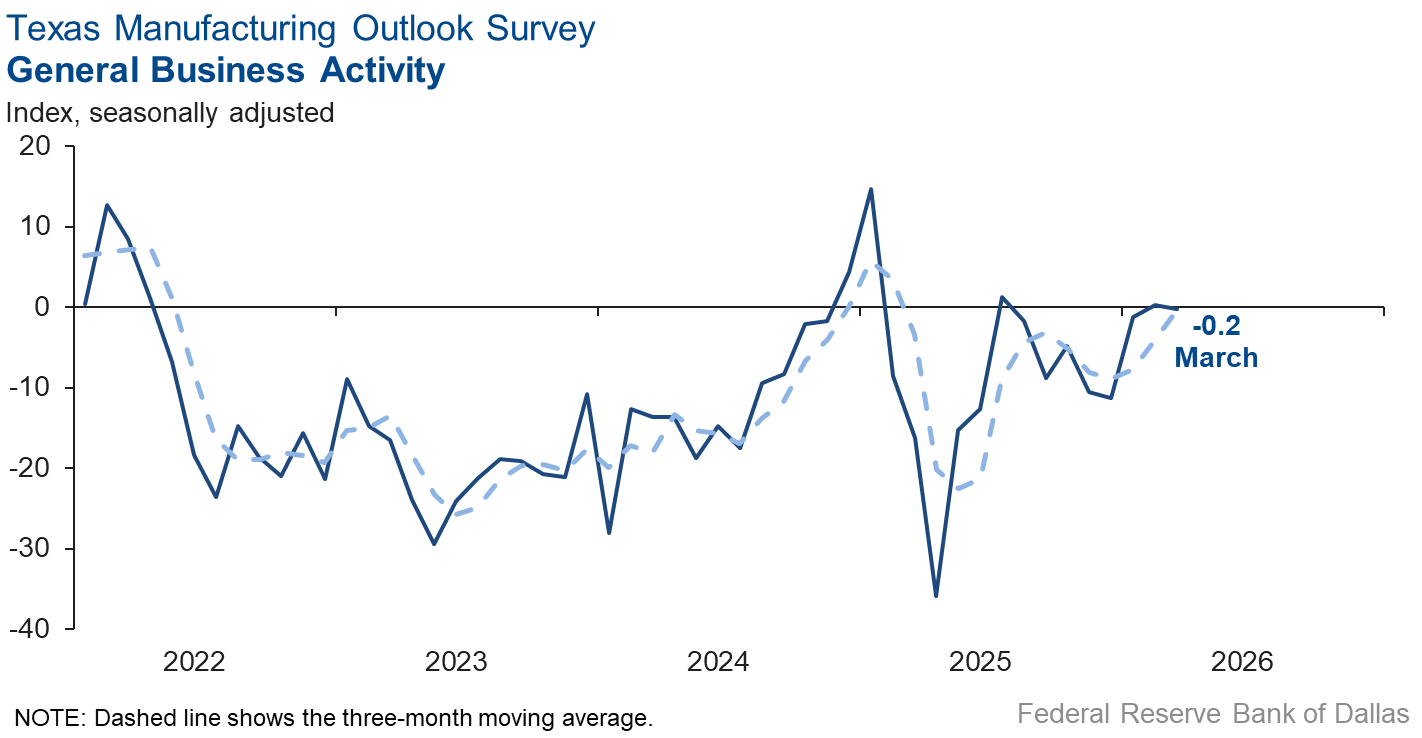
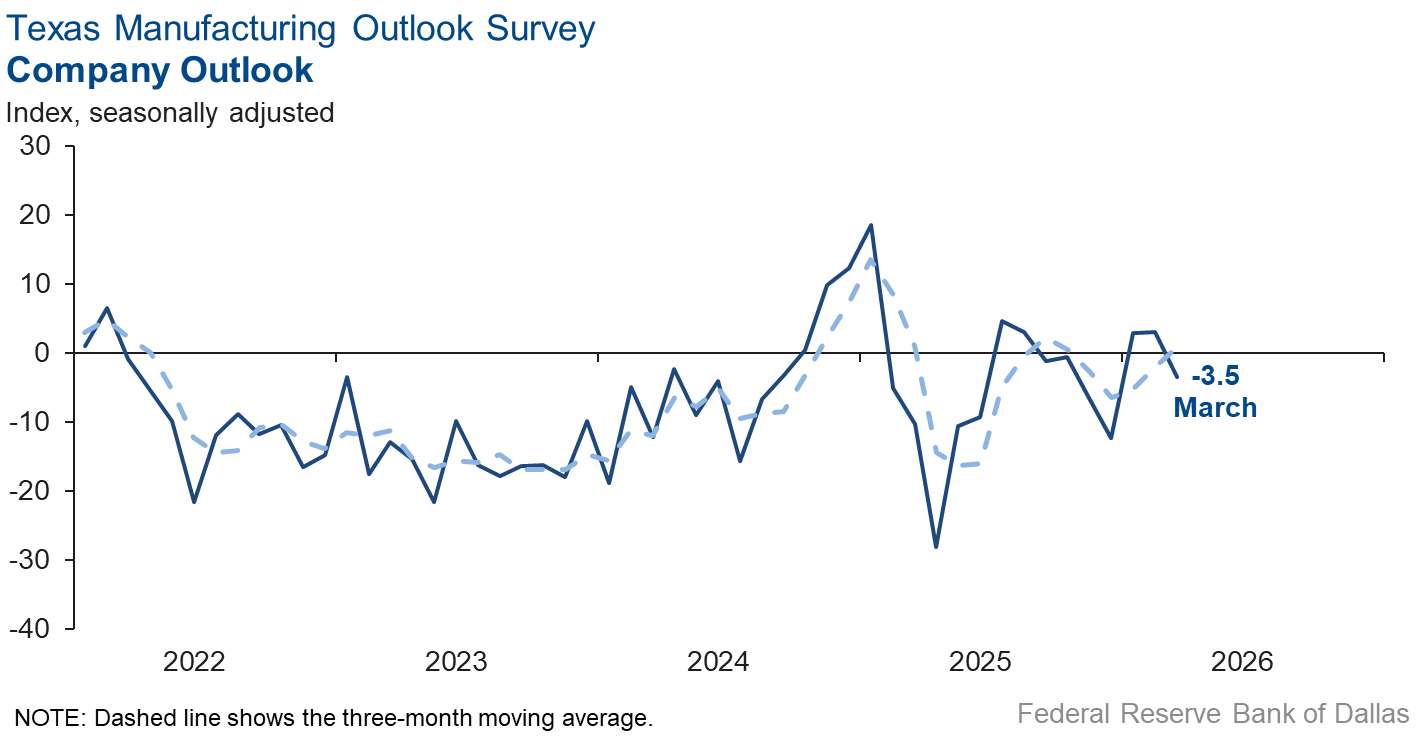
Perceptions of broader business conditions were mixed in March. The general business activity index was relatively unchanged at -0.2, with the near-zero reading indicating no change in business activity from February. However, the company outlook index fell into negative territory dropping nearly seven points to -3.5. The outlook uncertainty index shot up 20 points to 26.0, its highest reading since April 2025.
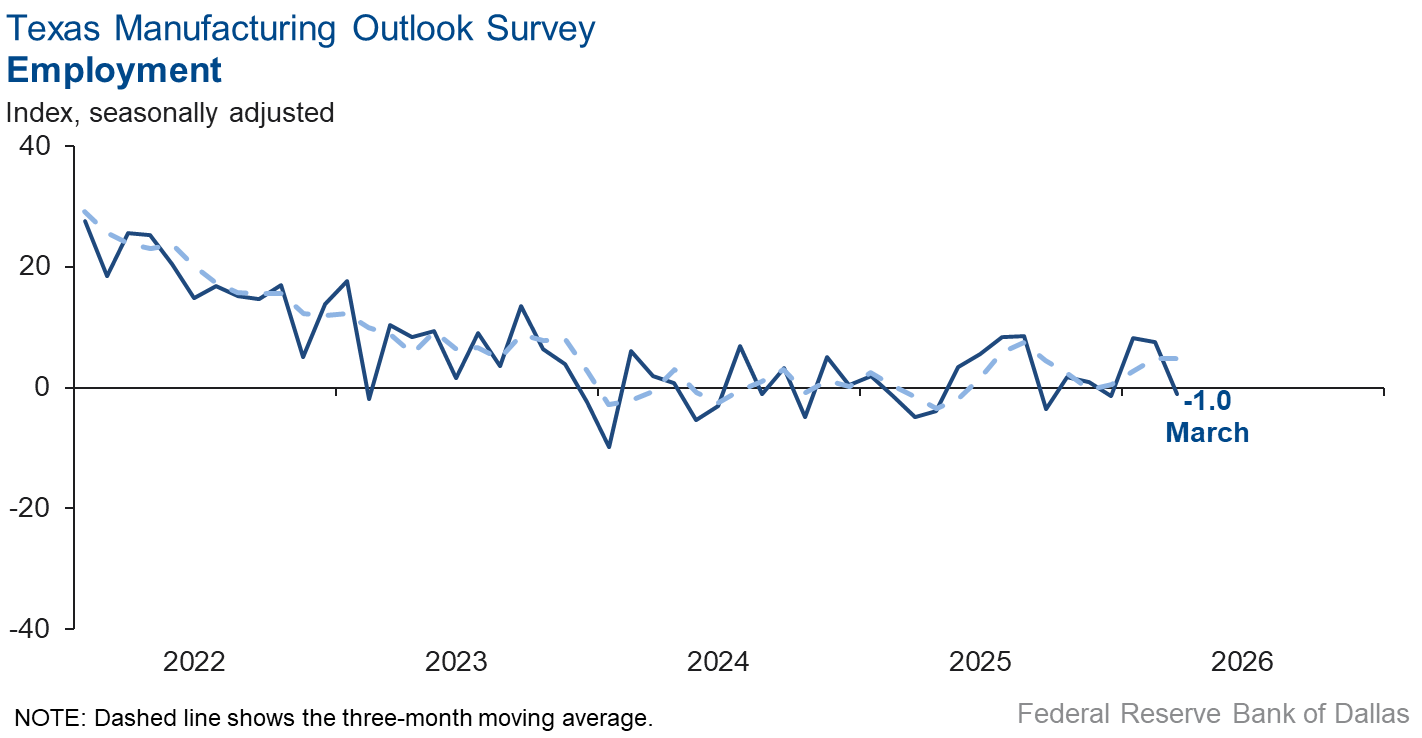
Employment growth stalled and workweeks were flat in March. The employment index came in near zero, with 15 percent of firms noting net hiring and 16 percent of firms noting net layoffs. The hours worked index moved down to 0.9 from 6.1.
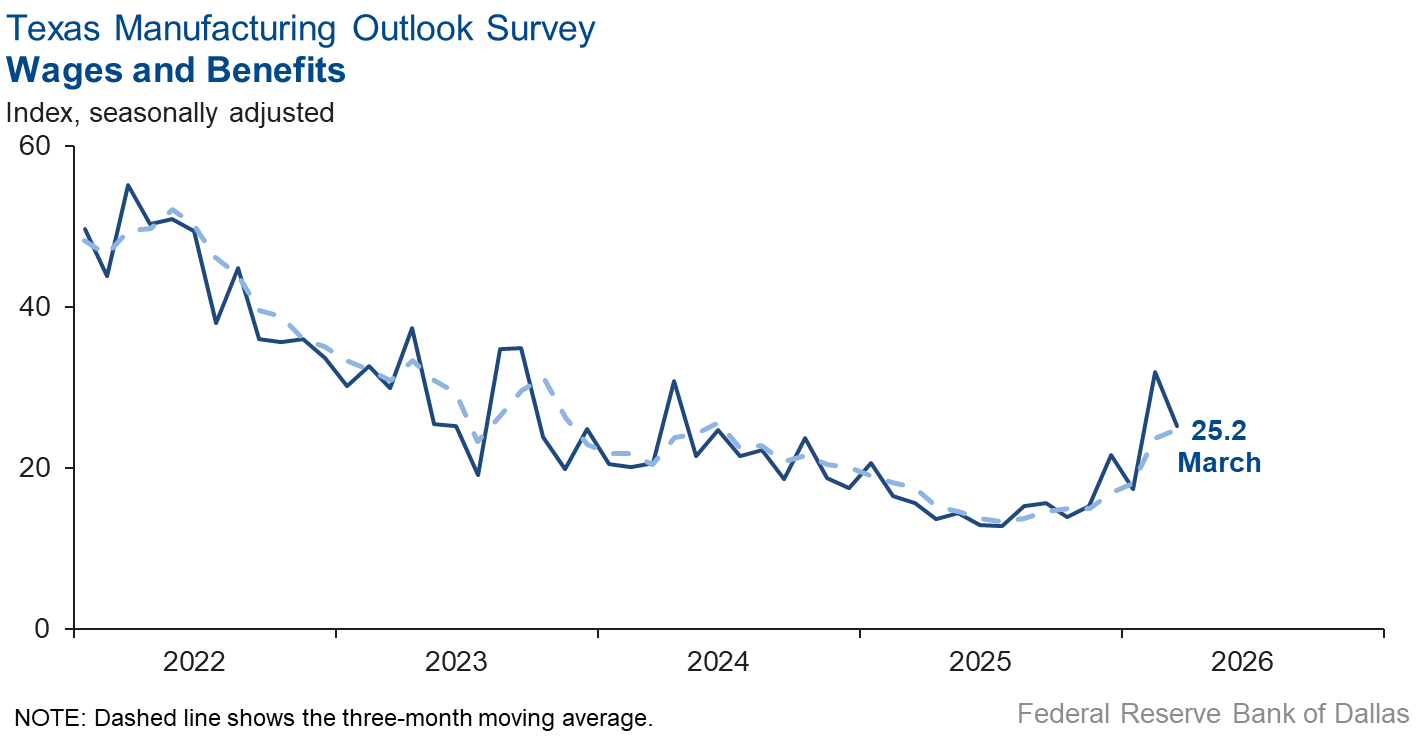
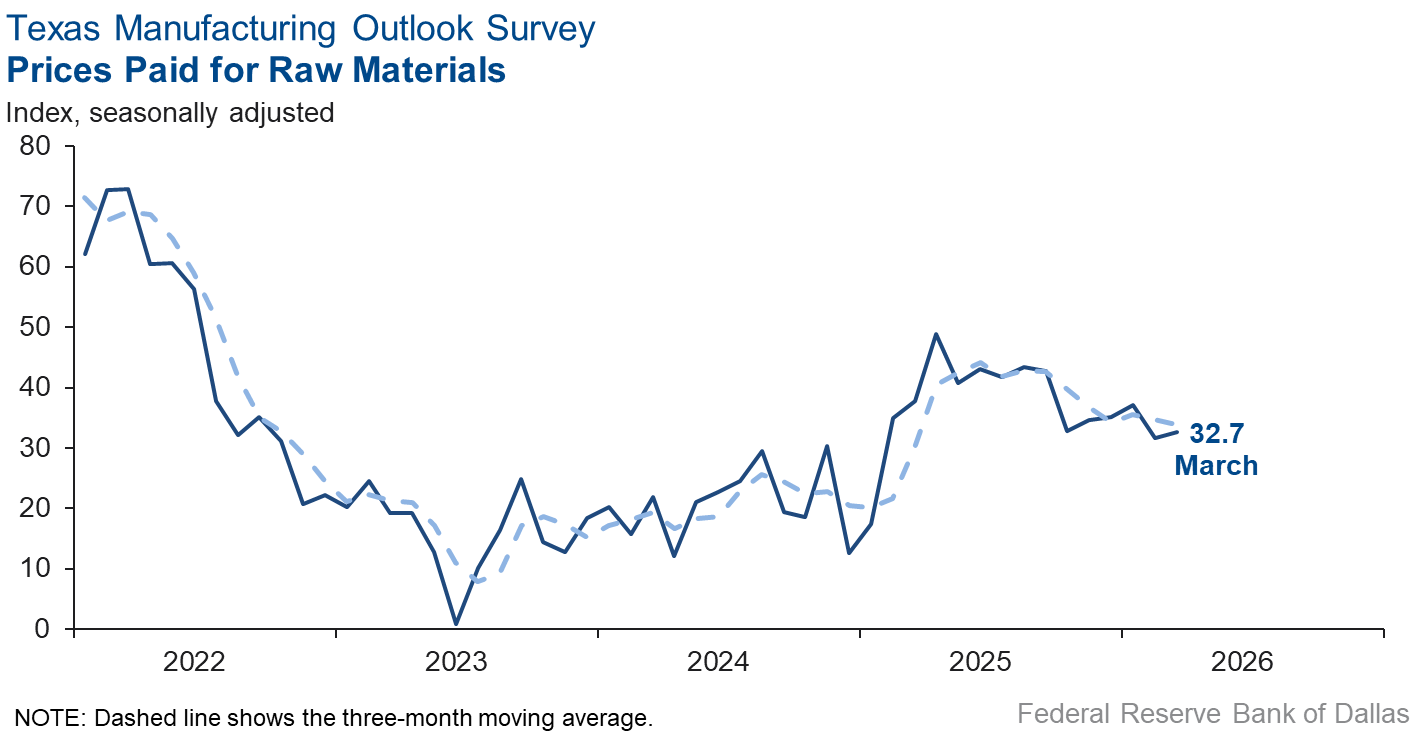
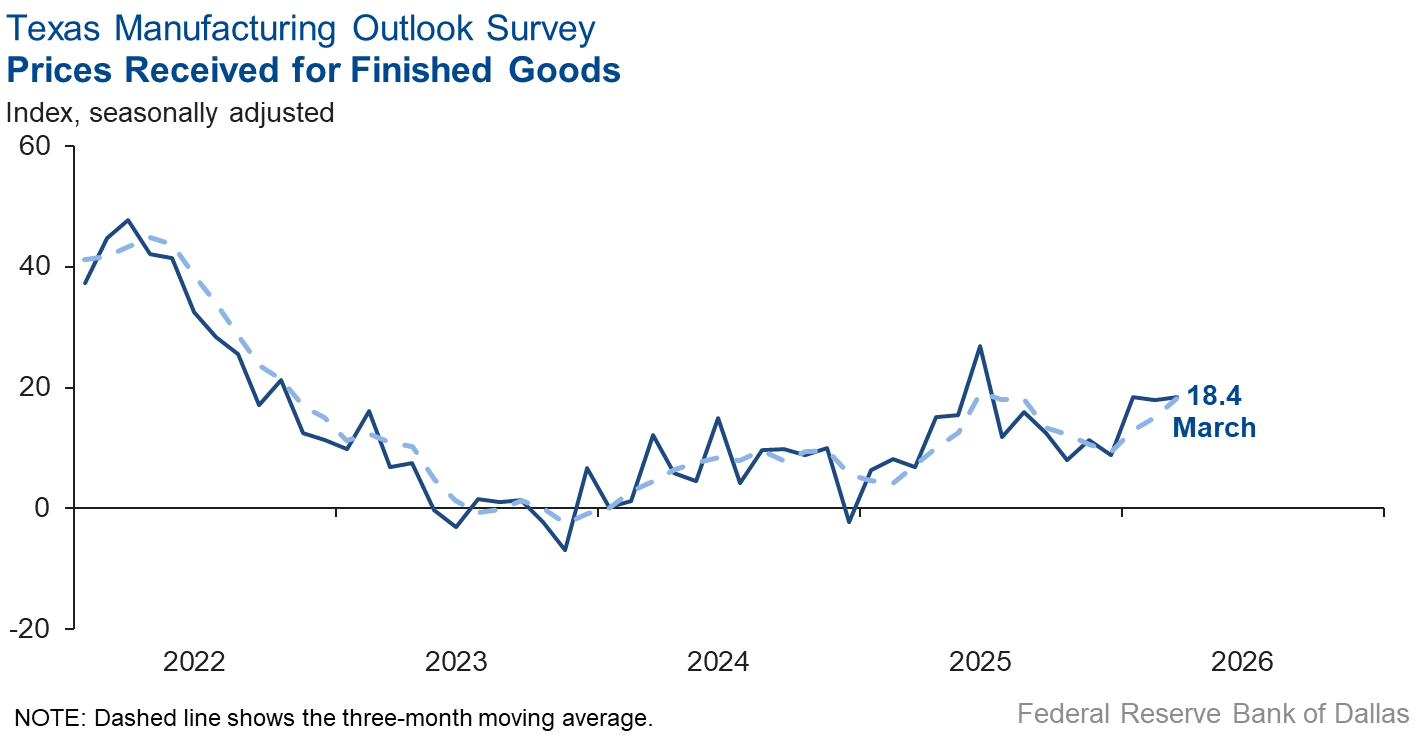
Price pressures were little changed while wages grew at a slower pace than last month. Both the finished goods prices index and the raw materials prices index were relatively unchanged at 18.4 and 32.7, respectively. The wages and benefits index fell to 25.2 from 31.9.
Expectations are for increased manufacturing activity six months from now. The future production index held steady at 35.7, and the future general business activity index remained in positive territory but fell two points to 10.6. Other indexes of future manufacturing activity remained in positive territory and increased.
Next release: Monday, April 27
Data were collected March 17–25, and 79 of the 115 Texas manufacturers surveyed submitted responses. The Dallas Fed conducts the Texas Manufacturing Outlook Survey monthly to obtain a timely assessment of the state’s factory activity. Firms are asked whether output, employment, orders, prices and other indicators increased, decreased or remained unchanged over the previous month.
Survey responses are used to calculate an index for each indicator. Each index is calculated by subtracting the percentage of respondents reporting a decrease from the percentage reporting an increase. When the share of firms reporting an increase exceeds the share reporting a decrease, the index will be greater than zero, suggesting the indicator has increased over the prior month. If the share of firms reporting a decrease exceeds the share reporting an increase, the index will be below zero, suggesting the indicator has decreased over the prior month. An index will be zero when the number of firms reporting an increase is equal to the number of firms reporting a decrease. Data have been seasonally adjusted as necessary.
Results summary
Historical data are available from June 2004 to the most current release month.
| Business Indicators Relating to Facilities and Products in Texas Current (versus previous month) | ||||||||
| Indicator | Mar Index | Feb Index | Change | Series Average | Trend* | % Reporting Increase | % Reporting No Change | % Reporting Decrease |
Production | 6.8 | 12.5 | –5.7 | 9.6 | 3(+) | 22.0 | 62.8 | 15.2 |
Capacity Utilization | 7.2 | 11.8 | –4.6 | 7.4 | 3(+) | 22.0 | 63.2 | 14.8 |
New Orders | 6.1 | 11.1 | –5.0 | 4.7 | 3(+) | 27.7 | 50.7 | 21.6 |
Growth Rate of Orders | 2.2 | 8.6 | –6.4 | –1.2 | 2(+) | 19.7 | 62.8 | 17.5 |
Unfilled Orders | –6.1 | 2.9 | –9.0 | –2.7 | 1(–) | 14.3 | 65.3 | 20.4 |
Shipments | 1.8 | 9.9 | –8.1 | 7.8 | 3(+) | 20.7 | 60.4 | 18.9 |
Delivery Time | 2.8 | 11.6 | –8.8 | 0.6 | 2(+) | 13.9 | 75.0 | 11.1 |
Finished Goods Inventories | –5.0 | 8.9 | –13.9 | –3.3 | 1(–) | 12.7 | 69.6 | 17.7 |
Prices Paid for Raw Materials | 32.7 | 31.7 | +1.0 | 27.7 | 71(+) | 40.6 | 51.5 | 7.9 |
Prices Received for Finished Goods | 18.4 | 17.9 | +0.5 | 8.9 | 15(+) | 24.5 | 69.4 | 6.1 |
Wages and Benefits | 25.2 | 31.9 | –6.7 | 21.0 | 71(+) | 27.3 | 70.6 | 2.1 |
Employment | –1.0 | 7.5 | –8.5 | 7.1 | 1(–) | 15.0 | 69.0 | 16.0 |
Hours Worked | 0.9 | 6.1 | –5.2 | 3.0 | 3(+) | 11.9 | 77.1 | 11.0 |
Capital Expenditures | 5.7 | –0.4 | +6.1 | 6.6 | 1(+) | 15.2 | 75.3 | 9.5 |
| General Business Conditions Current (versus previous month) | ||||||||
| Indicator | Mar Index | Feb Index | Change | Series Average | Trend** | % Reporting Improved | % Reporting No Change | % Reporting Worsened |
Company Outlook | –3.5 | 3.1 | –6.6 | 4.1 | 1(–) | 14.0 | 68.5 | 17.5 |
General Business Activity | –0.2 | 0.2 | –0.4 | 0.2 | 1(–) | 21.0 | 57.8 | 21.2 |
| Indicator | Mar Index | Feb Index | Change | Series Average | Trend* | % Reporting Increase | % Reporting No Change | % Reporting Decrease |
Outlook Uncertainty | 26.0 | 6.5 | +19.5 | 16.9 | 3(+) | 37.7 | 50.6 | 11.7 |
| Business Indicators Relating to Facilities and Products in Texas Future (six months ahead) | ||||||||
| Indicator | Mar Index | Feb Index | Change | Series Average | Trend* | % Reporting Increase | % Reporting No Change | % Reporting Decrease |
Production | 35.7 | 34.3 | +1.4 | 36.0 | 71(+) | 49.3 | 37.2 | 13.6 |
Capacity Utilization | 27.0 | 27.3 | –0.3 | 32.8 | 71(+) | 42.8 | 41.4 | 15.8 |
New Orders | 29.2 | 25.0 | +4.2 | 33.4 | 41(+) | 43.1 | 42.9 | 13.9 |
Growth Rate of Orders | 17.5 | 14.5 | +3.0 | 24.7 | 31(+) | 31.9 | 53.7 | 14.4 |
Unfilled Orders | –0.7 | 5.8 | –6.5 | 2.7 | 1(–) | 11.7 | 75.9 | 12.4 |
Shipments | 28.8 | 31.6 | –2.8 | 34.3 | 71(+) | 43.2 | 42.5 | 14.4 |
Delivery Time | 3.8 | 1.1 | +2.7 | –1.3 | 4(+) | 11.2 | 81.4 | 7.4 |
Finished Goods Inventories | 4.1 | 2.7 | +1.4 | –0.2 | 4(+) | 14.9 | 74.3 | 10.8 |
Prices Paid for Raw Materials | 50.7 | 42.7 | +8.0 | 34.0 | 72(+) | 54.5 | 41.7 | 3.8 |
Prices Received for Finished Goods | 39.2 | 39.5 | –0.3 | 21.7 | 71(+) | 41.9 | 55.4 | 2.7 |
Wages and Benefits | 38.0 | 41.7 | –3.7 | 39.0 | 262(+) | 39.1 | 59.8 | 1.1 |
Employment | 19.5 | 16.8 | +2.7 | 22.7 | 70(+) | 32.7 | 54.1 | 13.2 |
Hours Worked | 1.4 | –0.4 | +1.8 | 8.5 | 1(+) | 13.1 | 75.2 | 11.7 |
Capital Expenditures | 24.8 | 10.7 | +14.1 | 19.4 | 70(+) | 33.0 | 58.8 | 8.2 |
| General Business Conditions Future (six months ahead) | ||||||||
| Indicator | Mar Index | Feb Index | Change | Series Average | Trend** | % Reporting Increase | % Reporting No Change | % Reporting Worsened |
Company Outlook | 18.2 | 25.7 | –7.5 | 18.3 | 11(+) | 35.9 | 46.3 | 17.7 |
General Business Activity | 10.6 | 12.7 | –2.1 | 12.3 | 11(+) | 30.9 | 48.7 | 20.3 |
*Shown is the number of consecutive months of expansion or contraction in the underlying indicator. Expansion is indicated by a positive index reading and denoted by a (+) in the table. Contraction is indicated by a negative index reading and denoted by a (–) in the table.
**Shown is the number of consecutive months of improvement or worsening in the underlying indicator. Improvement is indicated by a positive index reading and denoted by a (+) in the table. Worsening is indicated by a negative index reading and denoted by a (–) in the table.
Data have been seasonally adjusted as necessary.
Comments from survey respondents
Survey participants are given the opportunity to submit comments on current issues that may be affecting their businesses. Some comments have been edited for grammar and clarity.
- We have seen decreases in some of our costs, in particular agricultural raw materials. We have seen increases in the costs of our packaging materials, some of this related to increase in energy costs. We expect the Iran war to cause increases in energy costs for a period extending at least six months and potentially longer. This has increased our uncertainty for the rest of the year.
- The Iran war and bottleneck in the Strait of Hormuz has caused significant supply chain disruption from China, allowing the U.S. chemicals sector to benefit from the supply bottleneck. We believe this to be short-lived and the situation to return to the lower demand levels in the latter half of 2026.
- I am thinking about recommending to our board to close the company.
- We have seen no impact yet from higher fuel prices. However, we expect to see this very soon, as our vendors will increase raw materials prices to include the increased cost for transportation.
- We would like to see lower interest rates throughout this year.
- Continuing confusion at the federal level, illiquid consumer base and falling federal government spending are not helping the food industry.
- High density Hispanic channels are down. Costs are up, and freight is increasing fast. Tariff chaos has wreaked havoc with all of our export customers and seasoning suppliers.
- We are worried about costs increasing due to fuel price increases. We are worried about a slowdown in the economy due to geopolitics.
- The Iran war and impact on energy prices are concerns as consumers have to deal with the rapid increase in energy cost. Hopefully it will moderate as the conflict curtails. That said, the more demoralizing impact of the constant circus out of Washington and inability to fund critical infrastructure like TSA is killing the animal spirits of our economy.
- We are beating our competition due to the continued vertical integration plans that we are focused on implementing and improving. This requires a great deal of planning and money, but the payout is very sound.
- Spring has sprung. It’s truly like the balm of Gilead. After an extended period of ailment and woe, the healing has occurred and we are on our way to greater things. Our business growth thus far in 2026 is like a sweet fragrance that is healing our loss and hardship from prior years.
- We are still seeing strong business activity with our backlog increasing.
- Our company is seeing an increase in activity totally unrelated to the current geopolitical conditions. The effect of uncertainty delayed the start of a new manufacturing project in the U.S. (tariffs, capital expenditures) in 2025. Project 2025 is underway with a six-month delay and scaled back to accommodate a less ambitious picture for 2026. We are still recovering from 2025 plus a more conservative outlook for 2026. Things are trending upward in our field but at a much slower pace.
- Many external factors contributing to an unstable market.
- If we could get our tariff reimbursement back, that would put us in a position to invest in growth. Without it, though, we don't have the capital to invest in growth.
- We are waiting for home building activity to pick up, which is dependent upon interest rates.
- Overall business still slow. Have achieved limited price reductions in some raw materials that are in an oversupply condition but not enough to keep up with the decline in selling prices of our products. We still see upward pressure on labor and benefits cost. Margins are reduced from 12 months ago.
- Importing from China is precarious. The costs of product and freight are higher and slower. Suppliers are apprehensive. Their costs are increasing, especially a certain raw material plastic impacted by petrochemicals affected by cost of oil.
- We have been stupid slow recently, slower than we can recall in many years. We continue to believe it’s from the chaos and confusion coming out of Washington. In addition, now with the Iran war, prices are going to shoot up due to shipping costs, and tariffs are still in effect. So, there is no telling when business will start to improve. We have some nice work coming in soon, but it's work we knew was coming. We are seeing some improvement in our estimating backlog, which is a good sign of better days to come. The war is causing a disruption of raw materials prices as we are producing plastic-based products, virtually all of our raw materials are hydrocarbon based. Fifteen percent increases are normal.
Historical Data
Historical data can be downloaded dating back to June 2004.
Indexes
Download indexes for all indicators. For the definitions of all variables, see Data Definitions.
| Unadjusted |
| Seasonally adjusted |
All Data
Download indexes and components of the indexes (percentage of respondents reporting increase, decrease, or no change). For the definitions of all variables, see Data Definitions.
| Unadjusted |
| Seasonally adjusted |
Special questions
For this month’s survey, Texas business executives were asked supplemental questions on wages, prices and outlook concerns. Results below include responses from participants from both the Texas Manufacturing Outlook Survey and Texas Service Sector Outlook Survey. View individual survey results.
Questions regarding the Texas Business Outlook Surveys can be addressed to Jesus Cañas.
Sign up for our email alert to be automatically notified as soon as the latest Texas Manufacturing Outlook Survey is released on the web.