
Texas Service Sector Outlook Survey
Growth resumes in Texas service sector activity, company outlook improves
For this month’s survey, Texas business executives were asked supplemental questions on expected demand and hiring. Results for these questions from the Texas Manufacturing Outlook Survey, Texas Service Sector Outlook Survey and Texas Retail Outlook Survey have been released together. Read the special questions results.
This month’s data release also includes annual seasonal factor revisions. Once per year, the Federal Reserve Bank of Dallas revises the historical data for the Texas Service Sector Outlook Survey after calculating new seasonal adjustment factors. Annual seasonal revisions result in slight changes in the seasonally adjusted series. Read more information on seasonal adjustment.
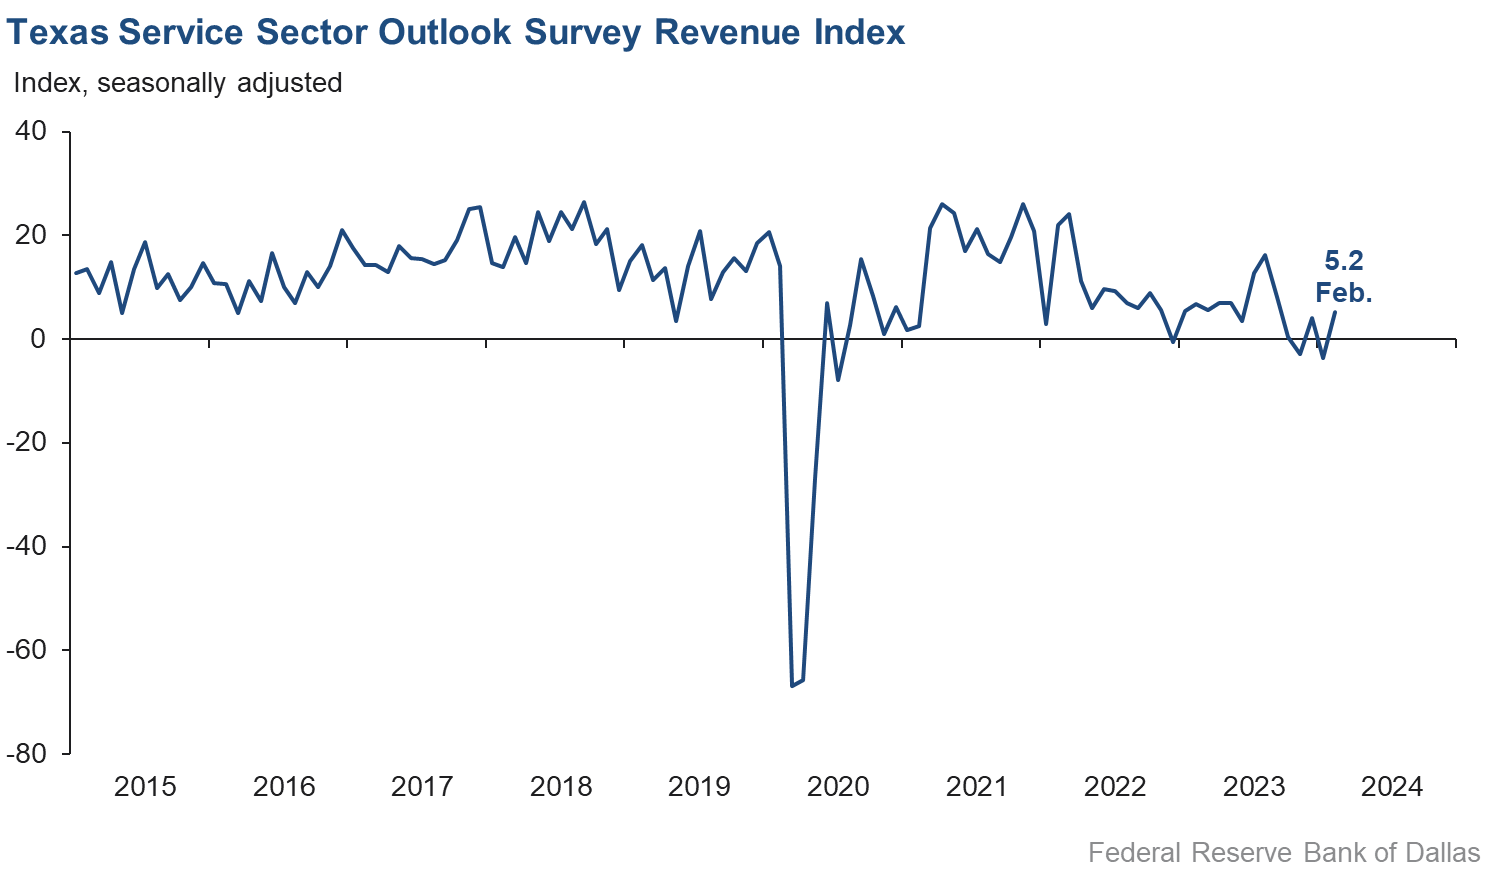
Texas service sector activity expanded in February after contracting in January, according to business executives responding to the Texas Service Sector Outlook Survey. The revenue index, a key measure of state service sector conditions, increased nine points to 5.2.
Labor market measures suggest continued employment growth but no growth in work weeks. The employment index held steady at 3.8 in February. The part-time employment index increased three points to 2.8, while the hours worked index moved up from -4.5 to 0.3.
Respondents in February continued to perceive worsening broader business conditions, but their outlook improved. The general business activity index remained negative but rose five points to -3.9. The company outlook index moved up to positive territory from -4.9 to 3.8, and the outlook uncertainty index fell eight points to 6.7, its lowest level since mid-2021.
Input and selling price pressure remained largely unchanged, while wage growth eased slightly in February. Both the input prices and selling prices indexes were mostly unchanged at 34.3 and 7.7, respectively. While input price growth continues above average, selling price growth is now at its historical average. The wages and benefits index fell two points to 15.4.
Respondents’ expectations regarding future business activity continued to reflect optimism in February. The future general business activity index increased from 4.6 to 12.0, and the future revenue index held steady at 37.8. Other future service-sector activity indexes such as employment and capital expenditures remained in firmly positive territory, reflecting expectations for continued growth in the next six months.

Texas Retail Outlook Survey
Texas retail sales fall, but at a slower rate than the previous month
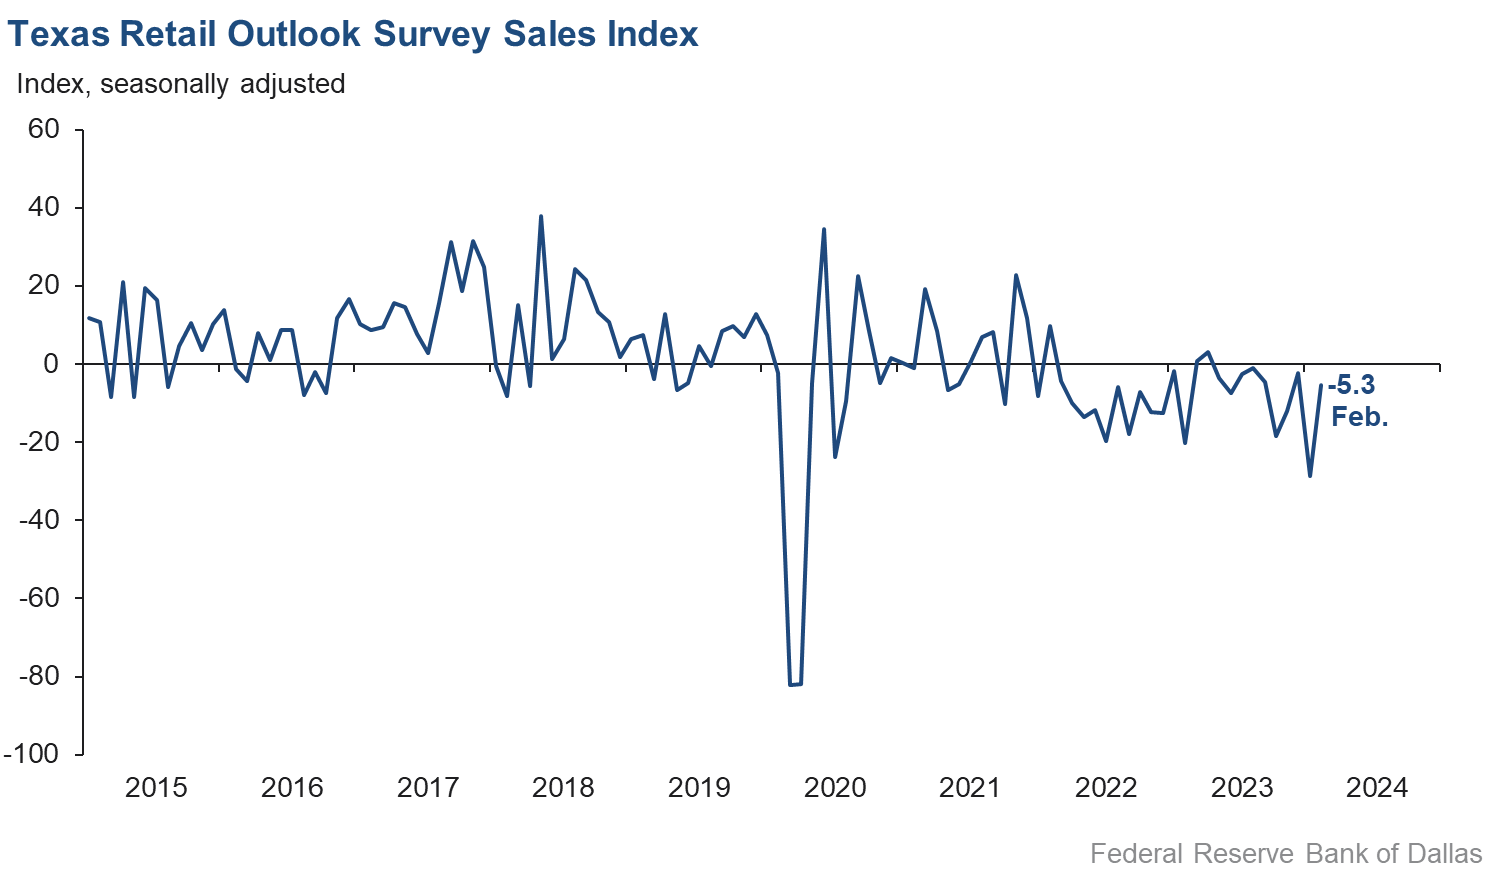
Retail sales activity declined in February, but at a considerably slower pace than last month, according to business executives responding to the Texas Retail Outlook Survey. The sales index, a key measure of state retail activity, jumped from -28.6 to -5.3, indicating retail sales fell at a considerably slower rate than the previous month. Retailers’ inventories grew over the month, with the February index at 18.9.
Retail labor market indicators reflected employment growth but shorter workweeks in February. The employment index increased from -8.4 to 2.4, and the part-time employment index moved up nine points to 4.5. The hours worked index increased from -16.9 to -4.6.
Retailers continued to perceive a worsening of broader business conditions in February, but pessimism waned. The general business activity index increased from -25.4 to -18.0, while the company outlook index moved up 13 points to -5.0. The outlook uncertainty index fell six points to 9.5.
Input price and selling price pressure eased while wage pressure increased slightly in February. The input price index fell 11 points to 22.3 while the selling price index fell from 8.5 to 3.8, its lowest level since mid-2020. The wages and benefits index ticked up four points to 12.9.
Expectations for future retail growth were mixed in February. The future general business activity index increased from -9.3 to -0.9. The near-zero reading suggests little change in perceptions about broader business conditions from last month. The future sales index fell ten points but remained in positive territory at 8.7. Other indexes of future retail activity such as employment and capital expenditures were positive, reflecting expectations for continued retail sales growth in the next six months.
Next release: March 26, 2024
Data were collected Feb. 13–21, and 273 of the 412 Texas service sector business executives surveyed submitted a response. The Dallas Fed conducts the Texas Service Sector Outlook Survey monthly to obtain a timely assessment of the state’s service sector activity. Firms are asked whether revenue, employment, prices, general business activity and other indicators increased, decreased or remained unchanged over the previous month.
Survey responses are used to calculate an index for each indicator. Each index is calculated by subtracting the percentage of respondents reporting a decrease from the percentage reporting an increase. When the share of firms reporting an increase exceeds the share reporting a decrease, the index will be greater than zero, suggesting the indicator has increased over the prior month. If the share of firms reporting a decrease exceeds the share reporting an increase, the index will be below zero, suggesting the indicator has decreased over the prior month. An index will be zero when the number of firms reporting an increase is equal to the number of firms reporting a decrease.
Data have been seasonally adjusted as necessary.
Texas Service Sector Outlook Survey
Historical data are available from January 2007 to the most current release month.
| Business Indicators Relating to Facilities and Products in Texas Current (versus previous month) | ||||||||
| Indicator | Feb Index | Jan Index | Change | Series Average | Trend* | % Reporting Increase | % Reporting No Change | % Reporting Decrease |
Revenue | 5.2 | –3.6 | +8.8 | 10.7 | 1(+) | 27.8 | 49.7 | 22.6 |
Employment | 3.8 | 2.5 | +1.3 | 6.4 | 4(+) | 15.4 | 73.0 | 11.6 |
Part–Time Employment | 2.8 | –0.6 | +3.4 | 1.5 | 1(+) | 7.9 | 87.0 | 5.1 |
Hours Worked | 0.3 | –4.5 | +4.8 | 2.7 | 1(+) | 7.9 | 84.5 | 7.6 |
Wages and Benefits | 15.4 | 17.0 | –1.6 | 15.8 | 45(+) | 19.2 | 77.0 | 3.8 |
Input Prices | 34.3 | 33.6 | +0.7 | 28.0 | 46(+) | 37.0 | 60.3 | 2.7 |
Selling Prices | 7.7 | 8.7 | –1.0 | 7.7 | 43(+) | 16.7 | 74.2 | 9.0 |
Capital Expenditures | 10.3 | 6.0 | +4.3 | 10.0 | 43(+) | 17.6 | 75.1 | 7.3 |
| General Business Conditions Current (versus previous month) | ||||||||
| Indicator | Feb Index | Jan Index | Change | Series Average | Trend** | % Reporting Improved | % Reporting No Change | % Reporting Worsened |
Company Outlook | 3.8 | –4.9 | +8.7 | 4.5 | 1(+) | 16.8 | 70.3 | 13.0 |
General Business Activity | –3.9 | –9.3 | +5.4 | 2.5 | 21(–) | 14.6 | 66.9 | 18.5 |
| Indicator | Feb Index | Jan Index | Change | Series Average | Trend* | % Reporting Increase | % Reporting No Change | % Reporting Decrease |
Outlook Uncertainty | 6.7 | 14.7 | –8.0 | 13.5 | 33(+) | 18.6 | 69.6 | 11.9 |
| Business Indicators Relating to Facilities and Products in Texas Future (six months ahead) | ||||||||
| Indicator | Feb Index | Jan Index | Change | Series Average | Trend* | % Reporting Increase | % Reporting No Change | % Reporting Decrease |
Revenue | 37.8 | 36.7 | +1.1 | 37.4 | 46(+) | 48.6 | 40.6 | 10.8 |
Employment | 20.9 | 17.0 | +3.9 | 23.2 | 46(+) | 30.9 | 59.1 | 10.0 |
Part–Time Employment | 6.8 | 8.9 | –2.1 | 6.7 | 20(+) | 11.4 | 84.0 | 4.6 |
Hours Worked | 5.5 | 3.5 | +2.0 | 5.9 | 46(+) | 10.8 | 83.9 | 5.3 |
Wages and Benefits | 33.7 | 32.5 | +1.2 | 37.4 | 46(+) | 37.7 | 58.3 | 4.0 |
Input Prices | 40.3 | 44.3 | –4.0 | 44.7 | 206(+) | 45.9 | 48.5 | 5.6 |
Selling Prices | 22.5 | 25.3 | –2.8 | 24.7 | 46(+) | 32.1 | 58.3 | 9.6 |
Capital Expenditures | 18.1 | 18.5 | –0.4 | 23.0 | 45(+) | 25.0 | 68.1 | 6.9 |
| General Business Conditions Future (six months ahead) | ||||||||
| Indicator | Feb Index | Jan Index | Change | Series Average | Trend** | % Reporting Improved | % Reporting No Change | % Reporting Worsened |
Company Outlook | 15.6 | 8.6 | +7.0 | 15.5 | 4(+) | 27.2 | 61.2 | 11.6 |
General Business Activity | 12.0 | 4.6 | +7.4 | 12.1 | 3(+) | 27.2 | 57.6 | 15.2 |
Historical data are available from January 2007 to the most current release month.
| Business Indicators Relating to Facilities and Products in Texas Retail (versus previous month) | ||||||||
| Indicator | Feb Index | Jan Index | Change | Series Average | Trend* | % Reporting Increase | % Reporting No Change | % Reporting Decrease |
| Retail Activity in Texas | ||||||||
Sales | –5.3 | –28.6 | +23.3 | 3.8 | 10(–) | 27.6 | 39.4 | 32.9 |
Employment | 2.4 | –8.4 | +10.8 | 1.8 | 1(+) | 10.2 | 82.0 | 7.8 |
Part–Time Employment | 4.5 | –4.0 | +8.5 | –1.5 | 1(+) | 10.5 | 83.5 | 6.0 |
Hours Worked | –4.6 | –16.9 | +12.3 | –2.0 | 2(–) | 7.1 | 81.2 | 11.7 |
Wages and Benefits | 12.9 | 8.5 | +4.4 | 11.2 | 43(+) | 15.7 | 81.5 | 2.8 |
Input Prices | 22.3 | 33.4 | –11.1 | 22.8 | 46(+) | 34.1 | 54.1 | 11.8 |
Selling Prices | 3.8 | 8.5 | –4.7 | 13.8 | 45(+) | 25.9 | 52.0 | 22.1 |
Capital Expenditures | 12.6 | 2.5 | +10.1 | 7.9 | 3(+) | 20.3 | 72.0 | 7.7 |
Inventories | 18.9 | 9.1 | +9.8 | 2.7 | 4(+) | 35.0 | 48.9 | 16.1 |
| Companywide Retail Activity | ||||||||
Companywide Sales | –12.6 | –23.2 | +10.6 | 5.0 | 6(–) | 20.6 | 46.3 | 33.2 |
Companywide Internet Sales | –11.8 | –16.9 | +5.1 | 4.1 | 6(–) | 9.6 | 69.0 | 21.4 |
| General Business Conditions, Retail Current (versus previous month) | ||||||||
| Indicator | Feb Index | Jan Index | Change | Series Average | Trend** | % Reporting Improved | % Reporting No Change | % Reporting Worsened |
Company Outlook | –5.0 | –17.8 | +12.8 | 1.9 | 5(–) | 9.7 | 75.6 | 14.7 |
General Business Activity | –18.0 | –25.4 | +7.4 | –2.1 | 8(–) | 5.9 | 70.2 | 23.9 |
| Outlook Uncertainty Current (versus previous month) | ||||||||
| Indicator | Feb Index | Jan Index | Change | Series Average | Trend* | % Reporting Increase | % Reporting No Change | % Reporting Decrease |
Outlook Uncertainty | 9.5 | 15.8 | –6.3 | 11.4 | 3(+) | 17.0 | 75.5 | 7.5 |
| Business Indicators Relating to Facilities and Products in Texas, Retail Future (six months ahead) | ||||||||
| Indicator | Feb Index | Jan Index | Change | Series Average | Trend* | % Reporting Increase | % Reporting No Change | % Reporting Decrease |
| Retail Activity in Texas | ||||||||
Sales | 8.7 | 19.1 | –10.4 | 30.6 | 9(+) | 27.7 | 53.3 | 19.0 |
Employment | 9.3 | 11.4 | –2.1 | 12.9 | 14(+) | 14.4 | 80.5 | 5.1 |
Part–Time Employment | 5.8 | 11.9 | –6.1 | 1.6 | 3(+) | 9.8 | 86.2 | 4.0 |
Hours Worked | –8.0 | 2.2 | –10.2 | 2.5 | 1(–) | 0.2 | 91.6 | 8.2 |
Wages and Benefits | 22.5 | 25.4 | –2.9 | 29.0 | 46(+) | 23.0 | 76.5 | 0.5 |
Input Prices | 14.0 | 39.2 | –25.2 | 34.0 | 46(+) | 28.0 | 58.0 | 14.0 |
Selling Prices | 2.0 | 21.2 | –19.2 | 29.1 | 46(+) | 27.5 | 47.1 | 25.5 |
Capital Expenditures | 5.4 | 11.5 | –6.1 | 16.9 | 3(+) | 14.0 | 77.4 | 8.6 |
Inventories | 8.6 | 3.6 | +5.0 | 10.7 | 4(+) | 25.7 | 57.2 | 17.1 |
| Companywide Retail Activity | ||||||||
Companywide Sales | 8.0 | 1.9 | +6.1 | 29.2 | 9(+) | 22.6 | 62.8 | 14.6 |
Companywide Internet Sales | 5.3 | 0.0 | +5.3 | 21.3 | 1(+) | 15.8 | 73.7 | 10.5 |
| General Business Conditions, Retail Future (six months ahead) | ||||||||
| Indicator | Feb Index | Jan Index | Change | Series Average | Trend** | % Reporting Improved | % Reporting No Change | % Reporting Worsened |
Company Outlook | 4.2 | –1.7 | +5.9 | 15.1 | 1(+) | 16.7 | 70.8 | 12.5 |
General Business Activity | –0.9 | –9.3 | +8.4 | 10.5 | 6(–) | 17.5 | 64.1 | 18.4 |
*Shown is the number of consecutive months of expansion or contraction in the underlying indicator. Expansion is indicated by a positive index reading and denoted by a (+) in the table. Contraction is indicated by a negative index reading and denoted by a (–) in the table.
**Shown is the number of consecutive months of improvement or worsening in the underlying indicator. Improvement is indicated by a positive index reading and denoted by a (+) in the table. Worsening is indicated by a negative index reading and denoted by a (–) in the table.
Data have been seasonally adjusted as necessary.
Texas Service Sector Outlook Survey
Texas Retail Outlook Survey
Texas Service Sector Outlook Survey
Comments from survey respondents
These comments are from respondents’ completed surveys and have been edited for publication.
- Our 2023 revenue declined 15 percent, January 2024 revenue fell 7 percent, and February is currently on track to decline 9 percent.
- People are still buying our services—plenty of business.
- Political uncertainties and lack of bipartisanship in Congress may lead to negative business and consumer confidence, and consequentially, to potential impact on sensitive sectors of the economy.
- The higher interest rates have stalled or killed about 50 percent to 70 percent of the development deals in my developer and contractor (client) pipeline. It takes 18 to 24 months of efforts to get deals to kick off. This year, 2024, will be OK (because of the efforts in 2022 and 2023,) and current and existing backlogs. But if interest rates don't fall, 2025 and 2026 will be dry and will create a great deal of stress in the development, construction and contractor environment. We all know that high inflation is not good, but the current situation is highly concerning.
- Our business relies on long-haul truckers needing repairs. With the current slow shipping, our business is down 30 percent from last year. Many of our customer are foregoing repairs and just trying to keep trucks running as long as they can. This makes our business slow, as we rely on doing the repairs for income.
- Domestic political uncertainty remains a key risk.
- The trucking industry is in its own bubble due to overcapacity. The uncertainty is improving, since many trucking companies are going out of business. This is resulting in more favorable conditions for those of us who remain. However, it is anticipated that this capacity correction will continue over the next year, and the outlook for our industry will improve only slightly through this period.
- There’s a good deal of mergers and acquisitions activity seen in the market, with discussions and more firm opportunity to participate.
- The uncertainty of the banks is tied directly to the proposed additional regulatory burden. The volume of expanded requirements creates higher costs for all banks and ultimately negatively impacts the customers of community banks. The government has been responsible for adding the most employees of any segment of the economy with what seems to be the express purpose of expanding regulatory oversight.
- The feeling throughout the branch and the real estate industry in general is the dark days are behind us and the market will improve. This means lower interest rates, more active homebuyers and an increase in existing home inventory. If the inflation data does not have positive news or the Federal Reserve decides to walk back their plans for rate cuts, then our outlook on the future will certainly change for the worse. It's important to pay close attention to economic reports leading up to the FOMC meeting in March.
- We saw significant weakness in foreign export shipments in January, so we are carefully watching. Low water in the Panama Canal, conflict in the Red Sea and domestic politics are creating uncertainty in the oil and gas markets and foreign sources of demand.
- January was one of the weakest months we have seen in some time. Weather may have had a role in the result. Hopefully we will see momentum start to kick in, but recent inflation news is not good for future business.
- Old fashioned customer service provided by caring humans is back. We are increasingly taking business away from competitors that went all in on processes and tech solutions. In the end, it's simpler, cheaper and gets better results.
- We expect an improving business environment in the third and fourth quarters. Our positive outlook corresponds to an expectation of decreases in the fed funds rate.
- The real estate market is at a standstill due to the volatility in interest rates and inflation. Until we know where interest rates are headed, there is no way to pro forma the cost of construction or the value of assets. Hopefully, inflation will continue to decrease, and the Fed will be able to start cutting rates.
- The economy is slowing down. Car sales are down and since we are in this industry, our sales are down as well.
- High interest rates are severely impacting the cash flow of many of our clients. With no money, they can't spend on our services.
- The temporary stop of new LNG export permits will probably slow some projects. We are moderately pessimistic on the next six to 12 months, which has not changed in the past year. We are concerned about new regulations facing fossil fuel clients and investors and also about the 2024 election.
- The increase in employees is because we are still looking to hire a position that we have needed for months. We are having difficulty finding qualified engineers.
- Activity in the industrial market is improving. Housing and multi-family are also picking up. Pressure on wages has decreased, however, we gave a 10 to 15 percent universal raise mid-year 2023, which seems to have stabilized our labor at the lower end.
- A shortage of experienced workers is hampering growth with not much hope for improvement in the near future.
- January started with stronger hiring, but February has hit a pause again. Client companies that have historically hired during this time and are now hitting the brakes. Candidates are reluctant to engage in considering a new role due to the uncertainty, so for the companies that are hiring, it's tough to get a strong candidate to be interested.
- While we feel the budgets of our clients have tightened, we still believe in our business model and that we can take over the market with the right tools.
- Lower interest rates, improving economic conditions and continuing strength of the labor market are driving local business activity.
- Washington dysfunction is increasing, which creates uncertainty.
- The corporate aircraft sector has increased sales since December 2023. This is a normal uptick for our company. Budgets are allocated and are being spent by Feb. 1. The oil and gas sector has remained steady.
- The increase in uncertainty is due to state policy changes and leadership turnover more than economic conditions.
- We are having to edit our orders before they ship due to carrying forward too much inventory. We are getting pushback from brands and vendors when doing this.
- Lots of macroeconomic issues are very concerning to us. Government debt, shipping issues and war in the Middle East, credit card debt, out-of-control undocumented immigration. We are concerned about what will happen beyond the next six months.
- There are mixed signals in our market, but we think 2024 will be a better year than 2023, mainly because of measures the company has taken to improve productivity and profits.
- We are seeing uncertainty in the oil and gas markets due to possible recession in the global market, unrest with Ukraine and the Middle East and increasing regulations from the federal government. We are also seeing many mergers and acquisitions activities, which are going to change our markets.
- If the Federal Reserve lowers interest rates, it will signal that the economy is healthy, and inflation has been reigned in. A healthy economy will give people the confidence to spend money, and they will be more inclined to eat out. That's good for our business.
- Weather was a huge factor in January. Feet-in-the-door was an issue.
- Input prices continue to increase 5 percent to 6 percent annually. Labor costs are also up, and inflation continues increasing.
- It’s difficult to predict from week to week. If January was an indication of what to expect in 2024, we are in trouble. Our sales are down and expenses up. Profits are down more than 30 percent. Inventory is back to near pre-COVID levels, and interest rates are too high. The business model mirrors 2019 more so than 2020–23, but expenses are significantly higher.
- Our retail buyer is showing a lot of resiliency, and business continues to be steady despite affordability issues.
- There’s continued softness in back-to-office and business travel, with no improvement in sight. Input costs continue to increase, and we haven't seen the softening in labor rates. We're able to hire a bit better; however, new employees are simply unwilling to put forth the effort and attitude our customers have come to expect from us. These are perhaps the most difficult years in my career.
- We still see increased input prices, and we do not see this slowing down anytime within the next six months.
- We are seeing drops in customer traffic at the restaurants.
Historical Data
Historical data can be downloaded dating back to January 2007.
Indexes
Download indexes for all indicators. For the definitions of all variables, see data definitions.
Texas Service Sector Outlook Survey |
Texas Retail Outlook Survey |
| Unadjusted | Unadjusted |
| Seasonally adjusted | Seasonally adjusted |
All Data
Download indexes and components of the indexes (percentage of respondents reporting increase, decrease, or no change). For the definitions of all variables, see data definitions.
Texas Service Sector Outlook Survey |
Texas Retail Outlook Survey |
| Unadjusted | Unadjusted |
| Seasonally adjusted | Seasonally adjusted |
Questions regarding the Texas Service Sector Outlook Survey can be addressed to Jesus Cañas at jesus.canas@dal.frb.org.
Sign up for our email alert to be automatically notified as soon as the latest Texas Service Sector Outlook Survey is released on the web.