
Texas Service Sector Outlook Survey
Texas service sector activity falters amid increased uncertainty
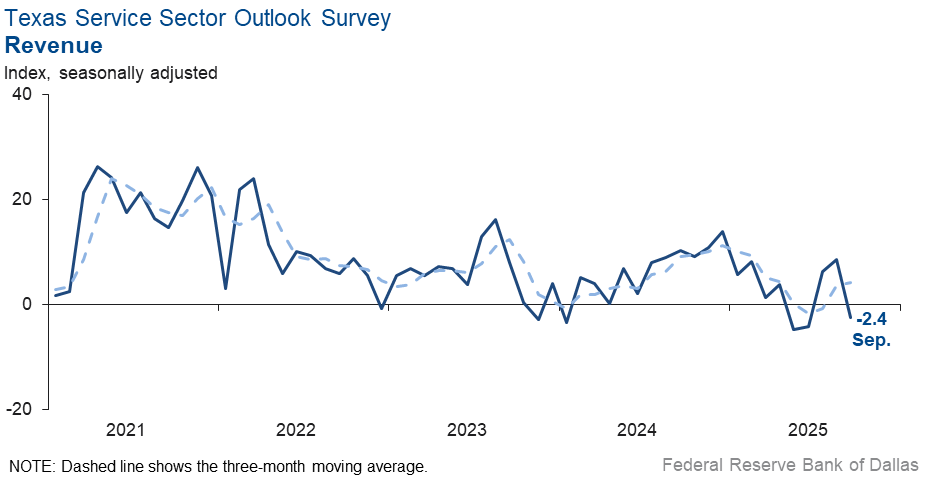
Texas service sector activity contracted slightly in September, according to business executives responding to the Texas Service Sector Outlook Survey. The revenue index, a key measure of state service sector conditions, fell 11 points to -2.4.
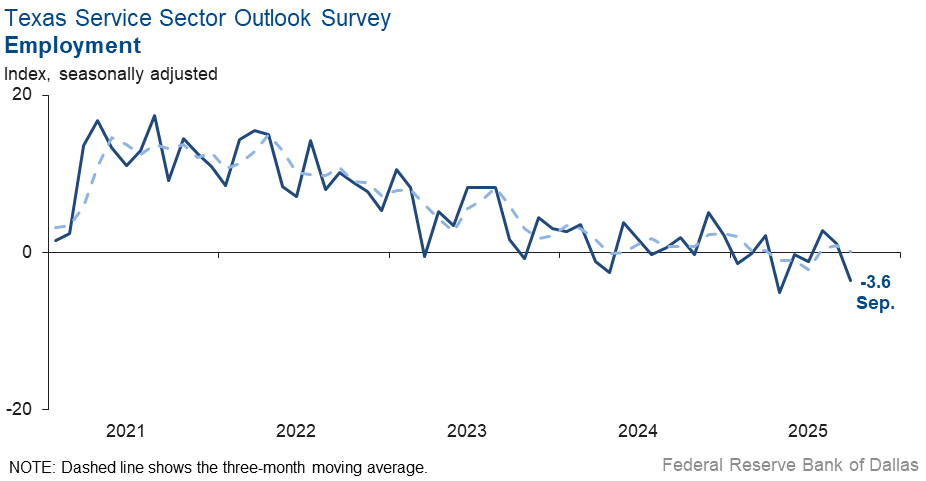
Labor market measures suggested employment declines and little change in hours worked this month. The employment index edged down to -3.6 from 1.2 in August. The part-time employment index improved to -0.6 from -2.7, while the hours worked index fell six points to -1.0, with the near-zero reading signaling little change in the length of workweeks over the period.
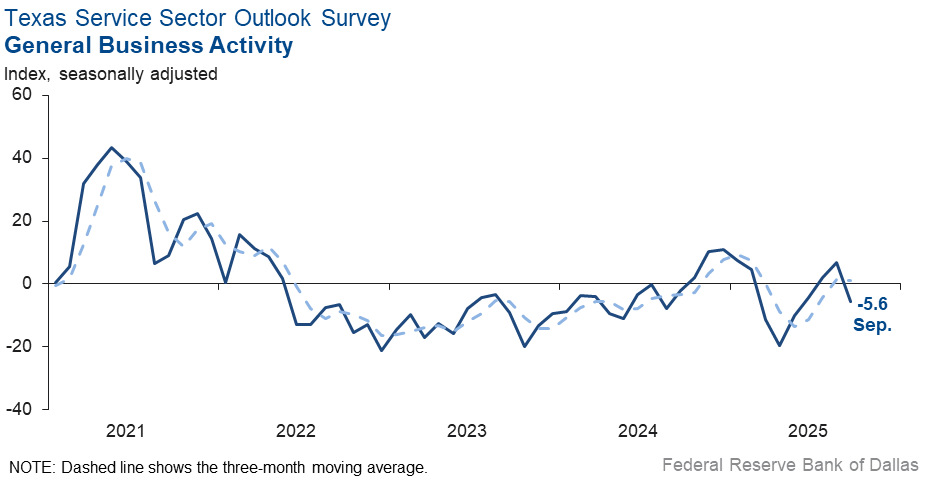
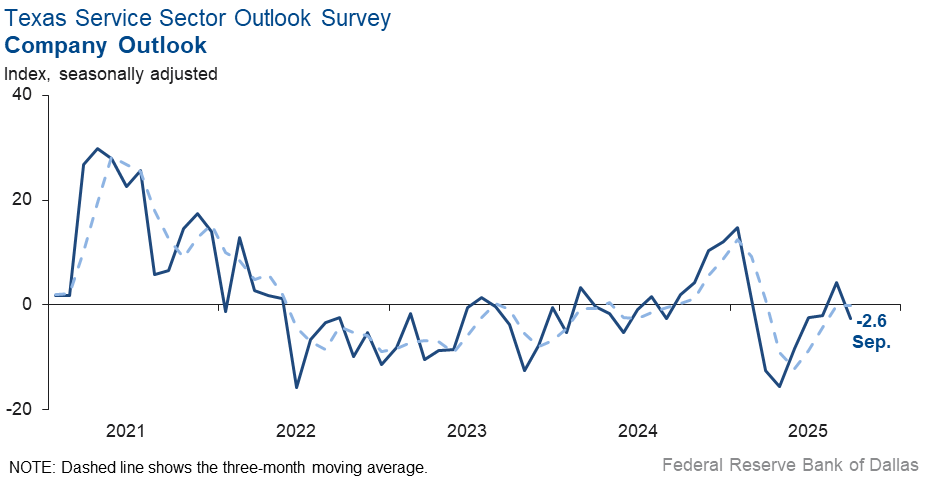
Perceptions of broader business conditions worsened in September, and uncertainty rose. The general business activity index dropped 12 points to -5.6, and the company outlook index fell seven points to -2.6. The outlook uncertainty index increased 11 points to 22.5.
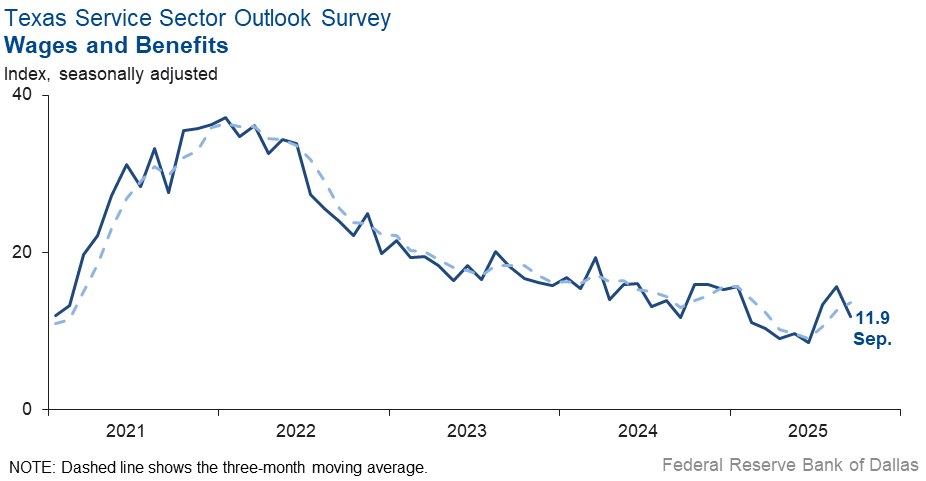
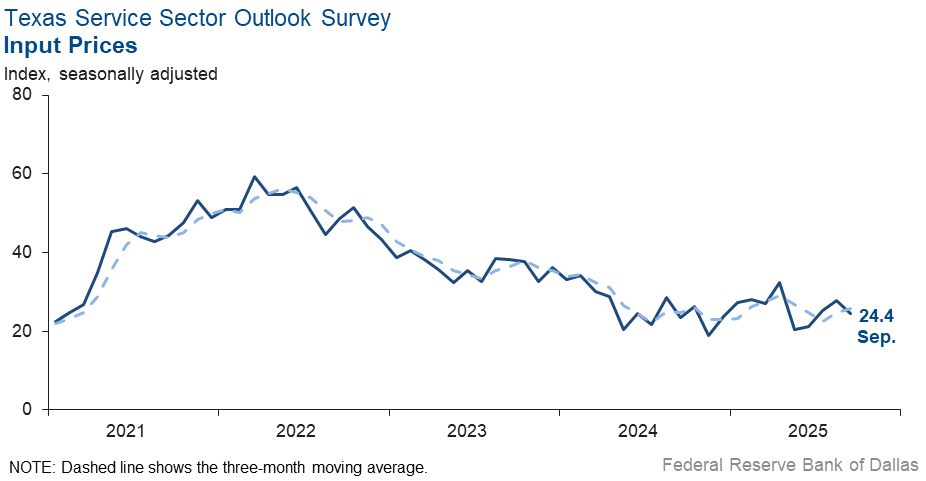
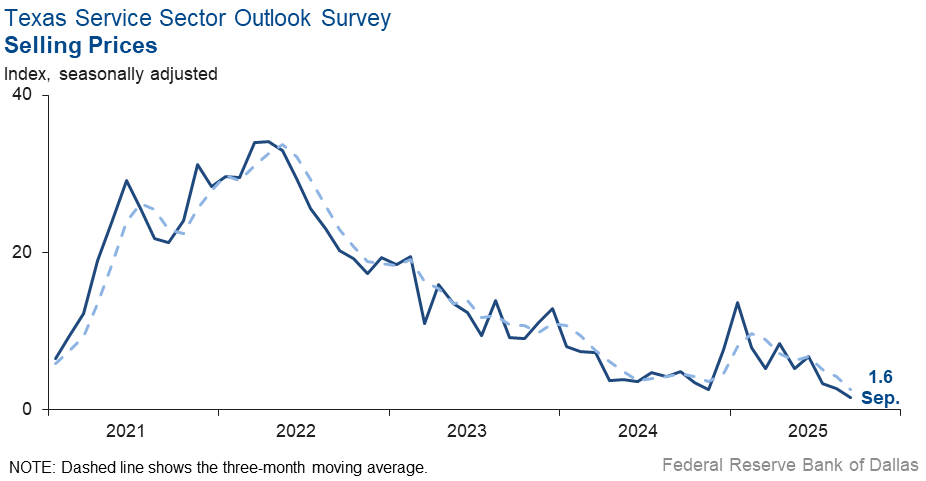
Input price and wage pressures eased slightly, while selling prices were stable. The input prices index fell to 24.4 from 27.9, and the wages and benefits index edged down four points to 11.9. The selling prices index was relatively unchanged at 1.6.
Respondents’ expectations regarding future business activity improved. The future general business activity index and the future revenue index were relatively unchanged at 11.6 and 35.3, respectively. Other future service sector activity indexes, such as employment and capital expenditures, remained in positive territory and increased, reflecting expectations for continued growth in the next six months.

Texas Retail Outlook Survey
Texas retail sales fall further
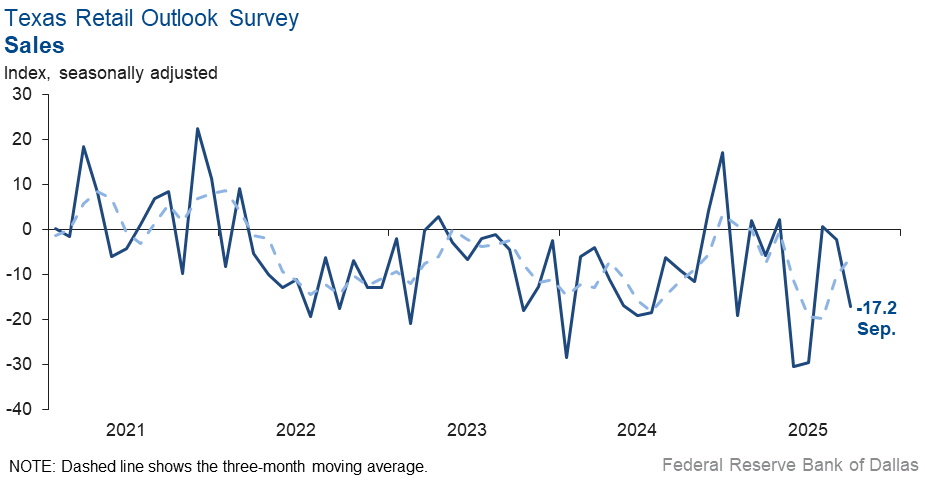
Retail sales declined in September, according to business executives responding to the Texas Retail Outlook Survey. The sales index, a key measure of state retail activity, dropped 15 points to -17.2. Retailers’ inventories remained unchanged, with an index reading of -0.3 signaling little change in inventories in September.
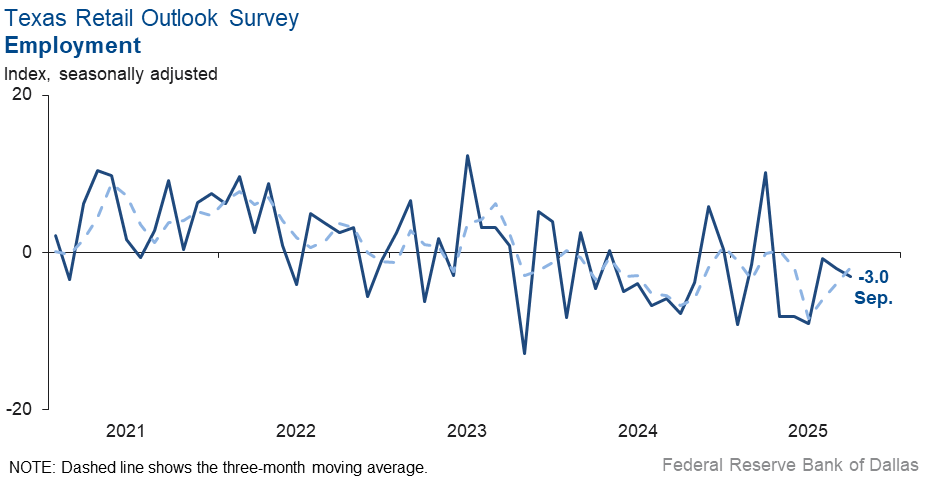
Labor market indicators reflected a contraction in retail employment and hours worked. The employment index dipped to -3.0 from -2.0, while the part-time employment index increased to -3.9 from -15.5. The hours worked index retreated five points to -8.2.
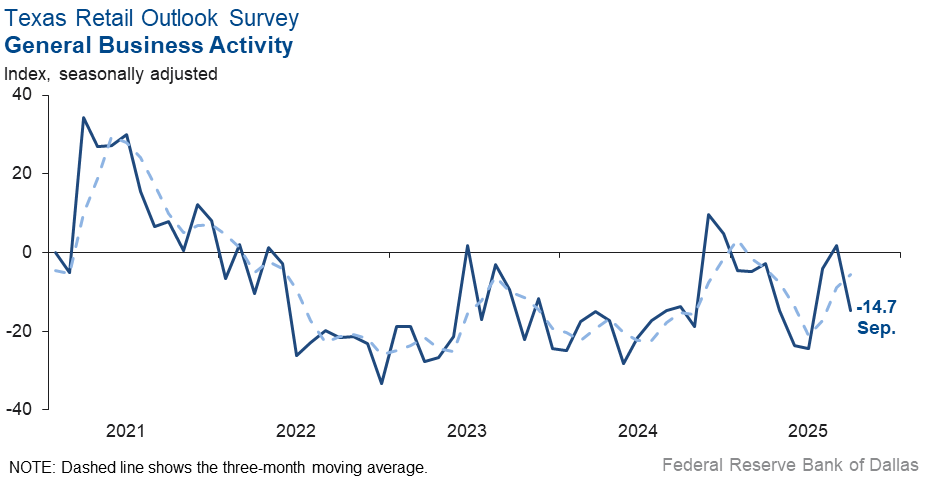
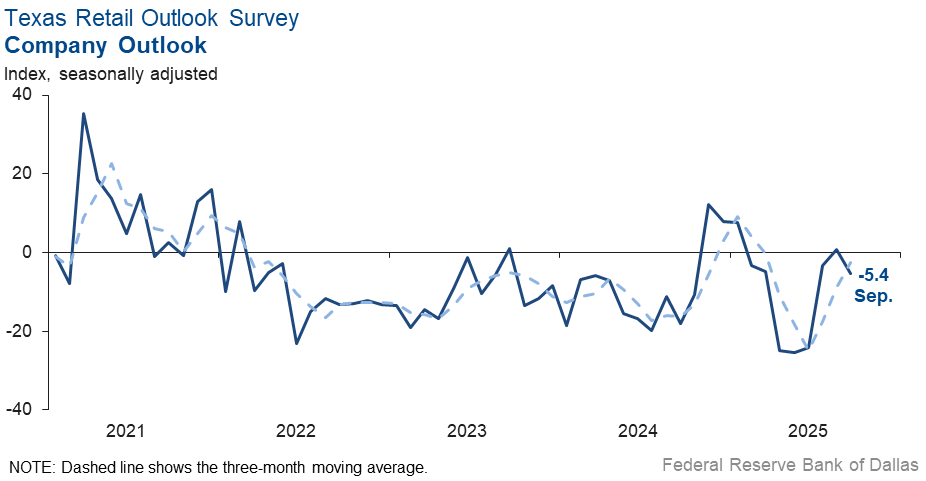
Perceptions of broader business conditions worsened in September. The general business activity index dropped 17 points to -14.7, while the company outlook index fell six points to -5.4. The outlook uncertainty index increased 18 points to 26.6.
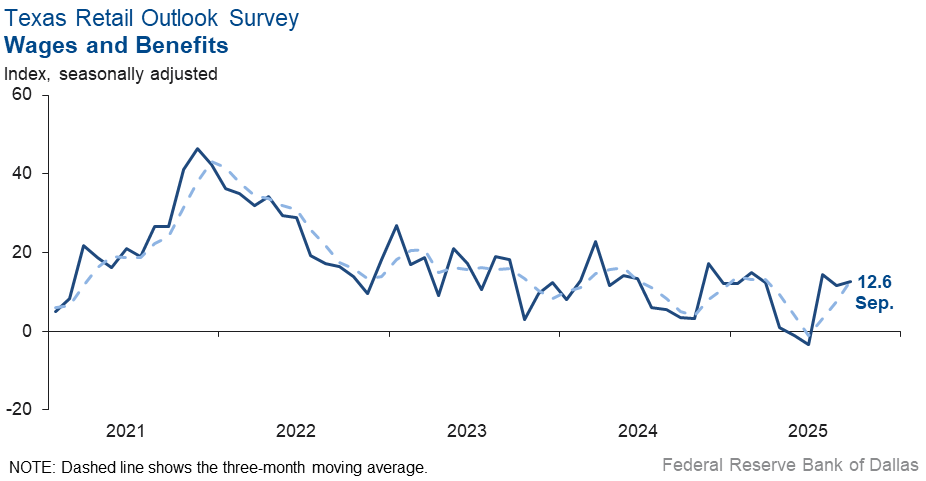
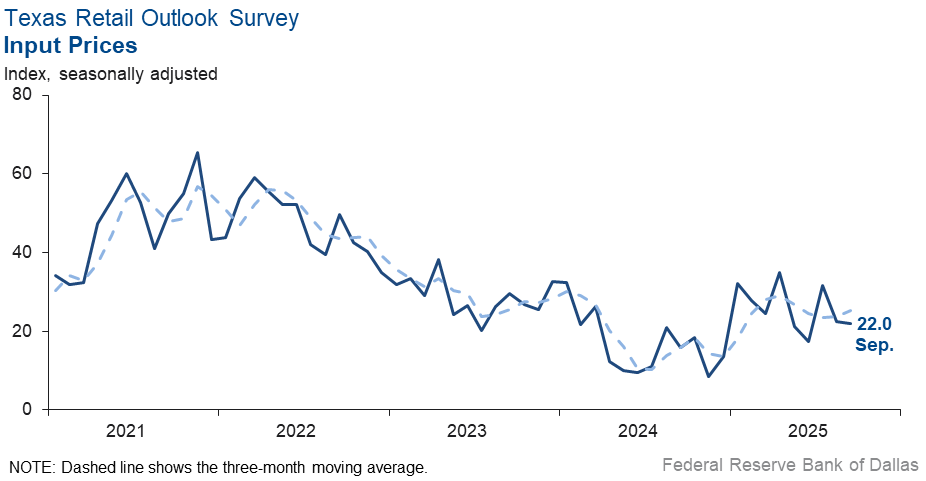
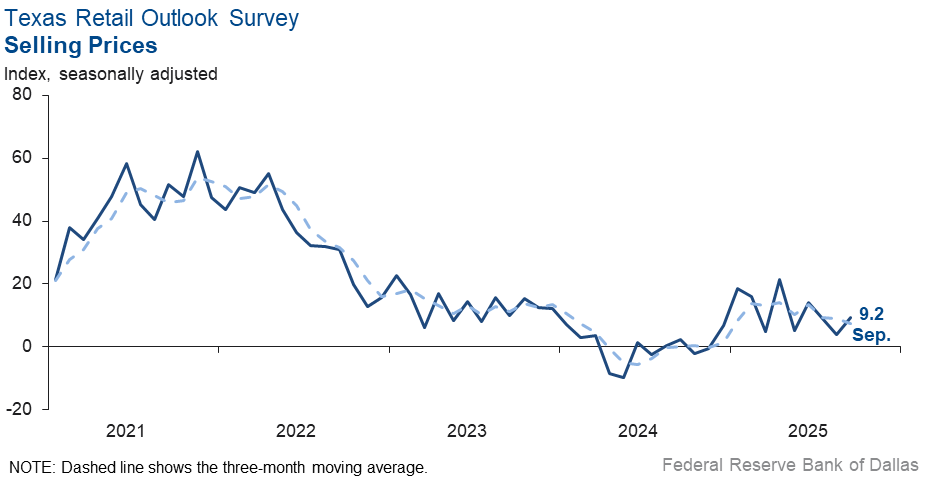
Input prices and wage pressures held steady while selling price pressures increased slightly this month. The input prices index was unchanged at 22.0, while the selling prices index edged up five points to 9.2. The wages and benefits index remained stable at 12.6.
Expectations for future retail activity were less bullish in September. The future general business activity index fell nine points but remained in positive territory at 4.7, while the future sales index fell three points to 26.6. Other future retail activity indexes, such as employment and capital expenditures, remained in positive territory.
Next release: October 28, 2025
Data were collected Sept. 16–24, and 263 of the 357 Texas service sector business executives surveyed submitted responses. The Dallas Fed conducts the Texas Service Sector Outlook Survey monthly to obtain a timely assessment of the state’s service sector activity. Firms are asked whether revenue, employment, prices, general business activity and other indicators increased, decreased or remained unchanged over the previous month.
Survey responses are used to calculate an index for each indicator. Each index is calculated by subtracting the percentage of respondents reporting a decrease from the percentage reporting an increase. When the share of firms reporting an increase exceeds the share reporting a decrease, the index will be greater than zero, suggesting the indicator has increased over the prior month. If the share of firms reporting a decrease exceeds the share reporting an increase, the index will be below zero, suggesting the indicator has decreased over the prior month. An index will be zero when the number of firms reporting an increase is equal to the number of firms reporting a decrease.
Data have been seasonally adjusted as necessary.
Texas Service Sector Outlook Survey
Historical data are available from January 2007 to the most current release month.
| Business Indicators Relating to Facilities and Products in Texas Current (versus previous month) | ||||||||
| Indicator | Sep Index | Aug Index | Change | Series Average | Trend* | % Reporting Increase | % Reporting No Change | % Reporting Decrease |
Revenue | –2.4 | 8.6 | –11.0 | 10.3 | 1(–) | 22.4 | 52.8 | 24.8 |
Employment | –3.6 | 1.2 | –4.8 | 5.9 | 1(–) | 8.7 | 79.0 | 12.3 |
Part–Time Employment | –0.6 | –2.7 | +2.1 | 1.3 | 7(–) | 3.4 | 92.6 | 4.0 |
Hours Worked | –1.0 | 5.1 | –6.1 | 2.5 | 1(–) | 6.6 | 85.8 | 7.6 |
Wages and Benefits | 11.9 | 15.7 | –3.8 | 15.6 | 64(+) | 15.7 | 80.5 | 3.8 |
Input Prices | 24.4 | 27.9 | –3.5 | 27.8 | 65(+) | 28.2 | 68.0 | 3.8 |
Selling Prices | 1.6 | 2.7 | –1.1 | 7.5 | 62(+) | 10.1 | 81.4 | 8.5 |
Capital Expenditures | 7.3 | 5.8 | +1.5 | 9.8 | 62(+) | 14.1 | 79.1 | 6.8 |
| General Business Conditions Current (versus previous month) | ||||||||
| Indicator | Sep Index | Aug Index | Change | Series Average | Trend** | % Reporting Improved | % Reporting No Change | % Reporting Worsened |
Company Outlook | –2.6 | 4.3 | –6.9 | 4.1 | 1(–) | 12.3 | 72.8 | 14.9 |
General Business Activity | –5.6 | 6.8 | –12.4 | 2.1 | 1(–) | 12.6 | 69.1 | 18.2 |
| Indicator | Sep Index | Aug Index | Change | Series Average | Trend* | % Reporting Increase | % Reporting No Change | % Reporting Decrease |
Outlook Uncertainty | 22.5 | 11.2 | +11.3 | 13.7 | 52(+) | 28.8 | 64.9 | 6.3 |
| Business Indicators Relating to Facilities and Products in Texas Future (six months ahead) | ||||||||
| Indicator | Sep Index | Aug Index | Change | Series Average | Trend* | % Reporting Increase | % Reporting No Change | % Reporting Decrease |
Revenue | 35.3 | 33.8 | +1.5 | 37.3 | 65(+) | 50.4 | 34.5 | 15.1 |
Employment | 25.4 | 20.4 | +5.0 | 23.0 | 65(+) | 32.9 | 59.6 | 7.5 |
Part–Time Employment | 6.8 | 5.6 | +1.2 | 6.5 | 3(+) | 11.1 | 84.6 | 4.3 |
Hours Worked | 2.9 | 8.1 | –5.2 | 5.9 | 5(+) | 8.1 | 86.7 | 5.2 |
Wages and Benefits | 39.5 | 38.0 | +1.5 | 37.4 | 65(+) | 43.1 | 53.2 | 3.6 |
Input Prices | 42.9 | 41.3 | +1.6 | 44.3 | 225(+) | 49.9 | 43.1 | 7.0 |
Selling Prices | 26.8 | 21.5 | +5.3 | 24.5 | 65(+) | 35.9 | 55.0 | 9.1 |
Capital Expenditures | 20.5 | 17.3 | +3.2 | 22.5 | 64(+) | 28.7 | 63.1 | 8.2 |
| General Business Conditions Future (six months ahead) | ||||||||
| Indicator | Sep Index | Aug Index | Change | Series Average | Trend** | % Reporting Improved | % Reporting No Change | % Reporting Worsened |
Company Outlook | 13.1 | 11.9 | +1.2 | 15.4 | 5(+) | 29.4 | 54.3 | 16.3 |
General Business Activity | 11.6 | 10.7 | +0.9 | 11.9 | 4(+) | 29.6 | 52.4 | 18.0 |
Historical data are available from January 2007 to the most current release month.
| Business Indicators Relating to Facilities and Products in Texas Retail (versus previous month) | ||||||||
| Indicator | Sep Index | Aug Index | Change | Series Average | Trend* | % Reporting Increase | % Reporting No Change | % Reporting Decrease |
| Retail Activity in Texas | ||||||||
Sales | –17.2 | –2.1 | –15.1 | 2.7 | 2(–) | 21.2 | 40.4 | 38.4 |
Employment | –3.0 | –2.0 | –1.0 | 1.4 | 6(–) | 11.2 | 74.6 | 14.2 |
Part–Time Employment | –3.9 | –15.5 | +11.6 | –1.6 | 2(–) | 4.1 | 87.9 | 8.0 |
Hours Worked | –8.2 | –3.6 | –4.6 | –2.3 | 2(–) | 8.0 | 75.8 | 16.2 |
Wages and Benefits | 12.6 | 11.5 | +1.1 | 11.1 | 3(+) | 20.9 | 70.8 | 8.3 |
Input Prices | 22.0 | 22.4 | –0.4 | 22.5 | 65(+) | 30.4 | 61.2 | 8.4 |
Selling Prices | 9.2 | 4.1 | +5.1 | 13.0 | 10(+) | 23.9 | 61.4 | 14.7 |
Capital Expenditures | 13.7 | –0.1 | +13.8 | 7.4 | 1(+) | 17.6 | 78.5 | 3.9 |
Inventories | –0.3 | –2.7 | +2.4 | 2.6 | 8(–) | 23.9 | 51.9 | 24.2 |
| Companywide Retail Activity | ||||||||
Companywide Sales | –8.2 | –10.7 | +2.5 | 3.9 | 5(–) | 19.2 | 53.4 | 27.4 |
Companywide Internet Sales | –1.9 | –10.0 | +8.1 | 3.5 | 7(–) | 17.1 | 63.9 | 19.0 |
| General Business Conditions, Retail Current (versus previous month) | ||||||||
| Indicator | Sep Index | Aug Index | Change | Series Average | Trend** | % Reporting Improved | % Reporting No Change | % Reporting Worsened |
Company Outlook | –5.4 | 0.7 | –6.1 | 1.0 | 1(–) | 10.5 | 73.6 | 15.9 |
General Business Activity | –14.7 | 1.9 | –16.6 | –2.9 | 1(–) | 10.3 | 64.7 | 25.0 |
| Outlook Uncertainty Current (versus previous month) | ||||||||
| Indicator | Sep Index | Aug Index | Change | Series Average | Trend* | % Reporting Increase | % Reporting No Change | % Reporting Decrease |
Outlook Uncertainty | 26.6 | 8.2 | +18.4 | 11.6 | 14(+) | 31.3 | 64.0 | 4.7 |
| Business Indicators Relating to Facilities and Products in Texas, Retail Future (six months ahead) | ||||||||
| Indicator | Sep Index | Aug Index | Change | Series Average | Trend* | % Reporting Increase | % Reporting No Change | % Reporting Decrease |
| Retail Activity in Texas | ||||||||
Sales | 26.6 | 29.6 | –3.0 | 30.1 | 28(+) | 48.2 | 30.2 | 21.6 |
Employment | 26.1 | 22.4 | +3.7 | 12.8 | 5(+) | 34.4 | 57.3 | 8.3 |
Part–Time Employment | 1.7 | 0.0 | +1.7 | 1.5 | 1(+) | 10.4 | 80.9 | 8.7 |
Hours Worked | 2.5 | 7.9 | –5.4 | 2.2 | 3(+) | 11.2 | 80.1 | 8.7 |
Wages and Benefits | 40.9 | 35.1 | +5.8 | 29.0 | 65(+) | 42.1 | 56.7 | 1.2 |
Input Prices | 52.3 | 41.3 | +11.0 | 34.0 | 65(+) | 56.8 | 38.6 | 4.5 |
Selling Prices | 40.5 | 17.3 | +23.2 | 28.3 | 65(+) | 50.0 | 40.5 | 9.5 |
Capital Expenditures | 19.2 | 18.5 | +0.7 | 16.4 | 5(+) | 27.6 | 64.0 | 8.4 |
Inventories | 20.8 | 11.8 | +9.0 | 10.6 | 5(+) | 36.6 | 47.6 | 15.8 |
| Companywide Retail Activity | ||||||||
Companywide Sales | 20.7 | 26.7 | –6.0 | 28.4 | 5(+) | 41.8 | 37.1 | 21.1 |
Companywide Internet Sales | 10.8 | 11.2 | –0.4 | 20.9 | 20(+) | 24.3 | 62.2 | 13.5 |
| General Business Conditions, Retail Future (six months ahead) | ||||||||
| Indicator | Sep Index | Aug Index | Change | Series Average | Trend** | % Reporting Improved | % Reporting No Change | % Reporting Worsened |
Company Outlook | 5.7 | 16.5 | –10.8 | 14.6 | 4(+) | 27.1 | 51.5 | 21.4 |
General Business Activity | 4.7 | 13.4 | –8.7 | 10.2 | 3(+) | 27.6 | 49.5 | 22.9 |
*Shown is the number of consecutive months of expansion or contraction in the underlying indicator. Expansion is indicated by a positive index reading and denoted by a (+) in the table. Contraction is indicated by a negative index reading and denoted by a (–) in the table.
**Shown is the number of consecutive months of improvement or worsening in the underlying indicator. Improvement is indicated by a positive index reading and denoted by a (+) in the table. Worsening is indicated by a negative index reading and denoted by a (–) in the table.
Data have been seasonally adjusted as necessary.
Texas Service Sector Outlook Survey
Texas Retail Outlook Survey
Texas Service Sector Outlook Survey
Comments from survey respondents
Survey participants are given the opportunity to submit comments on current issues that may be affecting their businesses. Some comments have been edited for grammar and clarity.
- Don't see anything happening to move the needle forward. Stagnation appears to be the condition for today and the foreseeable future.
- There’s continued reluctance among professional white-collar employees to make job changes or be open to new opportunities. Midmarket companies are tightening even more on hiring. I've been commenting for months that the job market is worse than you believed ─ and the revised job numbers show that was true. It has not changed. There continues to be negative sentiment, and I am currently debating laying off one employee.
- High interest rates (on a relative and absolute basis) continue to present a challenge.
- The overall capture rate of the request for quotes has increased. The general business activity is still feeling like we’re all sitting on a seesaw, waiting for the bad economy to drop hard. If and when the commander-in-chief can stay the course on one policy, this feeling might pass, and we can all move on.
- The Fed rate cut is key to the real estate markets.
- Consumer confidence six months out is an issue. Providing high-end cosmetic dentistry solutions, we find most customers can't write a check, so they must borrow. Historically, demand levels for our high-end services typically foreshadowed the six-month-out consumer confidence indexes.
- Tariff uncertainty combined with general unease about the stability of the political situation is causing increased concerns about the economy over the next two years.
- The primary factor in projecting income will be interest rates. Interest expense will not decrease at the same rate as interest income; there is a lag. The number of initiatives to be implemented or approved is extensive, and the benefit or disruption is hard to predict. In addition, if all the good stuff falls into place, the results will not be immediate.
- The push for efficiencies from artificial intelligence from businesses versus the reluctance and regulatory hesitancy to approve any AI capabilities are at odds in the industry. The new third-party risk-management regulations appear to be onerous and are costly for both our clients and our company. The broad-brush approach is extremely inefficient. A more focused approach is necessary to be effective cost-wise and risk-wise for buyers and sellers of technology, i.e., regulations that are specific to each application of AI and its uses.
- Higher education is in the middle of a firestorm. Due to changes at both the federal and state levels, as well as political influences, it is very difficult to predict outcomes.
- We provide services to the upstream and downstream sectors. Volatile oil prices cause pause for the upstream sector, which impacts our business. Our long-term outlook is very constructive as global demand continues to increase and spare oil supply tightens, along with less investment in organic reserve replacement.
- Although the Veterans Health Administration Integrated Healthcare Transformation contract was awarded in September, many of the big, multibillion-dollar federal acquisition contracts remain either in protest or delayed. What this means for small and medium businesses is, watch the bottom line, closely track activity, keep capture momentum so you can pivot when awards drop.
- Adding to the stress of economic uncertainty, there is loss of efficacy within government agencies. We have federal government contracts, and the reduction in force has caused upheaval within agencies. Loss of institutional knowledge of best practices is sorely evident, and new hires don't have the necessary experience or fortitude. It's taking more time and effort from outside vendors that are not fully compensated within a fixed-fee system.
- Health care premiums and business insurance premiums for the first time in 20 years are rising faster than revenue. We expect to take a material 2 or 3 percent net margin hit for costs in 2026 that are not easy to pass on to the customer.
- We had a longtime employee retire June 30, and we are currently seeking a replacement.
- The general outlook of commercial real estate has improved, and developers are beginning to start projects again. If residential mortgage rates continue to decrease, we think the real estate market will improve in the fourth quarter and continue to improve in 2026.
- I appreciated the action by FOMC last week. However, we remain as uncertain for the future as they apparently are, also.
- The impact of tariffs is starting to be felt all around.
- Tariffs, the immigration crackdown and their effect on the overall business climate— specifically on the commercial real estate development, design and construction industries—continue to concern us.
- For the most part tariffs, Fed interest rate moves and the general political atmosphere, while tumultuous and subject to volatility, are now more or less baked into the business outlook and decision-making.
- The size of our projects has grown. We are still seeing long durations between when we write proposals and when we get approved contracts.
- Most clients are foreign investors who, due to uncertainty about the U.S. economic outlook, are shifting their investment activity to other countries.
- Random executive branch policies have led buyers to be skittish. [The policies] may be helping retention, though, as clients don’t leave and mergers-and-acquisitions activity is tepid.
- The economy is causing potential clients not to spend money on marketing until the outlook improves.
- We know that as the economy worsens and food prices increase, the need for health and human services will significantly increase. However, without federal funding, our nonprofit partners have less capacity-building funds to hire us to help. It has become a negative cyclical circle. We can count on private foundations to help in some instances, but philanthropy must be a partnership among the agencies supporting stakeholders, private philanthropy and public dollars. When one of those diminishes, it has a negative impact on communities and results in less demand for the services we offer as a consulting firm.
- There has been no change in uncertainty regarding my company's outlook. However, it has remained high as the direction exhibited by the administration is chaos.
- Compounding effects of tariffs reduced federal spending, and high interest rates are now materially impacting the business.
- We have the same issues—uncertainty and clarity for customers and potential government funding projects—mostly.
- The market is all over the place. Buyers begin to make movements, then the news of the world makes them retreat.
- Our apartment-management clientele is noticeably shifting from owners and syndicators to private lenders. We are currently helping seven different lenders figure out what to do with deals they are upside down on. Increasingly, they are realizing that sticking with borrowers who are making promises and taking shortcuts but are out of cash and lack know-how is only diminishing the value of their collateral and underserving residents. These lenders don't necessarily have extra cash to put in and are still beholden to their investors, but resolutions are starting to work their way through the food chain. Meanwhile, the U.S. Immigration and Customs Enforcement (ICE) crackdown is making workers disappear left and right, making our job that much tougher. They aren't talking about what they are doing, but our managers in Hispanic neighborhoods report roadblocks, cop convoys, harassment, passports being demanded by nonuniformed officers and doors being kicked in. As a terror campaign, it is very effective. It is also causing economic losses and stagnation.
- The assassination of Charlie Kirk stopped sales for a week. Buyers and agents were emotionally not wanting to do anything. It’s a very sad and worrisome time in our country.
- Although the uncertainty regarding tariffs has decreased, there is still uncertainty about how the average consumer's buying decisions are going to impact us as those tariffs begin to hit their pocketbooks.
- No real change in sentiment over the past 30 days; however, angst is still evident overall regarding the stability of the overall U.S. economy. Houston and Texas continue to be something of positive-growth outliers, though.
- It’s a slow moving commercial real estate market in San Antonio. The office sector remains very damaged. The industrial market uncertainty remains, with no clarity in tariff impacts.
- Tariffs are still messing up everything about our industry. It is impossible to know how to price things and negotiate fleet purchases for 2026. We normally place large orders this time of year from Korea. But will prices from Korea be higher or lower six months from now? As Nate Bargatze says: "Nobody knows!”
- We are a heavy construction dealer. Our customers are either buying very cautiously or not at all. We provide 0 percent interest in retail deals, so it's not financing. We think they are concerned about making payments for the next three or four years. Other interest rates they are paying, from home to car to credit cards, are killing them. Our industry follows to a significant extent the home industry, which is not good again due to mortgage rates. Just the cost of a home today is about two times what it was in 2019.
- We’re unsure about mergers and acquisitions and capital formation trends in fourth quarter. Things are impacted by economic weaknesses generally and job trends in the marketplace. It feels like too many negative trends are starting to set up around the administration’s fingers in too many pots.
- We have seen some increase in activity, but it’s still below levels that we would consider good or robust.
- Farmers are benefiting from good moisture, leading to strong yields as prices inch up. ICE raids are causing uncertainty in businesses and at retail, as people are conscientious that the economy will suffer more in the future. Local commercial construction rose sharply with big projects.
- People are still not spending money.
- The winding down of the tariff wars has eased some uncertainty, though overall freight volumes remain low. At the same time, stricter enforcement of English-language proficiency and B-1 visa regulations is helping reduce excess capacity in the trucking industry, which has faced oversupply for the past three years. Hopefully, further capacity will exit the labor market, which could lift rates to sustainable levels—allowing truckers to operate at or above cost for the first time in years. For the record, reports of a driver shortage are a myth. The industry challenge has been excess capacity, not a lack of drivers.
- We lost a contract in addition to a terrible cotton season.
- There’s no clear outlook six months from now; too much uncertainty on tariffs.
- Our rent went up due to the insurance on the property doubling.
- Unemployment is creeping up because of the tariffs.
- We have a fairly stable outlook, though we continue to see inflationary pressures on our input materials, some of which we will pass on to our customers through a price tariff adjustment on Jan. 1.
- Tariff policies are generating chaos, with manufacturers looking to locate close to the U.S.
- Commodity pricing is down, based on less demand in manufacturing consumer goods, housing construction and overseas markets.
- There is pricing pressure across the line as we have too many places to buy appliances.
- We're unsure about the effects of tariffs. We haven't seen anything significant, but we are uncertain about the future.
- Many construction projects were put on hold, and there’s no telling when they will come back. Budgets haven't met the increase in pricing yet.
- With tariffs getting baked into pricing, we're not seeing significant changes in the foodservice space. Commodities continue to stay level. With the recent Fed announcement of interest rates lowering, I'm looking forward to seeing if the dollar weakens relative to our foreign export markets. Export orders seem to be ticking up, but it could also be early ordering for the holidays. Seasonally, we see strong sales from late September through early December, so it's hard to distinguish what's driving it. That said, we are not seeing any decreases in sales.
- The supply chain has not recovered from COVID; the increased tariffs have only made prices increase; competition from big boxes remains strong.
- We are 40 percent off in retail volume.
- Too much uncertainty in many ways will impact business conditions and our business model.
- As small business owners, we are all used to some volatility. What none of us ever expected was a government that is actively and openly working against us. The steel and aluminum tariffs are a major headwind, and the reality is that we only have so much capacity to produce products in this country.
- We see our auto retail business continuing to soften due to high input prices, which are also reducing margins. We are hopeful that retail consumer-loan interest rates drop enough to spur demand, but it’s not likely in our opinion.
- It feels like the economy around me is getting tighter, but the stock market is doing well.
- It definitely feels like the economy is slowing down.
- The economy is sluggish, and people don't seem to be eating out like in the past.
- Things are looking up, but it’s not for sure at this point.
Special questions
For this month’s survey, Texas business executives were asked supplemental questions on demand expectations, pricing power and the impact of tariffs. Results below include responses from participants of all three surveys: Texas Manufacturing Outlook Survey, Texas Service Sector Outlook Survey and Texas Retail Outlook Survey. View individual survey results.
Historical Data
Historical data can be downloaded dating back to January 2007.
Indexes
Download indexes for all indicators. For the definitions of all variables, see data definitions.
Texas Service Sector Outlook Survey |
Texas Retail Outlook Survey |
| Unadjusted | Unadjusted |
| Seasonally adjusted | Seasonally adjusted |
All Data
Download indexes and components of the indexes (percentage of respondents reporting increase, decrease, or no change). For the definitions of all variables, see data definitions.
Texas Service Sector Outlook Survey |
Texas Retail Outlook Survey |
| Unadjusted | Unadjusted |
| Seasonally adjusted | Seasonally adjusted |
Questions regarding the Texas Service Sector Outlook Survey can be addressed to Mariam Yousuf at mariam.yousuf@dal.frb.org.
Sign up for our email alert to be automatically notified as soon as the latest Texas Service Sector Outlook Survey is released on the web.