
Texas Service Sector Outlook Survey
Texas service sector activity retreats slightly
Texas service sector activity contracted in November, though at a slower pace than in October, according to business executives responding to the Texas Service Sector Outlook Survey. The revenue index, a key measure of state service sector conditions, ticked up four points but remained in negative territory at -2.5.
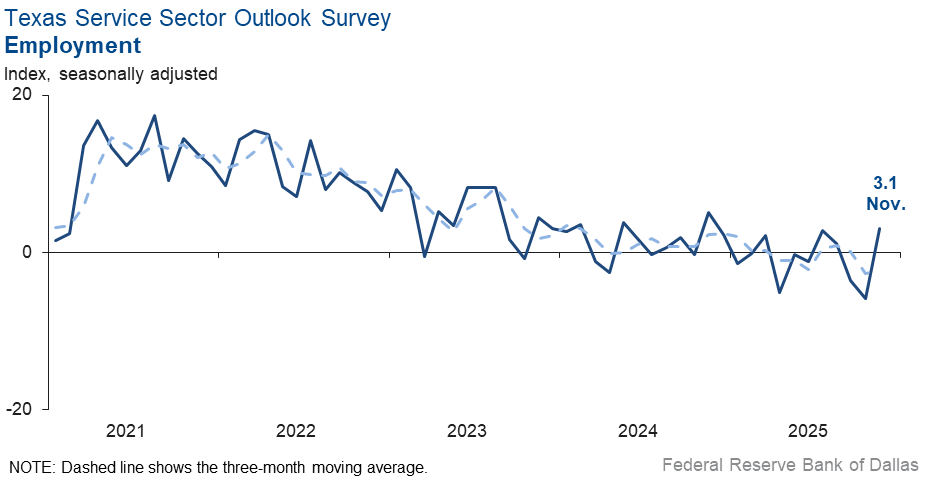
Labor market measures suggested growth in employment, though hours worked were largely unchanged this month. The employment index moved up nine points to 3.1, its highest reading since November 2024. Meanwhile, both the part-time employment index and the hours worked index held steady at near-zero readings, suggesting little change in part-time employment or the length of workweeks in November.
Perceptions of broader business conditions worsened, though pessimism waned somewhat. The general business activity index ticked up seven points to -2.3. The company outlook index also edged up, increasing to -4.2 from -10.0 in October. The outlook uncertainty index fell four points to 18.2 but remained well above the series average of 13.8.
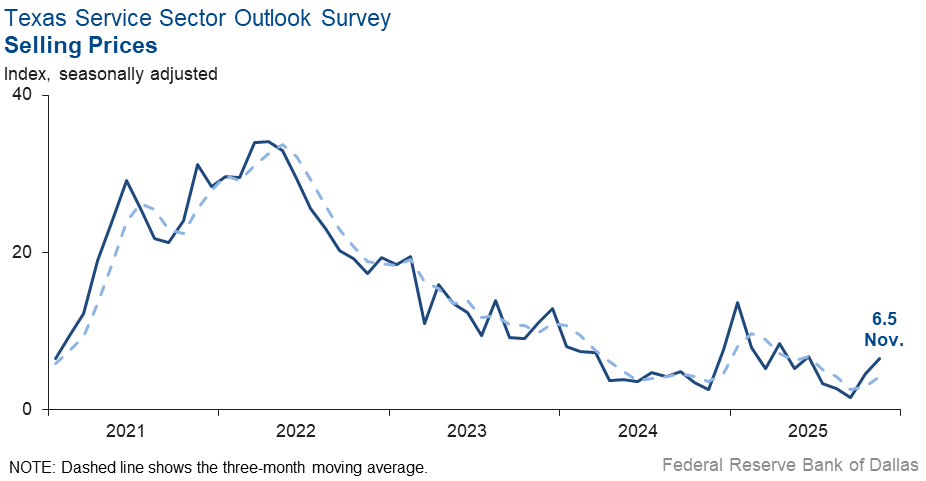
Price and wage growth accelerated in November. The input prices index edged up five points to 27.6, and the selling prices index increased slightly to 6.5 from 4.6 in October. The wages and benefits index rose four points to 14.7.
Respondents’ expectations regarding future service sector activity remained positive. The future revenue index was little changed at 34.0, while the future general business activity index advanced seven points to 13.0. Other future service sector activity indexes, such as employment and capital expenditures, remained in solidly positive territory.

Texas Retail Outlook Survey
Texas retail sales fall
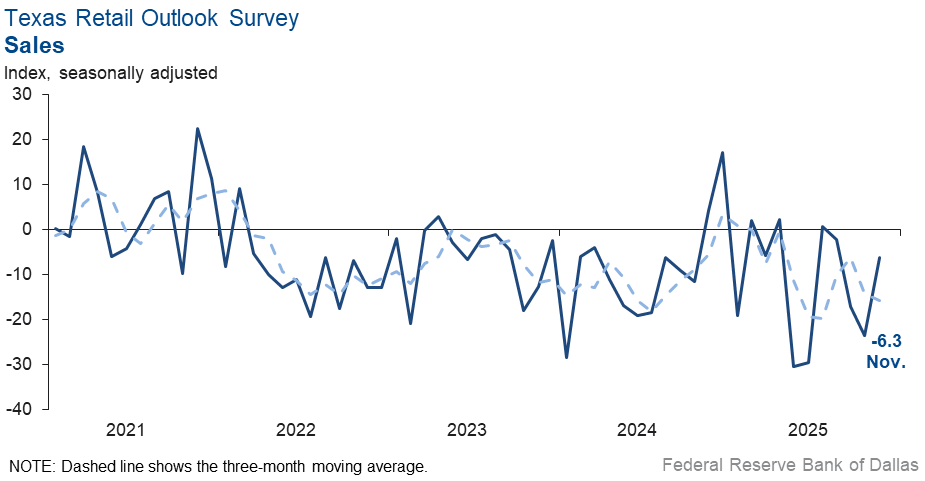
Retail sales dipped in November, according to business executives responding to the Texas Retail Outlook Survey. The sales index, a key measure of state retail activity, remained negative but increased 17 points to -6.3. Retailers’ inventories increased, with the index rising seven points to 7.4
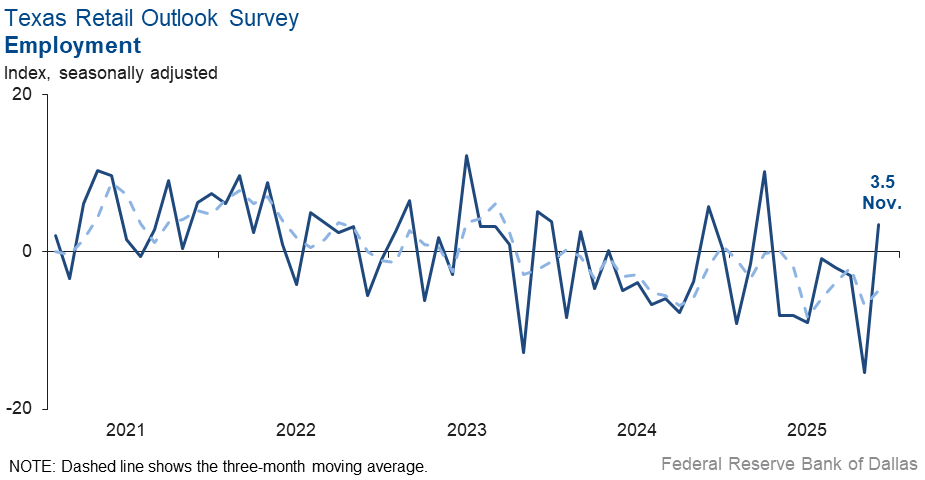
Labor market indicators suggested growth in employment this month. The employment index jumped 19 points to 3.5, and the part-time employment index also rose sharply to 6.8 from -3.2 in October. Both readings were higher than their respective series averages. Meanwhile, the hours worked index held steady with a reading of -7.7, suggesting a similar contraction in hours worked as last month.
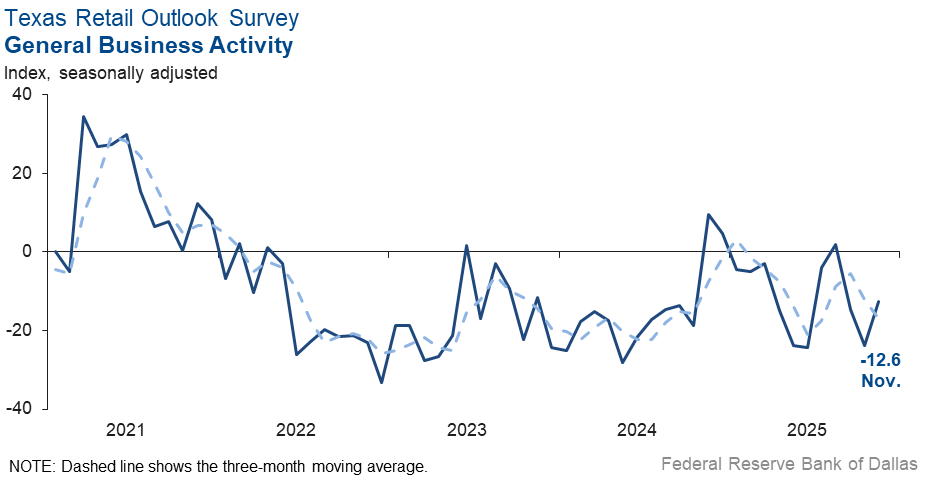
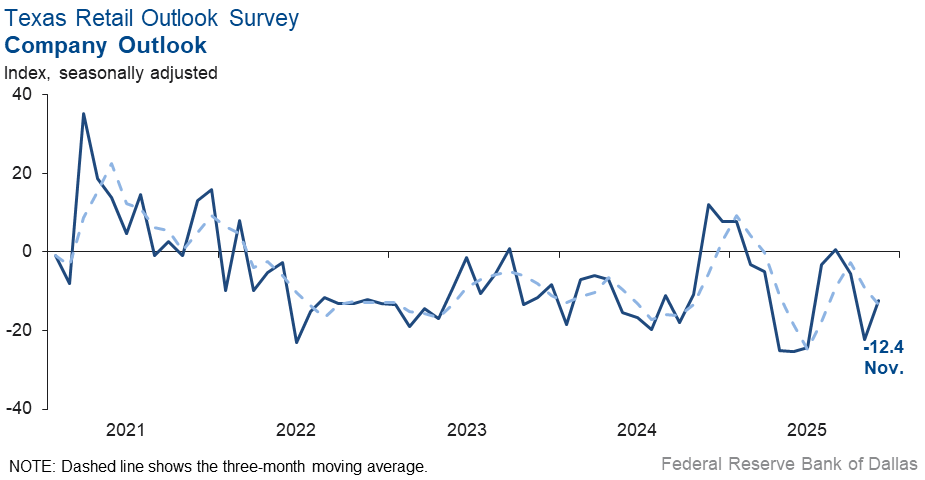
Perceptions of broader business conditions worsened, and uncertainty in outlooks increased. The general business activity index jumped up 11 points to -12.6, while the company outlook index edged up ten points to -12.4. Meanwhile, the outlook uncertainty index fell to 13.2 from 17.3 in October, remaining above its series average of 11.7.
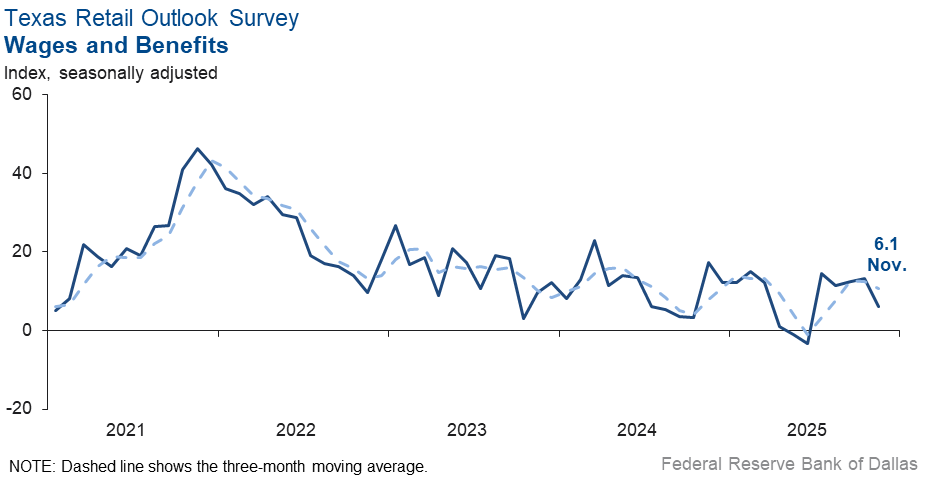
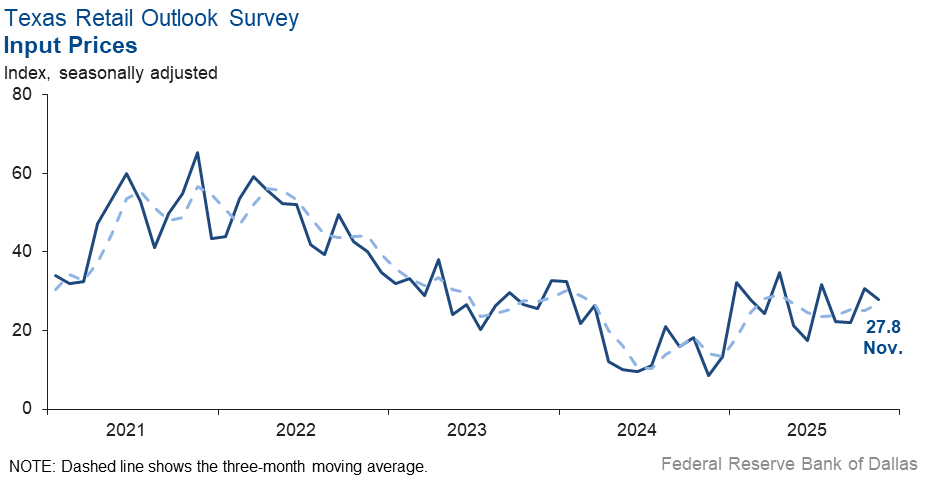
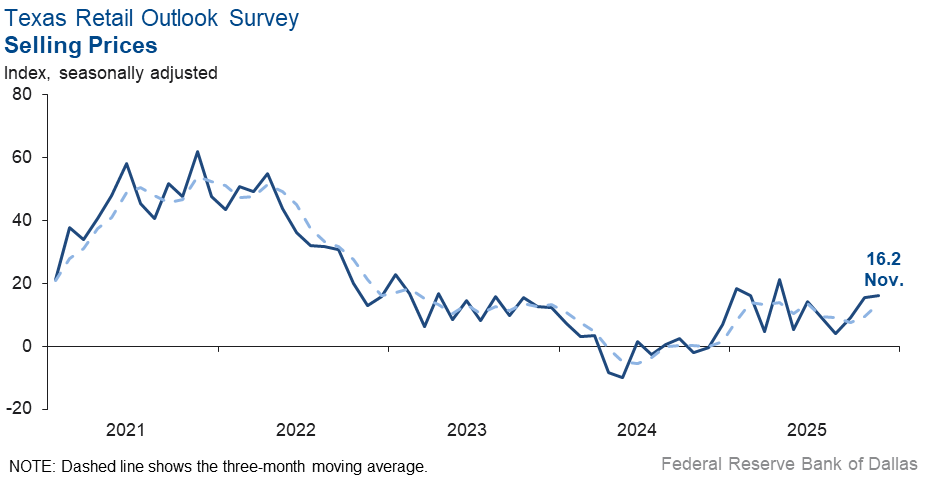
Wage pressures eased this month, while price pressures were little changed. The input prices index dipped three points to 27.8 but remained above the series average of 22.6. The wages and benefits index also fell to 6.1 from 13.3 in October. Meanwhile, the selling prices index was little changed at 16.2.
Expectations for future retail activity remained positive in November. The future sales index was positive but plunged 16 points to 6.9. Meanwhile, the future general business activity index came in at 4.1, similar to October. Other future retail activity indexes, such as employment and capital expenditures, remained in positive territory.
Next release: December 30, 2025
Data were collected Nov. 10–18, and 246 of the 346 Texas service sector business executives surveyed submitted responses. The Dallas Fed conducts the Texas Service Sector Outlook Survey monthly to obtain a timely assessment of the state’s service sector activity. Firms are asked whether revenue, employment, prices, general business activity and other indicators increased, decreased or remained unchanged over the previous month.
Survey responses are used to calculate an index for each indicator. Each index is calculated by subtracting the percentage of respondents reporting a decrease from the percentage reporting an increase. When the share of firms reporting an increase exceeds the share reporting a decrease, the index will be greater than zero, suggesting the indicator has increased over the prior month. If the share of firms reporting a decrease exceeds the share reporting an increase, the index will be below zero, suggesting the indicator has decreased over the prior month. An index will be zero when the number of firms reporting an increase is equal to the number of firms reporting a decrease. Data have been seasonally adjusted as necessary.
Data have been seasonally adjusted as necessary.
Texas Service Sector Outlook Survey
Historical data are available from January 2007 to the most current release month.
| Business Indicators Relating to Facilities and Products in Texas Current (versus previous month) | ||||||||
| Indicator | Nov Index | Oct Index | Change | Series Average | Trend* | % Reporting Increase | % Reporting No Change | % Reporting Decrease |
Revenue | –2.5 | –6.4 | +3.9 | 10.1 | 3(–) | 26.1 | 45.4 | 28.6 |
Employment | 3.1 | –5.8 | +8.9 | 5.9 | 1(+) | 15.3 | 72.5 | 12.2 |
Part–Time Employment | 0.2 | –0.1 | +0.3 | 1.2 | 1(+) | 5.9 | 88.4 | 5.7 |
Hours Worked | –0.7 | –1.4 | +0.7 | 2.5 | 3(–) | 7.5 | 84.3 | 8.2 |
Wages and Benefits | 14.7 | 10.7 | +4.0 | 15.6 | 66(+) | 18.0 | 78.7 | 3.3 |
Input Prices | 27.6 | 23.0 | +4.6 | 27.7 | 67(+) | 32.4 | 62.8 | 4.8 |
Selling Prices | 6.5 | 4.6 | +1.9 | 7.4 | 64(+) | 13.6 | 79.3 | 7.1 |
Capital Expenditures | 5.8 | 5.8 | 0.0 | 9.7 | 64(+) | 13.2 | 79.4 | 7.4 |
| General Business Conditions Current (versus previous month) | ||||||||
| Indicator | Nov Index | Oct Index | Change | Series Average | Trend** | % Reporting Improved | % Reporting No Change | % Reporting Worsened |
Company Outlook | –4.2 | –10.0 | +5.8 | 4.0 | 3(–) | 15.9 | 64.0 | 20.1 |
General Business Activity | –2.3 | –9.4 | +7.1 | 2.0 | 3(–) | 17.4 | 62.9 | 19.7 |
| Indicator | Nov Index | Oct Index | Change | Series Average | Trend* | % Reporting Increase | % Reporting No Change | % Reporting Decrease |
Outlook Uncertainty | 18.2 | 22.2 | –4.0 | 13.8 | 54(+) | 28.8 | 60.5 | 10.6 |
| Business Indicators Relating to Facilities and Products in Texas Future (six months ahead) | ||||||||
| Indicator | Nov Index | Oct Index | Change | Series Average | Trend* | % Reporting Increase | % Reporting No Change | % Reporting Decrease |
Revenue | 34.0 | 33.7 | +0.3 | 37.3 | 67(+) | 48.4 | 37.3 | 14.4 |
Employment | 20.1 | 20.1 | 0.0 | 22.9 | 67(+) | 29.1 | 61.9 | 9.0 |
Part–Time Employment | 3.8 | 3.7 | +0.1 | 6.5 | 5(+) | 7.2 | 89.4 | 3.4 |
Hours Worked | 9.3 | 3.9 | +5.4 | 5.9 | 7(+) | 14.2 | 80.9 | 4.9 |
Wages and Benefits | 33.9 | 38.1 | –4.2 | 37.4 | 67(+) | 38.7 | 56.5 | 4.8 |
Input Prices | 44.8 | 38.6 | +6.2 | 44.3 | 227(+) | 48.1 | 48.5 | 3.3 |
Selling Prices | 26.6 | 22.2 | +4.4 | 24.5 | 67(+) | 35.7 | 55.2 | 9.1 |
Capital Expenditures | 20.0 | 17.7 | +2.3 | 22.5 | 66(+) | 27.2 | 65.5 | 7.2 |
| General Business Conditions Future (six months ahead) | ||||||||
| Indicator | Nov Index | Oct Index | Change | Series Average | Trend** | % Reporting Improved | % Reporting No Change | % Reporting Worsened |
Company Outlook | 15.4 | 8.7 | +6.7 | 15.3 | 7(+) | 31.2 | 53.0 | 15.8 |
General Business Activity | 13.0 | 5.7 | +7.3 | 11.9 | 6(+) | 29.3 | 54.4 | 16.3 |
Historical data are available from January 2007 to the most current release month.
| Business Indicators Relating to Facilities and Products in Texas Retail (versus previous month) | ||||||||
| Indicator | Nov Index | Oct Index | Change | Series Average | Trend* | % Reporting Increase | % Reporting No Change | % Reporting Decrease |
| Retail Activity in Texas | ||||||||
Sales | –6.3 | –23.5 | +17.2 | 2.6 | 4(–) | 25.6 | 42.4 | 31.9 |
Employment | 3.5 | –15.3 | +18.8 | 1.3 | 1(+) | 15.4 | 72.7 | 11.9 |
Part–Time Employment | 6.8 | –3.2 | +10.0 | –1.6 | 1(+) | 14.5 | 77.8 | 7.7 |
Hours Worked | –7.7 | –6.8 | –0.9 | –2.3 | 4(–) | 4.3 | 83.7 | 12.0 |
Wages and Benefits | 6.1 | 13.3 | –7.2 | 11.1 | 5(+) | 11.9 | 82.3 | 5.8 |
Input Prices | 27.8 | 30.6 | –2.8 | 22.6 | 67(+) | 37.3 | 53.2 | 9.5 |
Selling Prices | 16.2 | 15.4 | +0.8 | 13.1 | 12(+) | 28.6 | 59.0 | 12.4 |
Capital Expenditures | 16.2 | 15.7 | +0.5 | 7.5 | 3(+) | 23.9 | 68.4 | 7.7 |
Inventories | 7.4 | 0.1 | +7.3 | 2.6 | 2(+) | 29.9 | 47.6 | 22.5 |
| Companywide Retail Activity | ||||||||
Companywide Sales | –7.9 | –19.2 | +11.3 | 3.7 | 7(–) | 19.3 | 53.5 | 27.2 |
Companywide Internet Sales | –18.9 | –15.7 | –3.2 | 3.3 | 9(–) | 5.7 | 69.7 | 24.6 |
| General Business Conditions, Retail Current (versus previous month) | ||||||||
| Indicator | Nov Index | Oct Index | Change | Series Average | Trend** | % Reporting Improved | % Reporting No Change | % Reporting Worsened |
Company Outlook | –12.4 | –22.3 | +9.9 | 0.9 | 3(–) | 13.4 | 60.8 | 25.8 |
General Business Activity | –12.6 | –23.7 | +11.1 | –3.0 | 3(–) | 14.1 | 59.2 | 26.7 |
| Outlook Uncertainty Current (versus previous month) | ||||||||
| Indicator | Nov Index | Oct Index | Change | Series Average | Trend* | % Reporting Increase | % Reporting No Change | % Reporting Decrease |
Outlook Uncertainty | 13.2 | 17.3 | –4.1 | 11.7 | 16(+) | 27.6 | 58.0 | 14.4 |
| Business Indicators Relating to Facilities and Products in Texas, Retail Future (six months ahead) | ||||||||
| Indicator | Nov Index | Oct Index | Change | Series Average | Trend* | % Reporting Increase | % Reporting No Change | % Reporting Decrease |
| Retail Activity in Texas | ||||||||
Sales | 6.9 | 23.2 | –16.3 | 30.0 | 30(+) | 26.5 | 53.9 | 19.6 |
Employment | 8.1 | 8.7 | –0.6 | 12.7 | 7(+) | 20.0 | 68.1 | 11.9 |
Part–Time Employment | 0.9 | 6.9 | –6.0 | 1.5 | 3(+) | 6.3 | 88.3 | 5.4 |
Hours Worked | 2.4 | –2.1 | +4.5 | 2.2 | 1(+) | 8.6 | 85.2 | 6.2 |
Wages and Benefits | 27.9 | 35.9 | –8.0 | 29.0 | 67(+) | 33.1 | 61.7 | 5.2 |
Input Prices | 35.7 | 38.6 | –2.9 | 34.1 | 67(+) | 45.2 | 45.2 | 9.5 |
Selling Prices | 33.3 | 17.7 | +15.6 | 28.2 | 67(+) | 45.2 | 42.9 | 11.9 |
Capital Expenditures | 21.4 | 19.1 | +2.3 | 16.5 | 7(+) | 27.5 | 66.4 | 6.1 |
Inventories | 10.0 | 23.7 | –13.7 | 10.7 | 7(+) | 28.3 | 53.4 | 18.3 |
| Companywide Retail Activity | ||||||||
Companywide Sales | 5.5 | 20.1 | –14.6 | 28.3 | 7(+) | 23.9 | 57.7 | 18.4 |
Companywide Internet Sales | 9.4 | 22.2 | –12.8 | 20.9 | 22(+) | 25.0 | 59.4 | 15.6 |
| General Business Conditions, Retail Future (six months ahead) | ||||||||
| Indicator | Nov Index | Oct Index | Change | Series Average | Trend** | % Reporting Improved | % Reporting No Change | % Reporting Worsened |
Company Outlook | 9.1 | 9.3 | –0.2 | 14.6 | 6(+) | 27.3 | 54.5 | 18.2 |
General Business Activity | 4.1 | 3.2 | +0.9 | 10.1 | 5(+) | 20.0 | 64.1 | 15.9 |
*Shown is the number of consecutive months of expansion or contraction in the underlying indicator. Expansion is indicated by a positive index reading and denoted by a (+) in the table. Contraction is indicated by a negative index reading and denoted by a (–) in the table.
**Shown is the number of consecutive months of improvement or worsening in the underlying indicator. Improvement is indicated by a positive index reading and denoted by a (+) in the table. Worsening is indicated by a negative index reading and denoted by a (–) in the table.
Data have been seasonally adjusted as necessary.
Texas Service Sector Outlook Survey


Texas Retail Outlook Survey
Texas Service Sector Outlook Survey
Comments from survey respondents
Survey participants are given the opportunity to submit comments on current issues that may be affecting their businesses. Some comments have been edited for grammar and clarity.
- Demand for real estate valuation and consulting services is increasing in response to the interest rate cuts. However, a key independent contractor resigned, which reduces my ability to take on additional assignments. I will start searching for a replacement, which will take time and training to be productive.
- High interest rates (on a relative basis), federal policy uncertainty and general uncertainty with respect to tariffs and impact on inflation are still a drag on spending decisions by business owners.
- The government shutdown has put a halt to hiring decisions.
- Washington’s inability to function creates uncertainty.
- Uncertainty is rampant, and companies are holding back on hiring decisions. Companies are still posting ghost jobs to pipeline for future hiring (if ever) and choosing the low- or below low-end of salary ranges to make offers. Cost-cutting is everywhere, and both companies and candidates are on edge. You feel like the bottom can fall out at any millisecond.
- Health care companies such as mine have been adversely impacted by the warmer weather and seeming lack of flu and COVID-19 cases (which tend to be seasonal during the winter months). There has been a bit of doctor fatigue that patients are also experiencing due to the misinformation that is widely presented by historically scientifically based government agencies that are now politically influenced (e.g., vaccines, etc.). Additionally, higher costs of providing services continue, and tariffs continue to put a damper on disposable supplies, along with capital equipment. In healthcare, insurance monopolies continue to run rampant, unchecked, and continue to place downward pressure on providers of all sizes, and patient accounts continue to face bad debt challenges. The labor market continues to be a challenge as less qualified candidates continue to present themselves for opportunities at requested pay rates of 30 percent to 40 percent above our posted pay rate ranges. It is a tough business environment all the way around. Access to debt remains available; however there continue to be structural economic headwinds that will take years to abate.
- We sometimes use contract workers from an agency so that we avoid some employee expenses. We are operating in different times.
- With the lower interest rate environment there is a slight trend for lower cost and less interest income. This rate environment is gradually compressing margins. There are many variables that create uncertainty in the forecast. Liquidity continues to be a factor in the marketplace. The change is compensatory and delays the identifiable impacts.
- Speaking with competitors and suppliers in our industry, I am hearing the same as our circumstances. We have no debt and own our property, so we have a significant advantage. However, capital costs, increasing insurance (not to mention health premiums), utilities and just about everything else I can think of continue to increase, while customer visits and spending continue to decline. I have weathered many economic cycles going back to the oil bust of the 1980s and have always seen light at the end of the tunnel, and we have always come out the other side stronger. I don't see any light when I look down the tunnel today, only more tunnel.
- The government shutdown has impacted our customer base significantly.
- Consumer spending continues to be challenged, but some positive factors for next year should support spending.
- The combination of tariffs and the government shutdown (even if the shutdown is over) will slow business activity and expectations. Holiday travelers are already re-thinking air travel. I have two friends who have already decided to drive instead of fly.
- The government shutdown has made closing timelines uncertain on some transactions, particularly those buyers who are relying on Small Business Administration loans.
- I’m hearing from others that business is down.
- Getting a budget deal done will force the businesspeople who used that situation to avoid making any long-term decisions to at least give some semblance of being proactive.
- The residential real estate market is still stagnant, while the commercial real estate market is showing signs of improvement. Until there is some resolution with tariffs, we don't see this market returning to normal.
- We are seeing increased activity in our real estate practice.
- Clients for our consulting engineering services are settling into the tariffs and getting back to projects.
- A lot of uncertainty makes us feel uneasy, plus it's impossible to plan for more than 12 months [ahead].
- Volatility under the Trump administration continues to be an issue. Global liquidity may be peaking and headed for a dive, with secured overnight financing and repo rates predicting trauma. Employment is shaky. The government shutdown added volatility and uncertainty to revenue prediction. All of this makes investment challenging.
- The last couple of months have been very slow. Many companies tell us they have hiring needs, but they are very hesitant to pull the trigger and actually hire people.
- The government shutdown and economic uncertainty are causing a lot of business owners in the manufacturing and professional services space to do nothing. They are freezing and waiting to see what is going to happen in the coming months, which is hurting our business as new client acquisition is stalling for the third quarter in a row.
- AI products are supporting an improved outlook.
- Our target market is the nonprofit sector. As things stand now, they will continue to bear the burden as their constituents are hit the hardest by the economy, the government shutdown and the lack of care the current administration has for the common people of this country. As nonprofits bear this burden, their resources will go to helping rather than to building capacity, resulting in fewer contracts for us.
- Continued inflation is leading to salary and cost increases.
- Economic and political uncertainty [are issues impacting our business].
- I think the government shutdown and a few other things have caused some uncertainty. We think our business will pick back up after the first of the year.
- Our company's market niche is foreign investors, primarily from Latin America. However, the current perceptions and concerns they have about the U.S. government, especially the repeated threats of government shutdowns, have increased uncertainty and redirected many of their investment plans toward other countries, such as Canada.
- Uncertainty continues to plague the energy project arena. I don't think it is increasing; [it’s] just at a high level and staying there. We are living with it and not going forward on many projects.
- We are in a very seasonal business, real estate title. Most of our revenue comes between March and September, so six months from now looks better for us than this month.
- My clients are cutting their marketing budgets, resulting in our projections decreasing by 20 percent for 2026.
- Our firm provides consulting services to the Texas Department of Transportation. The slowdown in the use of consultants from TxDOT since the start of 2025 has had an impact on our business. On the other hand, TxDOT reports they are seeing more competitive bids on construction projects, indicating general contractors are hungry, and there's more price competition to win highway construction projects.
- The global economy is improving. The U.S. economy is poised to get stronger after the government shutdown ends. AI is killing jobs for white collar professionals, which is a big concern as many technology and other big companies are laying off staff due to AI concerns. The Federal Reserve should continue to lower interest rates to avoid a recession/downturn.
- We remain cautiously optimistic going into 2026 if several pending public client contracts currently in proposal stage or fee negotiation come through. There are a number of queries for small renovation projects that we hesitate to accept because of limited staff availability. We haven't been able to find experienced staff to hire. We do not want to hire any more remote workers. Currently, 24 percent of our staff is remote.
- Hopefully with the U.S. government reopening they will be able to make decisions and sort out budgets without great harm to plans.
- We're in the doldrums. We are challenged to maintain occupancy without having to lower rents, and apartment foreclosures seem as common as traditional sales. Few are moving or changing jobs. The cost of living, the shutdown, interruption of benefits and constant bad news are causing everyone we interact with to feel defeated. On top of that, many residents and contractors are being [impacted] by ICE. We're hearing more firsthand horror stories about harassment and arrests than we ever see on the news. Confidence in our government is waning. Our business is doing OK because we stay focused on old-fashioned fundamentals and are good at what we do. But our health insurance is up 8 percent, we haven't given a general wage increase in two years, frivolous personal injury lawsuits are a huge drain and we're working harder than ever. We are still having a Christmas party and will distribute year-end bonuses similar to last year, but with little to look forward to, it's getting ever harder to stay motivated.
- The chaos in DC in the executive branch is a killer. We must return to regular order before world markets dismiss us as undependable.
- Real estate activity seems to be at an impasse. There are fewer transactions being considered. Buyers and sellers seem to have a disconnect. It seems like people want to hunker down and not make any moves due to economic uncertainty. Lower interest rates have not seemed to have helped spur activity.
- My organization provides services to the manufacturing industry. Many subsectors in the manufacturing industry are being negatively impacted by both the sectoral tariffs on steel and aluminum and the reciprocal tariffs. There is a great deal of uncertainty about how high the various tariffs will be, given all the constantly changing tariff rates and lack of a coherent strategy. Companies are trying to make scenario plans for capital expenditures and sourcing (including reshoring) but cannot implement anything because between the potential upcoming Supreme Court decision and the administration's unpredictability, there is zero certainty about what the future holds. Congress should have thoughtful deliberations, plan strategically and then legislate well-designed and thought-out tariff policy if actually appropriate.
- October sales were up 6.5 percent over October 2024. However, for the year we are just up over 2024 by 0.4 percent. We are a heavy construction equipment distributor with sales, rental, parts and service sales. Our equipment is expensive. Financing retail sales is getting more and more difficult. Most of our manufacturers have finance and insurance arms that finance their own equipment that we retail. However, our customer retail approval rate has fallen to 71 percent, meaning they decline 29 percent of the deals we bring them. In normal times, that rate is high 80s or low 90s. I am sure the lower credit approval is due to what they are seeing in delinquencies, past-dues and bankruptcies.
- We are beginning to see measurable impacts from technology taking on certain repetitive tasks, which is reducing the workload for the workforce.
- The government shutdown ending takes away a lot of uncertainty. Small and medium-sized businesses’ ecommerce has held up with my clients. Brick-and-mortar small and medium-sized businesses are looking at 5 percent to 20 percent decreases in sales for the year. It could be worse, but the trend is still down.
- We’re hoping for more stability in the economic outlook generally in 2026, with mergers and acquisitions specifically in oil and gas private companies picking up.
- Our businesses are all white-collar staffing firms that operate mostly on a national scale. The labor market has been soft for well over a year. The weakness is now accelerating during a period that we usually have our best months.
- The nonstop chatter of interest rates, political turmoil, uncertainty, etc. has people scared. Uncertainty causes money to be frozen.
- The government shutdown—including the suspension of SNAP benefits—triggered a sharp drop in consumer spending, which directly reduced demand for the movement of goods and pulled freight out of the market. At the same time, the tariff war slowed imports and exports, further suppressing freight volumes. Layer on that an oversupplied labor marked caused by the widespread issuance of illegal or improperly issued commercial driver licenses (CDLs), and the industry has severe overcapacity. Altogether, these forces have created the perfect storm that has destabilized trucking.
- Tariff exemptions for the aerospace industry that have been in place since Sept. 1 [are expected to] bring some relief.
- It feels that business activity is going well. That said, there is some uncertainty in the market.
- We expect relatively unchanged business conditions for at least the next six months. We will reduce headcount in 2026 and expect both higher input prices and higher selling prices as we take an inflationary adjustment to our fees.
- Floor traffic count is down by 50 percent. Sales are down 7.66 percent. Overhead costs are up 27 percent. [Business is] not sustainable at these metrics.
- The federal government shutdown has affected our customers’ ability to purchase their medications.
- Our increases will be fueled some by organic growth, but mostly through geographic expansion and the opening of a new location.
- The constant threat of tariffs looms over our suppliers, purchasers, inventory and customers. The government shutdown may only be temporary, so we are uncertain about the future.
- At month-end, October ended up being way down for a typical October. Nothing in our customer base changed. Typically, our best months are in the fourth quarter as holiday shopping ramps up and people eat out. One conjecture [regarding the cause of] a slow late October: the federal government shutdown. We serve restaurant chains in Puerto Rico and Hawaii, and both markets are very sensitive to federal government spending (military and SNAP). That said, we spoke with our customers in both markets, and neither seemed to indicate that business is off (first week in November). It also helps that we are aligned with some restaurant brands that are outperforming their peers in the casual dining space. While it may be premature to see the impact one way or the other, we are cautiously optimistic that our business will not be as impacted as could be expected. Another recent trend has given me concern for the long term: coming out of COVID-19, more young diners are ordering food for delivery rather than dining in. In the Dallas-Fort Worth area, it's noted that a significant number of restaurants have closed this year. High food costs and high rent have been significant contributors, but it's also noted that dining rooms are less busy because of the trend in delivery versus dining in. As a younger generation of workers enters the workforce, particularly white-collar jobs, [we observe that] they do not have the skills to prepare meals at home, and they are dependent on food delivery for the bulk of their diet. I also feel this type of spending is not sustainable for young workers that desire to own homes, save for retirement, etc., so I'm wondering if the pendulum will swing back to a state where ordering food for delivery is more of a treat rather than an accepted way of living. I do think this trend is significant enough to watch, and the unintended consequences will have a larger impact on how we dine in the future if dine-in restaurants close their dining rooms to stay in business.
- The tariff uncertainty makes it difficult to run our business.
- For whatever reason, we just had a stronger start to the month, which made everyone feel better.
- We have three dealerships in Texas and one in California. All are experiencing a decline in new- and used-vehicle sales. The gross margin per vehicle is still declining.
- Uncertainty remains a problem. The impact of tariffs is unknown. The affordability of both new and pre-owned vehicles is concerning. Insurance premiums are high. The cost of doing business increases as margins erode. It’s difficult to forecast a long-term business plan.
- It seems like things are slower. We aren't doing as many new-home installations as in the last few years. I have wondered if the number of new people moving into the area has slowed down. Also, it seems I hear more people talking about money being tight. But when I look around at all the new construction, things seem really good.
Special questions
For this month’s survey, Texas business executives were asked supplemental questions on margins, demand, employment and productivity. Results below include responses from participants of all three surveys: Texas Manufacturing Outlook Survey, Texas Service Sector Outlook Survey and Texas Retail Outlook Survey. View individual survey results.
Historical Data
Historical data can be downloaded dating back to January 2007.
Indexes
Download indexes for all indicators. For the definitions of all variables, see data definitions.
Texas Service Sector Outlook Survey |
Texas Retail Outlook Survey |
| Unadjusted | Unadjusted |
| Seasonally adjusted | Seasonally adjusted |
All Data
Download indexes and components of the indexes (percentage of respondents reporting increase, decrease, or no change). For the definitions of all variables, see data definitions.
Texas Service Sector Outlook Survey |
Texas Retail Outlook Survey |
| Unadjusted | Unadjusted |
| Seasonally adjusted | Seasonally adjusted |
Questions regarding the Texas Service Sector Outlook Survey can be addressed to Isabel Brizuela.
Sign up for our email alert to be automatically notified as soon as the latest Texas Service Sector Outlook Survey is released on the web.