
Federal COVID-19 relief aided consumer debt, though immigrant Texans derived less benefit
For many families and businesses, loans and government relief programs were a buffer against the financial shock COVID-19 delivered.
As a result, lending and consumer loan performance were little affected despite the pandemic’s arrival in March 2020.
However, communities with a larger share of immigrants didn't realize the full benefit of these programs. In terms of credit activity, areas in Texas with a larger share of immigrants underperformed those with a lesser concentration. The difference possibly reflects lack of access to relief programs and reduced participation in the credit market.
Stability in Recession
Overall, consumer credit conditions withstood the pandemic-caused recession, remaining mostly stable in 2020, according to an analysis of the New York Fed Consumer Credit Panel (CCP)/Equifax—a representative sample of adults in the U.S. with a credit history or public-record information.[1] The number of Texans in the credit panel grew by 2.2 percent in the 12 months ended in January 2021 (Table 1).
Table 1: Credit Conditions Stable During Peak of Pandemic in Texas
| Jan. 2020 | Jan. 2021 | Change(%) | |
| No. of consumers (millions) | 22.26 | 22.74 | 2.2 |
| Average Equifax Risk Score | 681 | 690 | 1.3 |
| Share borrowing (%) | Change in number of borrowers (%) |
||
| Any loan | 75.8 | 75.1 | 1.2 |
| Auto loan | 38 | 37.2 | 0 |
| Bank-issued credit card | 55.9 | 55.3 | 1.1 |
| Mortgage | 22.2 | 22.3 | 2.6 |
| Loan delinquency | Change in number of delinquent borrowers(%) |
||
| Any loan | 19.3 | 17.9 | -5.3 |
| Auto loan | 15.7 | 14.8 | -5.7 |
| Mortgage | 4.2 | 1.8 | -57 |
| Bank-issued credit card | 15.3 | 14.8 | -2.3 |
| Average balance for borrowers ($) | Change in amounts ($) | ||
| Auto loan | 28,435 | 29,852 | 1,417 |
| Bank-issued credit card | 6,247 | 5,542 | -705 |
| Mortgage | 122,536 | 130,195 | 7,659 |
| SOURCES: New York Fed Consumer Credit Panel (CCP)/Equifax; authors’ calculations. | |||
The average credit score (Equifax Risk Score) increased nine points in Texas during the period. The share of consumers obtaining auto loans or having bank-issued credit card debt dropped slightly from levels before the pandemic. The number of mortgage borrowers grew 2.6 percent, slightly more than the increase in total consumers.
This recession was different from previous ones in another respect: Reported loan performance did not worsen. On the contrary, delinquency rates decreased for all main consumer loan types, especially mortgages.[2] The number of delinquent mortgage borrowers dropped 57 percent in the 12 months ended in January 2021. Auto loan delinquencies declined 5.7 percent, and bank card delinquencies fell 2.3 percent.
The average auto loan balance increased 5 percent, while mortgage balances rose 6 percent. The average balance for bank-issued credit cards dropped 11 percent.
The loan performance improvement coincided with large-scale government stimulus packages, which provided cash to consumers, extra unemployment insurance benefits to laid-off and furloughed workers, and automatic loan deferral for federal student loan and some mortgage borrowers. Many consumers used the extra cash to pay down debt and for savings.[3]
Additionally, the Federal Reserve and some government programs provided financial institutions abundant liquidity and flexibility and encouraged them to work with consumers on loan accommodations. Borrowers receiving forbearance or similar accommodations were not generally considered delinquent for credit reporting purposes.[4]
Widespread Forebearance
A recent study found that forbearance and loan relief weren’t concentrated only among lower-income borrowers. The impact was also noted among higher-risk borrowers and those with higher loan balances, as well as consumers living in more COVID-19-impacted areas.[5] Texas was among the states with highest mortgage forbearance rates in the study. The timely relief helped reduce negative spillover effects typical in economic recessions.
The average mortgage balance grew before COVID-19, a trend that continued as home prices rose during a period of limited house inventories (Chart 1, panel A). Auto sales paused during the March COVID-19 lockdown and recovered rapidly in the following months. Credit card deleveraging began before the pandemic and continued as borrowers could pay down more debt on average.
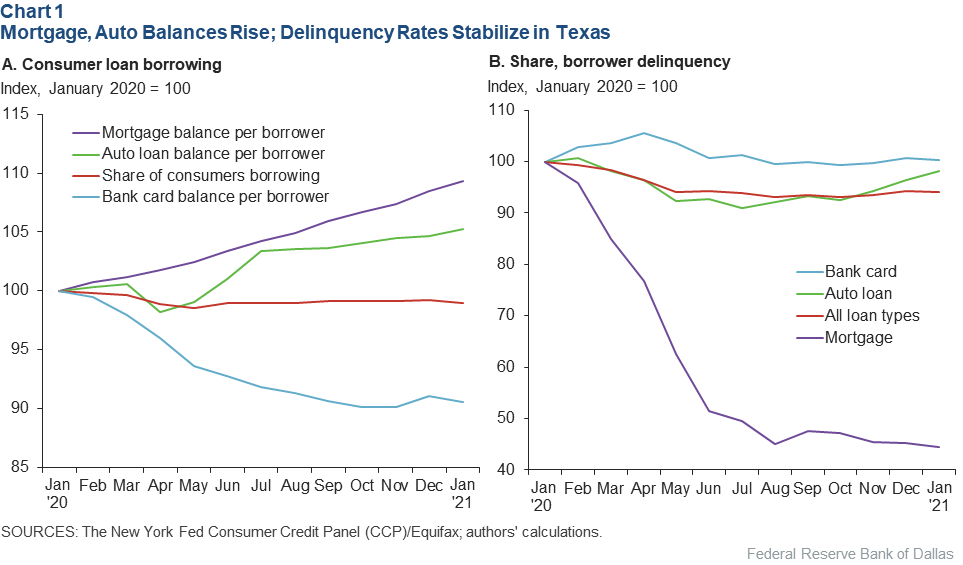
As loan accommodations peaked in June 2020, mortgage delinquencies fell by one-half and have remained low since mid-2020 (Chart 1, panel B). Auto loan delinquencies initially declined, then headed back up near year-end 2020. Credit card delinquency rose in early 2020, dropped through June and then flattened out.
These trends, however, may be concealing a more difficult experience among immigrant groups.
Immigrant Community Clusters
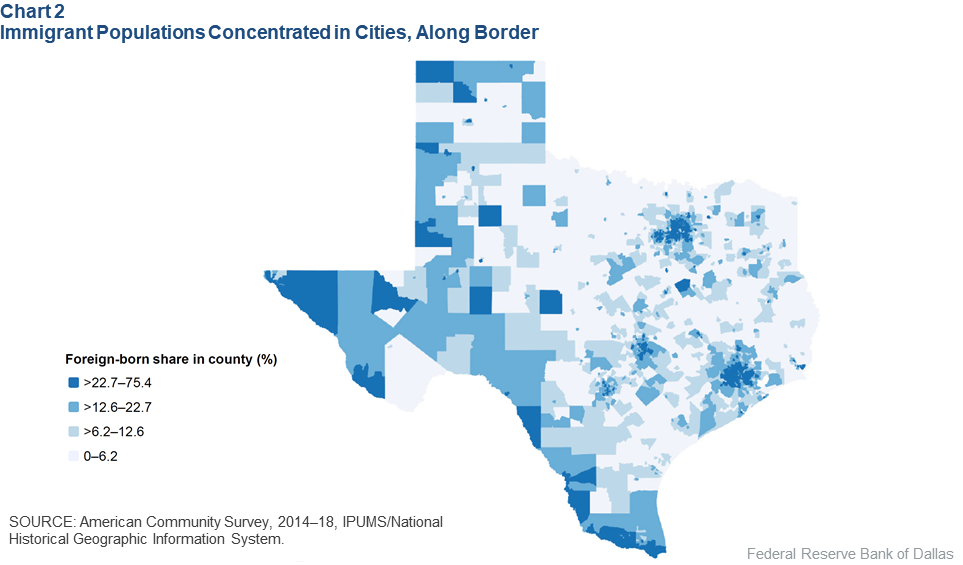
Texas had a population of 4.9 million foreign-born individuals, and the state ranked No. 2 in the number of such residents in the U.S. in 2018—not surprising given Texas’ size, long southern border and employment opportunities.[6] Texas also has the eighth-highest share of foreign-born residents and the second-highest share and population of Mexican immigrants.
Although immigrants live throughout Texas, they are concentrated in census tracts in cities and near the Mexican border (Chart 2).[7] The state’s immigrant workers account for 22 percent of the labor force and 24 percent of essential workers.[8]
Immigrant COVID-19 Activity
Immigrant communities, particularly Hispanic ones, missed out on the government’s efforts to sustain families' finances. Pandemic-related lockdowns and consumer reticence were particularly notable among accommodations and food service businesses. Moreover, immigrants living in poorer conditions were more likely to contract COVID-19.[9]
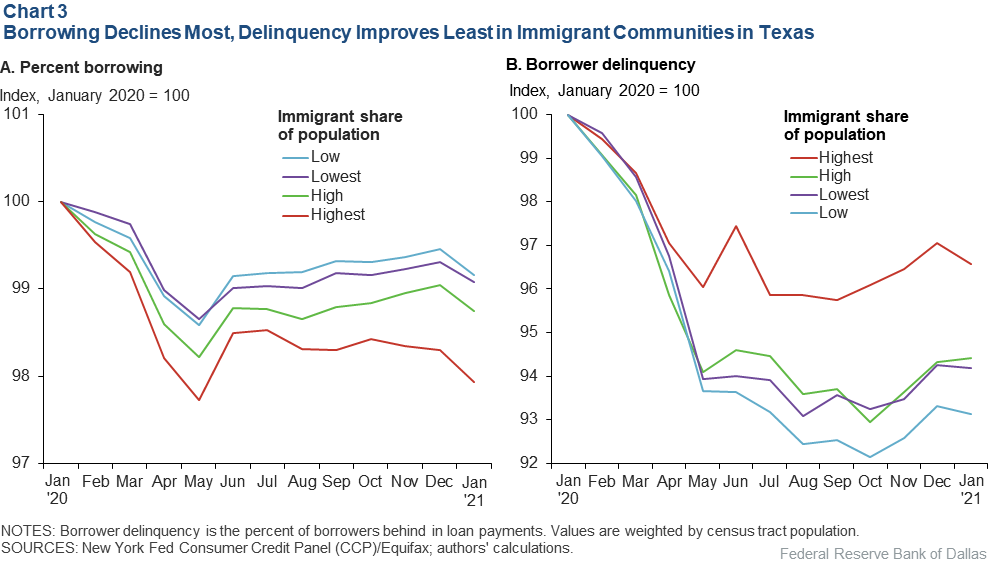
The CCP/Equifax data do not contain demographic identifiers that allow direct identification of immigrants. However, information is available on communities with high shares of foreign-born residents (Chart 3). Communities with higher shares of immigrants did well during 2020 but not to the extent of areas with lower shares.
Average values
| Immigrant share(%) | Share of borrowers(%) | Borrower delinquency(%) | ||
| Jan. 2020 | Jan. 2021 | Jan. 2020 | Jan. 2021 | |
| Lowest (0–13) | 76.1 | 75.4 | 18.5 | 17.3 |
| Low (13–23) | 75.9 | 75.2 | 20.5 | 19.0 |
| High (23–39) | 73.3 | 72.4 | 22.0 | 20.6 |
| Highest (>39) | 68.1 | 66.7 | 19.5 | 18.7 |
| NOTES: Borrower delinquency is the percent of borrowers behind in loan payments. Values are weighted by census tract population. SOURCES: New York Fed Consumer Credit Panel (CCP)/Equifax; authors' calculations. |
||||
For consumers included in the CCP/Equifax data, those living in tracts with greater shares of immigrants were less likely to take on consumer loans.[10] Soon after COVID-19 struck, however, the share of immigrants borrowing increased and trended with other groups throughout the year. For those tracts with the greatest immigrant share, 68.1 percent of consumers in CCP/Equifax had taken on consumer loans in January 2020; a year later, only 66.7 percent had, a tendency depicted in Chart 3, panel A, which is normalized to January 2020.
Delinquencies in high-immigrant areas declined, though not to the same extent as in communities with fewer immigrants, as seen in Chart 3, panel B. There were differences based on the type of debt. Higher-immigrant-share communities took on relatively more mortgage loans and less bank-issued card debt. Mortgage loan performance tended to improve, while auto and credit card borrowings were little changed.
While average credit scores improved as the tract immigrant share generally increased, those with the largest immigrant share improved more slowly.
Why the Gap?
There are several reasons why high-immigrant communities didn’t perform as well. Immigrant households tend to have lower income and wealth, and in Texas, about 37 percent of immigrants have no health insurance.[11] About 1.6 million Texans, or one-third of immigrants, were undocumented in 2017.[12]
During the pandemic, many immigrants were ineligible for stimulus checks and the enhanced unemployment benefits. The Coronavirus Aid, Relief, and Economic Security (CARES) Act—a $2.2 trillion measure that took effect in March 2020—also excluded households from stimulus if a member used an individual taxpayer identification number in place of a Social Security number when filing a joint tax return. Because many immigrants live in mixed-status families, an estimated 879,000 citizens and legal immigrants in Texans were excluded under those CARES Act provisions.[13]
Thus, nearly half of Texas immigrants could not collect the initial stimulus if they otherwise qualified. While the subsequent relief packages retroactively granted those stimulus payments to immigrant families, that delayed aid was not reflected in the data for 2020.[14]
The differing credit experiences may also be partially attributed to factors that affected immigrants’ participation in the credit market and the chance to receive lender accommodation. Throughout 2020, consumer credit standards tightened, and consumers with nonprime credit scores found it harder to obtain loans; the share of borrowers decreased.[15]
Immigrants with a relatively short credit history in the U.S. are more likely to fall into the nonprime category. The limited improvement in loan performance and creditworthiness may also indicate a lower rate of loan accommodation among immigrants. To get such assistance, borrowers must make a request and work with lenders to reach a loan payment modification agreement. Immigrants may be less familiar and more uncomfortable with this process.Additionally, if consumers have not participated in the credit market, they don’t exist in the credit data and lack a history needed for future borrowing. Thus, some consumers subsequently found themselves involuntarily excluded from the market.
This behavior pattern involving borrowing and loan performance is also apparent if census tracts are chosen based on limited English proficiency or on estimated undocumented immigrant shares.[16]
Although the CCP/Equifax primary sample is assembled based on prevalence of Social Security numbers and does not represent undocumented consumers per se, the immigrant consumer experience can be affected by undocumented family members. For example, language skills and how consumers communicate with financial institutions are important variables.
Communities with a higher share of immigrants tend to have lower income, but lower income alone cannot explain the observed trends. This becomes apparent when comparing census tract groups by median income levels instead of foreign-born share. The lowest-income tracts borrowed more at the beginning of the pandemic and improved credit scores the fastest, unlike communities with high-immigrant populations.
Greater Recovery Challenge
Although loan performance has been stable in Texas since the onset of COVID-19, the pandemic affected some communities more than others. Immigrants have higher shares of workers in critical industries and at-risk occupations and have been more vulnerable to the financial and health effects of the pandemic.
This is largely due to less access to health insurance, government assistance and consumer credit. Texas communities with a high share of immigrants have experienced greater challenges in their attempts to move past the economic hardships of the pandemic.
Notes
- We use the “primary” consumers of the CCP/Equifax, a 5 percent representative sample of adults in the U.S. with a credit history or public-record information.
- Loan accommodation is more prevalent for mortgages than auto loans and credit cards. Student loans are not included in the comparison because the repayment of all federal student loans, which account for about 90 percent of student loans, has been deferred until Sept. 30, 2021.
- “Update on How Households Are Using Stimulus Checks,” by Olivier Armantier, Leo Goldman, Gizem Koşar and Wilbert van der Klaauw, Liberty Street Economics, Federal Reserve Bank of New York, April 7, 2021.
- Interagency Statement on Loan Modifications and Reporting for Financial Institutions Working with Customers Affected by the Coronavirus (Revised), Board of Governors of the Federal Reserve System et al., April 7, 2020.
- Consumers typically make a forbearance request to lenders, who then decide whether to approve the request based on the type of loan and borrower situation. See “Government and Private Household Debt Relief During COVID-19,” by Susan F. Cherry, Erica Xuewei Jiang, Gregor Matvos, Tomasz Piskorski and Amit Seru, National Bureau of Economic Research, NBER Working Paper no. 28357, January 2021.
- “Facts on U.S. Immigrants, 2018; Statistical Portrait of the Foreign-Born Population in the United States,” by Abby Budiman, Christine Tamir, Lauren Mora and Luis Noe-Bustamante, Pew Research Center, Aug. 20, 2020.
- Census tracts represent small geographic areas with an average of 4,000 residents who are considered relatively homogeneous in terms of demographics and economic conditions. Data are from the American Community Survey (2014–18) retrieved from the Integrated Public Use Microdata Series (IPUMS), National Historical Geographic Information System.
- The Cybersecurity and Infrastructure Security Agency, a part of the Department of Homeland Security, defines essential workers as those employed in sectors that ensure “continuity of functions critical to public health and safety, as well as economic and national security.” About two-thirds of all industries are deemed essential. Major categories include health services, infrastructure, food supply chain, energy, communication, finance, utility, transportation and defense.
- “Immigrants, the Economy and the COVID-19 Outbreak,” released by the Joint Economic Committee, Vice Chair Rep. Don Beyer, June 30, 2020.
- Communities are ranked by foreign-born share of the population; from 0 to 12.6 percent (bottom half), 2.6 percent to 22.7 percent (50th to 75th percentiles), 22.7 percent to 39.1 percent (75th to 95th percentiles) and 39.1 percent to 75.4 percent (top 5th percentile). Instead of plotting the trends of aggregate shares of borrowers and delinquencies in each group, indexes were first calculated for each tract, with a weighted average index obtained for each group. Thus, unobserved differences inherent to the tracts before January 2020 would not affect the comparison.
- Data are from the 2019 American Community Survey.
- ”Mexicans Decline to Less than Half the U.S. Unauthorized Immigrant Population for the First Time,“ by Jeffrey S. Passel and D’vera Cohn, Pew Research Center, June 12, 2019.
- ”Mixed-Status Families Ineligible for CARES Act Federal Pandemic Stimulus Checks,“ Migration Policy Institute, May 2020.
- The December 2020 Budget Bill extended the second-round stimulus payment to these individuals and led them to retroactively apply for the first-round payment. See H.R. 133. These families are eligible to receive the third round of checks authorized by the March 2021 American Rescue Plan Act.
- Net Percentage of Domestic Banks Tightening Standards on Consumer Loans, Credit Cards, Federal Reserve Bank of St. Louis economic data, accessed May 7, 2021.
- We estimate the share of undocumented immigrants through the following: First, calculate the share of foreign-born residents born in Mexico/Hispanic countries who have a high school education or less and who arrived in the U.S. after 1980 (based on the American Community Survey at the Public Use Microdata Area level); multiply the share by tract-level foreign-born population; and then divide by the tract population. See ”Unauthorized Immigrant Totals Rise in 7 States, Fall in 14,“ by Jeffrey S. Passel, D’vera Cohn and Molly Rohal, Pew Research Center, Nov. 18, 2014.
About the Authors

Wenhua Di
Di is a senior research economist in the Research Department at the Federal Reserve Bank of Dallas.

Chloe Smith
Smith is a research assistant in the Research Department at the Federal Reserve Bank of Dallas.
Southwest Economy is published quarterly by the Federal Reserve Bank of Dallas. The views expressed are those of the authors and should not be attributed to the Federal Reserve Bank of Dallas or the Federal Reserve System.
Articles may be reprinted on the condition that the source is credited to the Federal Reserve Bank of Dallas.
Full publication is available online: www.dallasfed.org/research/swe/2021/swe2102.