Maquiladoras, Mexico’s engine of trade, driven to navigate evolving demand
The role of Mexican maquiladoras—large, mostly foreign-owned plants engaging in labor-intensive assembly of intermediate and final goods for export—has evolved over the years, though the basics remain the same.
Most inputs are imported duty-free from the U.S. or another country. U.S. tariffs are applied only to the value that is added by assembly on products sent back across the border.
However, more than two years removed from the onset of the COVID-19 pandemic, the maquiladora operating environment has changed. Global trade, including chronic input shortages and the specter of a worldwide economic slowdown, poses tough challenges. Moreover, longstanding auto assembly and parts businesses, making up the largest portion of maquiladora output, confront a transition to electric vehicles that require new and different manufacturing processes.
Manufacturing for Export
Rules adopted in 2007 merged the maquiladora industry and a program for homegrown exporters into what is currently known as the Manufacturing, Maquila and Export Service Industry Program.[1] The more familiar name, “maquiladora,” is used here. In 2021, maquiladoras accounted for 58 percent of Mexico’s manufacturing GDP (as well as a majority of the country’s manufacturing exports) and 48 percent of industrial employment.
For perspective, manufacturing represented 19 percent of Mexico’s overall GDP and 19 percent of employment. In the U.S., manufacturing accounts for 11 percent of GDP and 8.4 percent of employment.
Besides auto parts and automobiles, maquiladora production includes electronics, medical devices, aircraft parts and machinery. Maquiladoras also sell engineering services.
Following adoption of the North American Free Trade Agreement (NAFTA) in 1994, maquiladora activity became increasingly correlated with U.S. manufacturing production and, thus, susceptible to recessions and expansions north of the border.
When there is a pickup in U.S. consumer demand for refrigerators, televisions, washing machines or automobiles, production orders reach Mexican maquiladoras. They specialize in the relatively labor-intensive side of production, while the U.S. engages in the more capital-intensive part of the process.
By spreading production costs across borders and taking advantage of lower labor costs in Mexico, firms can produce at a lower average unit cost, which leads to greater competitiveness in both global and domestic markets and to lower prices for consumers.[2]
International competitors, notably Chinese manufacturers, have pressured the maquiladora sector, much as they have done to U.S. manufacturing. In the early 2000s, a U.S. recession and increased competition from China following the country’s entry into the World Trade Organization forced the maquiladora industry to downsize and cut employment.[3] The industry was again tested during the Great Recession of 2007–09 and later amid the onset of the pandemic in 2020.
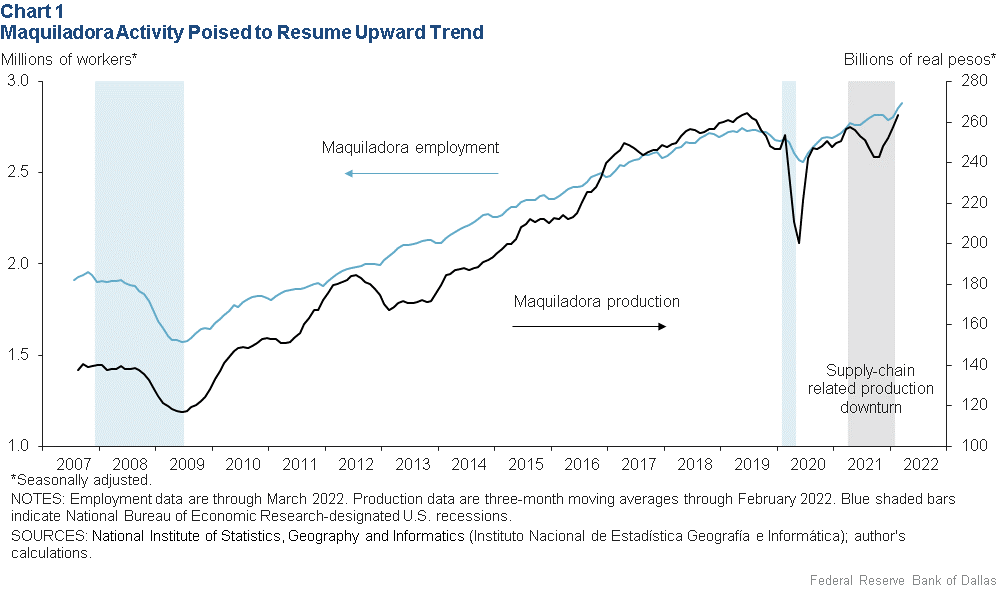
After the Great Recession, maquiladora employment took more than three years to recover, while production required a year and a half to return. By comparison, U.S. manufacturing has not yet recovered. Employment remains 5.2 percent below pre-Great Recession levels, while production lags behind by 2.9 percent.
In the wake of the pandemic in 2020, supply-chain issues particularly affected the automotive sector, reducing new orders and sending the maquiladora industry into another production downturn, the recovery from which required nine months (Chart 1). Employment was virtually unaffected, reflecting the difficulty of firing and then rehiring workers in Mexico.
Wages and Productivity
Of the many reasons for factories to locate in Mexico, proximity to the U.S. and preferential tariffs predominate. Mexico has 13 free-trade agreements with 50 countries—including the United States–Mexico–Canada Agreement (USMCA), the 2020 successor to NAFTA. There are also preferential considerations granted to maquiladoras.
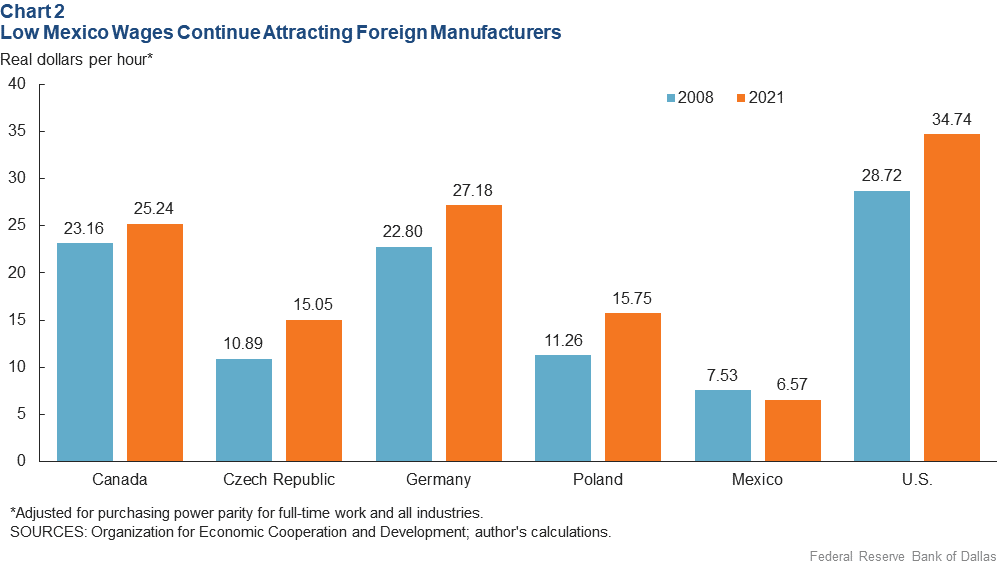
Mexico has a plentiful labor supply, with an economically active population of 58 million. Relatively low labor costs remain a primary factor prompting foreign companies—mainly from the U.S.—to locate manufacturing operations in Mexico. The country’s average hourly wage was $6.57 in purchasing-power-adjusted dollars in 2021, significantly lower than in other advanced economies such as Canada, $25.24; Germany, $27.18; and the U.S., $34.74. Mexican wages trail comparable eastern European economies such as Poland, $15.75, and the Czech Republic, $15.05 (Chart 2).
Such wage differences reflect much more than differences in labor costs; they also indicate more capital-intensive production and higher productivity among workers in the high-wage countries. Mexico’s low-cost labor and low-productivity growth is the product of less worker schooling and training combined with a large informal sector (relatively untaxed with little government oversight), lack of access to credit, government red tape and a poor business climate.[4]
Mexico’s gross domestic product per worker (in constant U.S. dollars calculated at purchasing power parity to ensure an accurate comparison) increased at an annual rate of 0.3 percent from 2010 to 2021. This is well below the average for the Czech Republic (1.4 percent) and Poland (2.6 percent) over the same period. Comparable GDP-per-worker growth was 1.3 percent in the U.S and 0.9 percent in Canada.[5]
U.S. Border Spillovers
Most maquiladora employment remains concentrated in Mexican border states (though plant proximity to the U.S. has not been a government requirement for many years). Together, the Mexican states bordering Texas (from east to west: Tamaulipas, Nuevo Leon, Coahuila and Chihuahua) plus the other border states of Sonora and Baja California represent 62 percent of total maquiladora employment.
Four of the top five maquiladora states border Texas. Historically, the economic benefits of these large industrial complexes have spilled over into neighboring Texas cities, creating jobs in manufacturing, warehousing, transportation, logistics, real estate and services.[6]
States adjacent to Texas tend to produce automobile-related parts and components, while those near California and Arizona specialize in consumer and business electronics.[7]
The industry concentration in northern Mexico has created an economic development divide that generally separates the northern and southern regions. In the north, where 30 percent of the population lives in poverty, the informal sector accounts for 40 percent of jobs. In the hardscrabble south, 57 percent of the population lives in poverty, the highest concentration in Mexico, and about 70 percent of the labor force works in the informal sector.[8]
Seeking New Opportunities
Maquiladoras have slowly shifted from low-skill, low-wage production toward high-wage, high-productivity operations. China’s entry into the World Trade Organization in 2001 hastened this evolution as lower-end production moved overseas.
The shift to higher productivity over the past several decades provides insight into where the industry is headed. The top five fastest-growing sectors—absent the period of pandemic disruption—are transportation equipment, paper, plastics and rubber products, fabricated metal products and primary metals manufacturing. This manufacturing activity generally boasts higher wages and higher labor productivity than the national average (Table 1).
| Table 1: Maquiladora Selected Statistics by Sector | |||||||
| Employment 2021 |
Share of total maquiladora employment (%) |
Change in employment 2008–19 (%) |
Average labor productivity growth 2008–19 (%) |
Hourly compensation wage, 2021 ($) |
Hourly compensation wage, 2021 ppp ($) |
||
| NAICS | Total nation | 2,791,909 | 40.8 | 2.2 | 4.76 | 9.60 | |
| 336 | Transportation equipment | 932,093 | 33.4 | 96.9 | 2.4 | 4.95 | 9.99 |
| 322 | Paper | 44,916 | 1.6 | 89.0 | 3.0 | 4.51 | 9.11 |
| 326 | Plastics & rubber products | 191,702 | 6.9 | 66.7 | 2.1 | 4.29 | 8.66 |
| 332 | Fabricated metal products | 148,898 | 5.3 | 53.1 | 2.8 | 4.93 | 9.95 |
| 331 | Primary metal mfg | 89,060 | 3.2 | 47.9 | 4.3 | 6.64 | 13.40 |
| 333 | Machinery, except electrical | 110,811 | 4.0 | 46.7 | 1.6 | 5.40 | 10.90 |
| 339 | Miscellaneous manufactured commodities |
215,179 | 7.7 | 46.4 | 1.2 | 5.09 | 10.29 |
| 323 | Printed matter and related products |
16,440 | 0.6 | 38.1 | 1.8 | 3.98 | 8.04 |
| 316 | Leather & allied products | 24,169 | 0.9 | 35.7 | 3.6 | 3.79 | 7.66 |
| 337 | Furniture & fixtures | 40,563 | 1.5 | 31.6 | -0.2 | 4.16 | 8.40 |
| 325 | Chemicals | 64,496 | 2.3 | 26.2 | 2.4 | 4.93 | 9.95 |
| 312 | Beverages & tobacco products |
38,524 | 1.4 | 14.5 | 0.7 | 5.88 | 11.88 |
| 334 | Computer & electronic products |
366,471 | 13.1 | 12.6 | -1.7 | 4.87 | 9.84 |
| 311 | Food & kindred products | 125,261 | 4.5 | 10.1 | 3.2 | 3.98 | 8.03 |
| 327 | Nonmetallic mineral products |
55,712 | 2.0 | 9.2 | 3.0 | 4.26 | 8.61 |
| 335 | Electrical equipment, appliances & components |
190,712 | 6.8 | 6.0 | 2.0 | 4.58 | 9.24 |
| 321 | Wood products | 9,531 | 0.3 | 0.6 | 2.6 | 3.57 | 7.21 |
| 314 | Textile mill products | 14,137 | 0.5 | -7.0 | -0.2 | 3.79 | 7.65 |
| 313 | Textiles & fabrics | 32,518 | 1.2 | -13.1 | 0.9 | 3.02 | 6.09 |
| 315 | Apparel & accessories | 80,716 | 2.9 | -34.4 | 0.9 | 2.44 | 4.92 |
| NOTE: The table refers to IMMEX statistics (Mexico's Manufacturing, Maquila and Export Service Industry Program); ppp stands for purchasing-power-parity-adjusted dollars.
SOURCES: National Institute of Statistics, Geography and Informatics (Instituto Nacional de Estadística Geografía e Informática); author's calculations. |
|||||||
Rubber and metal products manufacturers bend, form and weld metal and plastic parts used in the production of components and finished products for U.S. automakers. Paper manufacturing represents just 1.6 percent of total employment but has grown rapidly with the booming U.S. e-commerce business that boosted demand for boxes and other packaging.
By comparison, low-wage employment has declined, affecting sectors such as textiles and fabrics and apparel and accessories manufacturing.
Autos’ Leading Role
Maquiladoras’ future will likely include their biggest industry—auto parts manufacturing and auto assembly. U.S. and Mexico have a long history of motor vehicle production that preceded the maquiladora program.
Ford became the first entrant in Mexico when it began assembling Model Ts in Mexico City in 1925. General Motors and Chrysler built their initial Mexican assembly plants in the 1930s. Although the maquiladora program set the stage for U.S.–Mexico market integration, the auto industry did not take full advantage until the 1980s.[9]
During the decade, Mexico shifted its auto industry policy toward export promotion. Vehicle manufacturers responded by opening modern and competitive plants, representing the beginning of the process of integrating Mexico into North America’s auto industry.[10] Broader North American vehicle production consolidation came with NAFTA in 1994.
Transportation equipment manufacturing represents one-third of maquiladora employment and production and 3.6 percent of Mexico’s GDP. Besides cars, SUVs, buses and trucks, the sector includes all related manufacturing—engines and engine parts, electronics, steering and suspension components, brake systems, transmission and power-train components, seating and interior trim.
Transportation production employment growth averaged 9 percent per year from 2008 to 2021, while output as a percentage of total manufacturing increased from 9 percent in 2008 to 12 percent in 2021.
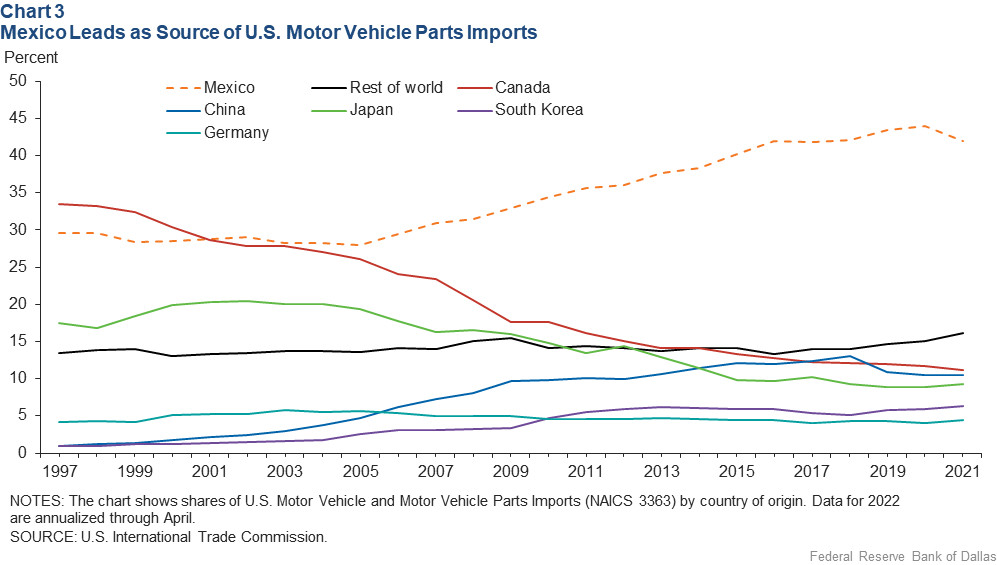
This expansion contributed to Mexico becoming a global leader in internal combustion engine vehicle manufacturing—No. 7 in total world vehicle production and No. 1 in Latin America.[11] Additionally, Mexico is No. 4 in automotive parts exports worldwide and the top supplier of autos and auto parts to the U.S. (Chart 3).
The transition to electric vehicles poses a challenge to Mexico’s transportation equipment manufacturing leadership. Almost 1.8 million electric vehicles were registered in the U.S. in 2020, more than three times as many as in 2016.[12] Detroit's Big Three automakers have announced plans for electric vehicles to represent 40 to 50 percent of new vehicle sales by 2030.
Manufacturing internal combustion and electric vehicles is fundamentally different. Electric vehicles are mechanically simpler, with many fewer parts than a traditional internal combustion unit. For example, a typical electric motor used to power an electric vehicle has three parts. By comparison, a typical four-cylinder internal combustion engine has 113 moving parts. A gearbox for an internal combustion engine vehicle has 27 moving parts; its electric vehicle counterpart has 12. Overall, an electric vehicle powertrain has 79 percent fewer moving and “wear” parts—meaning fewer parts to manufacture.[13]
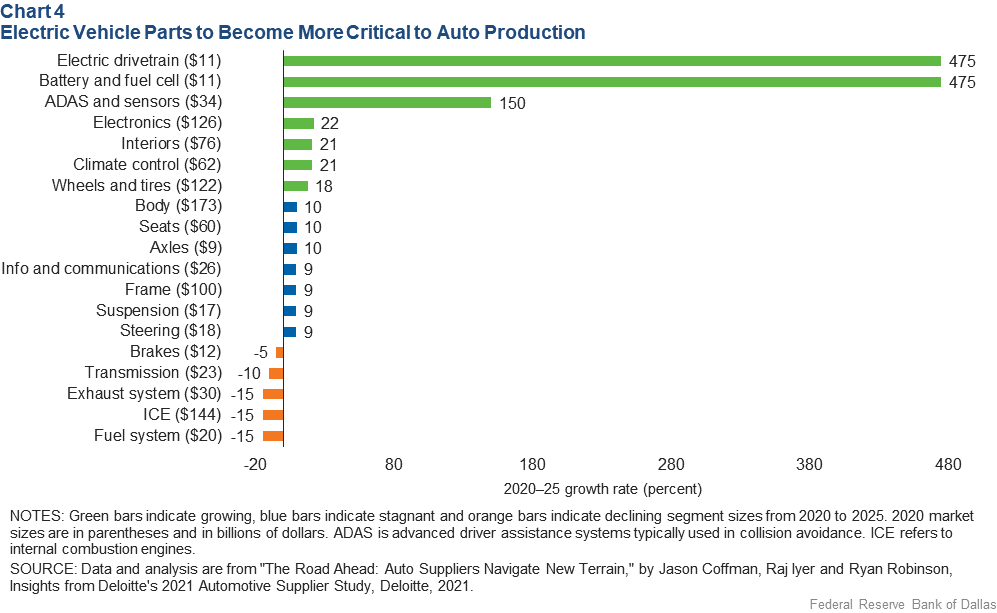
Industry experts anticipate that from 2020 to 2025, a large share of automotive component demand will shift toward electric powertrains, batteries, advanced driver assistance systems, sensors, infotainment and communication at the expense of conventional components such as transmissions, brakes, axles, exhaust systems, steering and fuel systems (Chart 4).[14]
Still other vehicle technology changes, such as more computer software and advances in autonomous driving, have accelerated a convergence of automotive manufacturing and technology, transferring significant supplier value from parts and components to software.
As a result, technology and consumer electronic companies are entering the automotive value chain. Japan’s Sony and China’s Baidu—neither traditional automakers—have announced plans to manufacture electric vehicles.
Studies undertaken of these developments’ impact on the European Union predict net automotive manufacturing job losses should a complete transition to electric vehicles occur. The European Association of Automotive Suppliers, for example, estimates a net job loss of 275,000 positions (about 8 percent of the total) because the 226,000 new jobs generated by growth in electric vehicle components will be insufficient to offset the roughly 500,000 jobs lost among automotive suppliers.[15] However, official reports by the European Commission show a much less severe impact on aggregate employment.[16]
Electric Vehicle Pivot
The U.S.–Mexico manufacturing relationship reflects decades of production integration, with large, specialized industries spreading costs across borders. As U.S. automakers plan their conversion to electric vehicle production, they are instituting changes in their Mexican subsidiaries.
General Motors announced in 2021 that it will invest $1 billion in its factory in Ramos Arizpe, Coahuila, to produce two electric Chevrolet SUVs in 2023. GM plans to offer 30 all-electric vehicles by 2025.[17] Ford recently began producing the Mustang Mach-E in Cuautitlan in the state of Mexico and announced two additional midsize electric crossovers will be built in the same plant.
Additionally, several electric vehicle parts manufacturers are believed to be looking at Mexican operations to support production for the U.S. market. China’s Contemporary Amperex Technology, the world’s biggest maker of batteries for electric vehicles, is considering plant sites in Ciudad Juárez, Chihuahua, and in Saltillo, Coahuila, to potentially supply Tesla and Ford—a possible $5 billion investment.[18]
While the maquiladora industry has quickly adapted to changes in technology and those arising from business cycles, the shift to electric vehicles is different, creating demand for new types of auto parts with possible competition from new market entrants.
Post-COVID Opportunity
Maquiladoras may benefit from the much-discussed reshoring or near-shoring of manufacturing arising from pandemic supply disruptions and simmering trade disputes with China.
Aggregate data don’t yet show clear evidence of a shift in U.S. imports from Asia and Europe to Canada and Mexico. Average import shares are about the same now as before the pandemic. Near-shoring won’t happen overnight, but Mexico could potentially capitalize from such an opportunity in the medium to long term.
The USMCA has applied new pressure to maquiladoras. It is more restrictive in some respects than NAFTA, particularly involving the automotive sector. It imposes restrictions on the origin of steel, aluminum and vehicle parts and new requirements governing labor and wages.
The new rules-of-origin and higher-wage requirements will increase production costs that, in turn, imply higher prices, reduced output and a decrease in consumer surplus in North America. Projections indicate the USMCA negatively affects all countries in North America, though Mexico stands to sustain the biggest loss to auto production and GDP.[19]
Mexican government policies pose another challenge for maquiladoras. For example, recent changes in electricity generation rules favoring the state-run utility over cheaper power sources could raise costs for businesses. Labor market regulations are also changing, pushing up labor costs.
Additionally, challenges to private sector and foreign investment in Mexico are increasing, something that is especially problematic given the country’s weak public investment.
These and other changes could signal a departure from what has been an investment-friendly environment since NAFTA, dimming Mexico’s prospects in what has become an increasingly volatile global business environment.
Notes
- See "Mexican Reform Clouds View of Key Industry,” by Jesus Cañas and Robert W. Gilmer, Federal Reserve Bank of Dallas Southwest Economy, May–June, 2007. IMMEX is the Spanish acronym for the Manufacturing, Maquila and Export Service Industry Program.
- “Intra-Industry Trade with Mexico May Aid U.S. Global Competitiveness,” by Jesus Cañas, Aldo Heffner and Jorge Herrera Hernández, Federal Reserve Bank of Dallas Southwest Economy, Second Quarter, 2017.
- “The Maquiladora’s Changing Geography,” by Jesus Cañas and Robert W. Gilmer, Federal Reserve Bank of Dallas Southwest Economy, Second Quarter, 2009.
- For more information, see “Productivity Growth in Mexico: Understanding Main Dynamics and Key Drivers,” by Leonardo Iacovone, Rafael Muñoz Moreno, Eduardo Olaberria and Mariana de la Paz Pereira López, World Bank, 2022.
- For more information see International Labor Organization statistics on labor productivity.
- “Texas Border Cities Illustrate Benefits and Challenges of Trade,” by Jesus Cañas, Federal Reserve Bank of Dallas Southwest Economy, Fourth Quarter, 2016.
- See note 3.
- “Mexico’s Four Economies Reflect Regional Differences, Challenges,” by Jesus Cañas and Emily Gutierrez, Federal Reserve Bank of Dallas Southwest Economy, Third Quarter, 2015.
- “Estimating Foreign Value-Added in Mexico’s Manufacturing Exports,” by Justino De La Cruz, Robert B. Koopman, Zhi Wang and Shang-Jin Wei, U.S. International Trade Commission, Office of Economics, working paper no. 2011-04A, April 2011.
- “The Growing Importance of Mexico in North America’s Auto Production,” by Thomas H. Klier and James M. Rubenstein, Federal Reserve Bank of Chicago Fed Letter, no. 310, May 2013.
- For additional information, see the Mexican Association of the Automobile Industry, “Importancia de la Industria Automotriz,” accessed Aug. 29, 2022.
- See “Global EV Outlook 2021,” International Energy Agency, April 2021.
- See “UBS Evidence Lab Electric Car Teardown—Disruption Ahead?” UBS Global Research, May 2017.
- “Caution Ahead: Transformation and Disruption for Automotive Suppliers,” Deloitte Insights, August 2019.
- “An Electric Vehicle-Only Approach Would Lead to the Loss of Half a Million Jobs in the EU,” European Association of Automotive Suppliers, June 2021.
- “Stepping Up Europe’s 2030 Climate Ambition: Investing in a Climate-Neutral Future for the Benefit of Our People,” European Commission staff impact assessment, European Union, Brussels, September 2020.
- See “GM to Invest $1 Bln in Mexico to Build Electric Vehicles,” by Sharay Angulo and David Shepardson, Reuters, April 29, 2021.
- See “Tesla’s Chinese Battery Maker Is Scoping Out Factory Sites in Mexico,” by Eric Martin, Gabrielle Coppola and Maya Averbuch, Bloomberg, July 17, 2022.
- For more, see “Mexico’s Higher Costs Under USMCA May Potentially Offset Gains from China-Related Trade Spurt with U.S.,” by Daniel Chiquiar, Jesus Cañas, Armando Aguirre and Alfonso Cebreros, Federal Reserve Bank of Dallas Southwest Economy, First Quarter, 2020.
About the Author
Jesus Cañas
Cañas is a senior business economist at the Federal Reserve Bank of Dallas.
Southwest Economy is published quarterly by the Federal Reserve Bank of Dallas. The views expressed are those of the authors and should not be attributed to the Federal Reserve Bank of Dallas or the Federal Reserve System.
Articles may be reprinted on the condition that the source is credited to the Federal Reserve Bank of Dallas.
Full publication is available online: www.dallasfed.org/research/swe/2022/swe2203.


