Blame costlier natural gas, rising fees for increasing Texas power bills
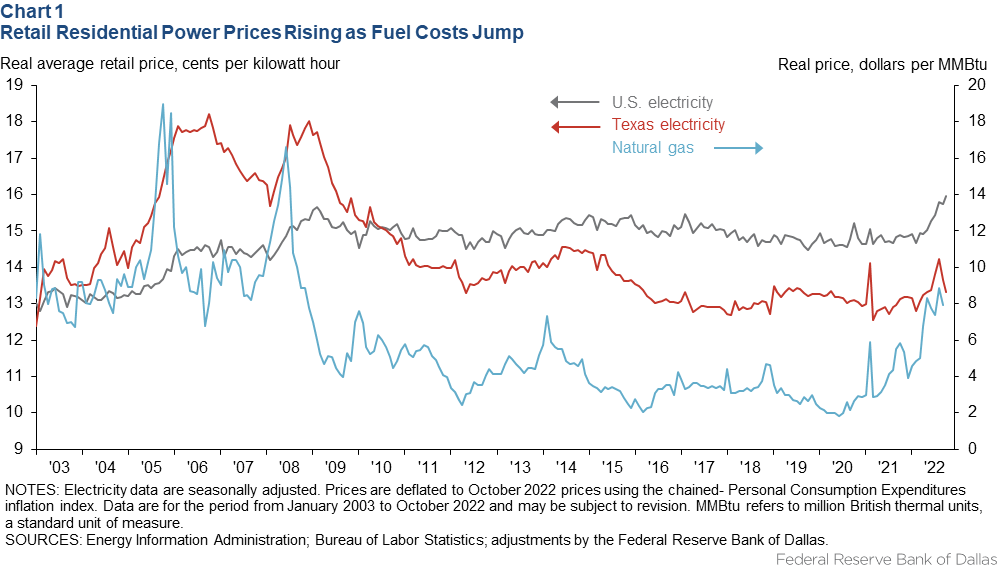
The cost of keeping the lights on in Texas homes has soared this year, as natural gas prices attained highs not seen since 2008. Real (inflation-adjusted) Texas electricity prices reached an average monthly high of 14.2 cents per kilowatt hour (kWh) in August, up more than 10 percent from the prior year.
By comparison, inflation-adjusted prices nationwide rose 7.7 percent to a high of 15.7 cents per kWh (Chart 1). U.S. prices have exceeded those in Texas since 2010.

The cost of fuel is a main reason for the faster growth of Texas power prices. Natural gas prices doubled over the 12 months ended in August to a monthly average of $8.58 per million British thermal units (MMBtu). They subsequently declined to $5.66 in October.
Natural gas provided 44 percent of the state’s electric power this past year versus 37 percent nationally. The structure of Texas’ power market also allows greater pass-through of costs to customers, as market pricing governs power producers and utilities. Prices are less flexible in more regulated markets that aren’t as tied to supply and demand.
Summer power prices were also affected by unusually high temperatures and comparatively low output from renewables—principally wind and solar—resulting in greater amounts of natural gas and coal combustion to meet record demand.
The number of “cooling degree days” in Texas—a type of population-adjusted proxy for how hard air conditioning systems have to work—reached 684 in July, the highest since the devastating summer heat wave of 2011.
Meanwhile, wind and solar power output fell 30 percent from June to August 2022, partly due to normal seasonal patterns and high temperatures that can lower the output from wind and solar facilities.[1] In the 12 months ended August 2022, the two renewable power sources’ combined share of Texas electricity production was double that of the nation, with 24 percent of the state’s power coming from wind and 5 percent from solar.
However, it’s not just fuel costs that have caused sticker shock for Texans as their residential power contracts have come up for renewal in 2022.
The Energy Reliability Council of Texas (ERCOT) has become more conservative in its approach to ensuring the stability of the power grid since it faltered badly during the freeze of February 2021. As a result, substantially more capacity has operated in reserve during high-demand episodes than in previous years.
While this strategy can lower the risk of outages, consumers must now pay for it. There were also significant costs associated with losses incurred during the 2021 freeze, which utility companies and ERCOT are attempting to recoup via higher service fees.
Movements in the average retail price paid for power tend to lag big shifts in fuel costs because only a subset of customers enter into new utility contracts at a given time. This means that current prices do not yet fully reflect recent increases in natural gas costs, and the prices Texans pay for power may increase further.
Additionally, a fire at a Freeport liquefied natural gas facility kept nearly 20 percent of U.S. export capacity offline from June through November 2022, which lowered the price of U.S. natural gas and helped rebuild domestic inventories.
The return of that export capacity this winter will put more U.S. gas into the high-priced global market. With modest expected U.S. production growth, those exports are likely to keep pressuring higher the amount Texans will pay for heat and power through the winter.
Note
- “Wind Generation Seasonal Patterns Vary Across the United States,” Energy Information Administration, Feb. 25, 2015, accessed Dec. 1, 2022.
About the author
Articles may be reprinted on the condition that the source is credited to the Federal Reserve Bank of Dallas.
The views expressed are those of the author and should not be attributed to the Federal Reserve Bank of Dallas or the Federal Reserve System.
Full publication is available online: www.dallasfed.org/research/swe/2022/swe2204.


