COVID-19 risks expose vulnerabilities, downside risks to U.S. outlook
The COVID-19 crisis has adversely affected the U.S. economy, helping account for a projected 3.4 percent contraction in 2020. The Congressional Budget Office (CBO) anticipates a strong 4.6 percent rebound in 2021, making up for those losses.
To assess the risks to the U.S. outlook and expose some of the underlying vulnerabilities, we make use of statistical tools to stress test U.S. gross domestic product (GDP) growth. We argue that a conservative assessment of the interdependencies highlighted by the COVID-19 crisis across countries suggests that projections for 2021 may be susceptible to the systemic risk that the pandemic poses.
Downside risks weigh on 2021 global outlook
We previously explored the importance of tail-risk events in the outlook for 2021 global growth; we examined historical evidence about cross-country dependencies in annual GDP growth from 1994 to 2019 for a sample of 39 countries, representing 78.4 percent of global GDP in 2019.
The joint forecast distribution over all likely outcomes is based on an estimated Clayton copula—a distribution function utilizing probability theory to highlight dependencies among tail events across countries. It covers December 2020 forecast distributions of 2021 annual GDP growth for the 39 countries, as reported by Consensus Forecasts.
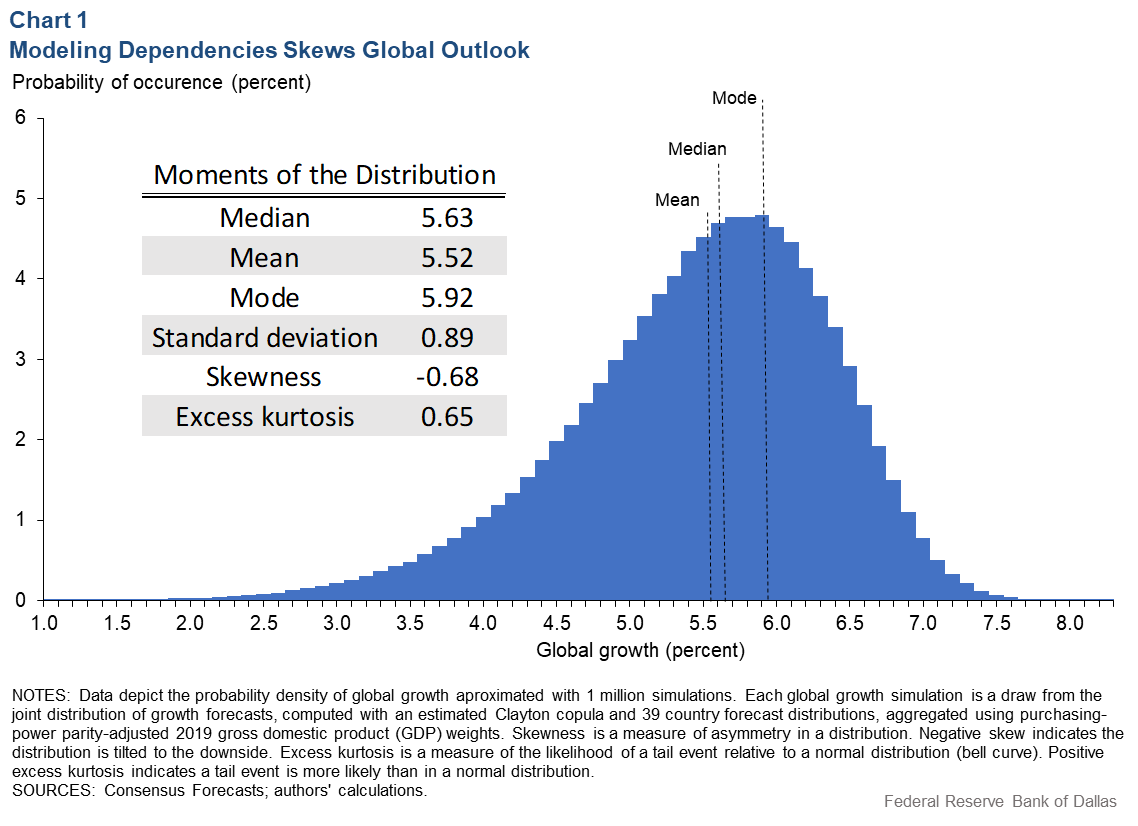
We estimate a distribution of the global output growth forecasts for 2021—incorporating significant left-tail dependencies (systemic risk)—while weighting each country according to its share of purchasing-power-parity adjusted global output in 2019 (Chart 1). Purchasing power parity provides a common basis of valuing output across countries.

In some respects, Chart 1 is a conservative scenario, because recent data don’t appear to include widespread cross-country, correlated tail events such as those associated with the pandemic. Nonetheless, even these estimates of cross-country tail dependence result in a distribution of global growth forecasts tilted to the downside.
In a distribution with the long left tail of Chart 1, the severity and likelihood of growth underperformance increases. Such systemic risk—negative outcomes correlated across countries—suggests greater likelihood of downside risk to the global outlook.
Stress testing the U.S. outlook amid global risks
This conservative scenario involving systemic risk can be applied when looking at the U.S. outlook. Stress testing for adverse tail events is used regularly to evaluate the vulnerability of the financial system. It can also provide valuable insights about the resilience—or lack thereof—of the U.S. economy.
To stress test the U.S. outlook, we simulate 2021 global growth 1 million times—using our estimated Clayton copula and data from Consensus Forecasts—and focus on a subset of the worst global outcomes. The mean growth rate for this simulation was 5.5 percent. We break down the outcomes by their severity, ranging from the worst 0.5 percent of outcomes (global growth below 2.7 percent) to the worst 25 percent of outcomes (global growth below 5 percent).
By analyzing how the U.S. performs in simulations where the global economy performs poorly, we can assess how robust the U.S. is to globally correlated negative shocks at the left tail of the distribution.
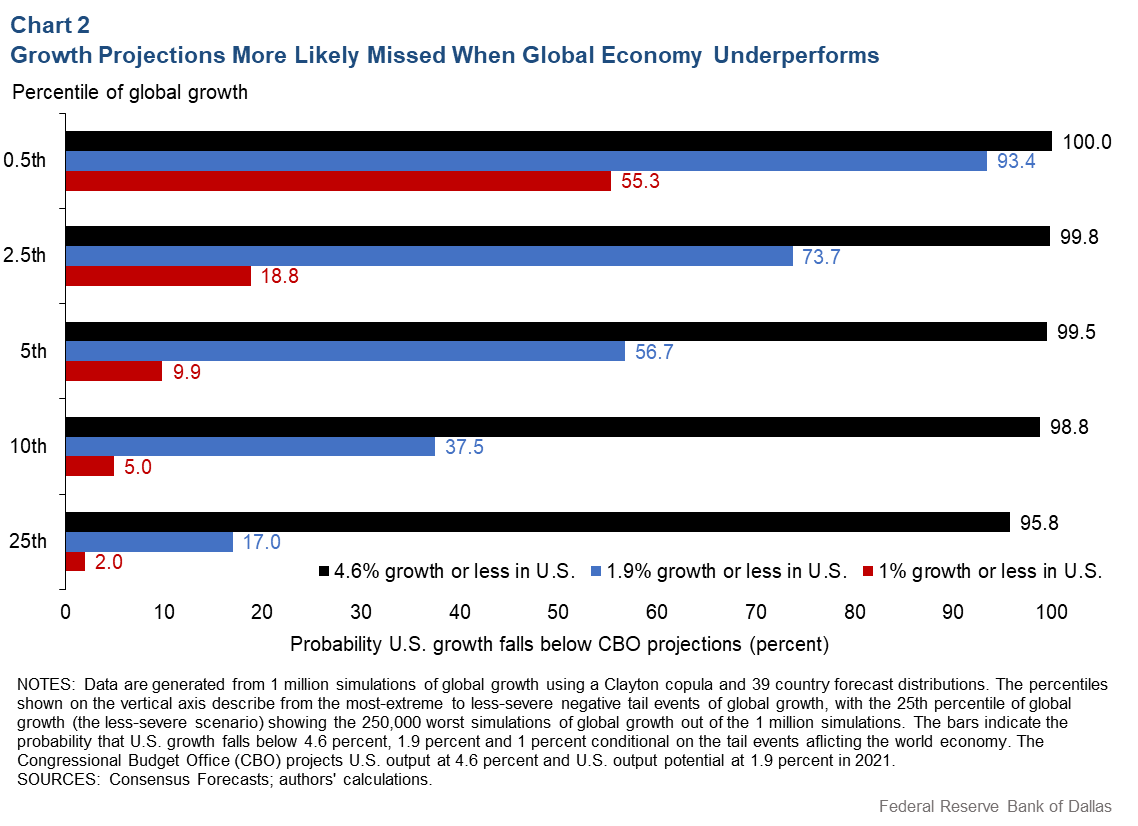
We consider three benchmark scenarios for the U.S. economy in Chart 2. In the first one, we consider how likely it is that the U.S. economy would underperform the CBO’s 4.6 percent projected growth in 2021. We also consider two others: the probability that the U.S. grows below the CBO’s estimate of U.S. output potential—the CBO’s estimate of maximum sustainable U.S. output—set at 1.9 percent for 2021, and the probability that U.S. growth falls below 1 percent.

The three scenarios illustrate U.S. economic performance and that of the rest of the world—in particular, the impact should worst-case scenarios of the global growth outlook materialize.
Learning from vulnerabilities that systemic risk poses
In this stress-testing exercise, the U.S. expansion appears quite vulnerable when poor global growth occurs. Our evidence suggests that even tail events that are not particularly severe are expected to often coincide with U.S. output growth below the CBO’s 4.6 percent estimate. In fact, the odds are quite great that U.S. output growth could end up below the CBO’s 1.9 percent GDP potential in the worst-case global growth scenarios that we have considered.
The more extreme the negative global growth outcome becomes, the more likely that the U.S. recovery would falter in 2021. For the starkest case of rare negative tail events—the worst 0.5 percent of scenarios—the odds of U.S. growth below potential are 93.4 percent, and the likelihood that U.S. growth falls below 1 percent is 55.3 percent.
If we zoom out a little, 25 percent of the time the U.S. has at best a 4.2 percent chance of meeting its CBO growth estimate. This has significant implications for policymakers. Global spillovers, whether through trade or financial channels, expose the U.S. to the consequences of globally correlated (systemic) shocks such as those that arose during the pandemic.
Even if the virus could be contained domestically, the U.S. economy would still suffer the impact of weak global demand and global supply chain and financial disruptions, as well as heightened uncertainty and likely greater asset price volatility.
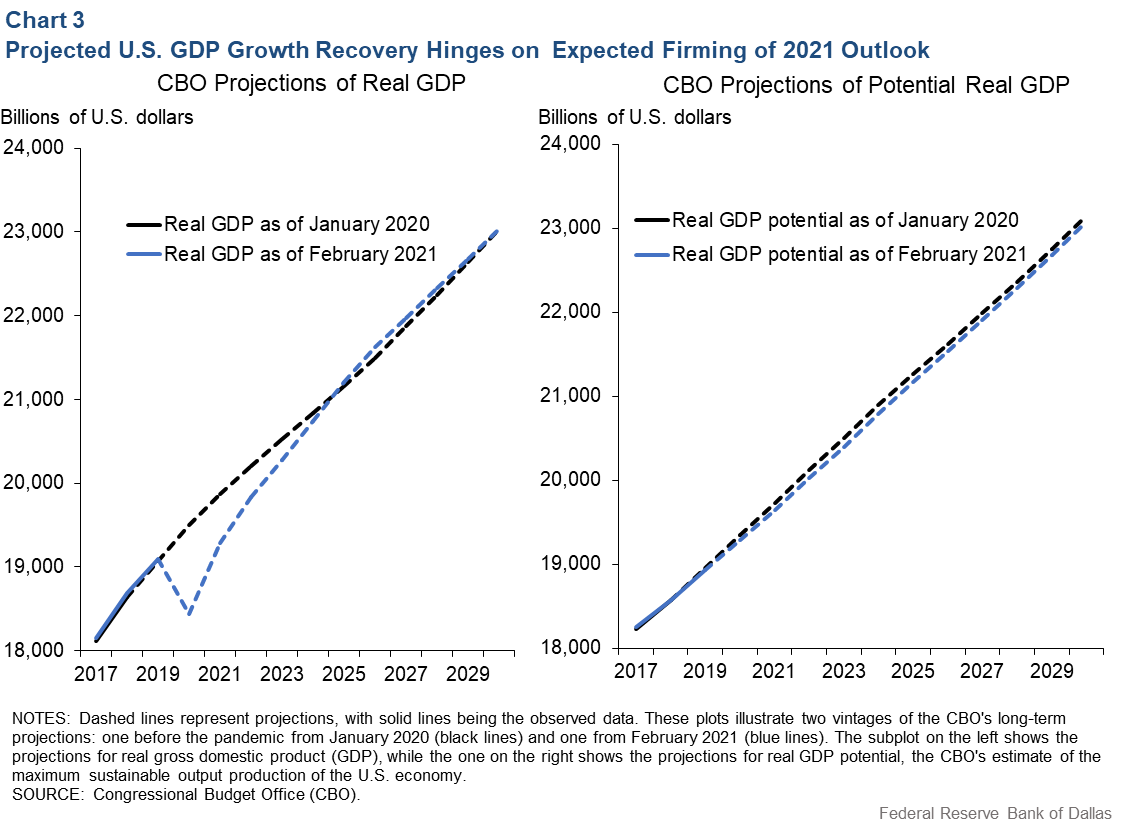
The left panel of Chart 3 is the CBO’s forecast of real (inflation-adjusted) GDP for the next decade. The right panel plots the CBO’s estimate of the maximum sustainable output for the U.S. economy (U.S. GDP potential).

The pandemic may have resulted in a modest erosion of the U.S. long-term potential. However, 2021 is going to be a pivotal year on the road to a sustained recovery of the real GDP toward prerecession levels, long-term CBO projections suggest.
If U.S. growth falters in 2021 as a result of pandemic-related vulnerabilities, the path of recovery will likely require reassessment. The longer the recession drags on, the more significant the impact on the U.S. economy’s potential can become—mostly through its impact driving up long-run unemployment—and the longer it may take for real GDP to return to its prerecession path.
Cautiously looking at 2021 and beyond
Modeling tail-event dependencies and deploying stress-testing practices can bring to light not just the vulnerabilities of the global economy but also the exposure of the U.S. economy to globally correlated shocks.
After the COVID-19 crisis unexpectedly hit the global economy in 2020, it became apparent that a more transparent and quantitative way of risk modeling can be useful to spot vulnerabilities caused by tail events and cross-country dependencies. Such a toolkit can also be useful to better manage the risk and maintain public confidence.
About the Authors
The views expressed are those of the authors and should not be attributed to the Federal Reserve Bank of Dallas or the Federal Reserve System.


