
Limited Impact of Rising Energy Prices on U.S. Inflation, Inflation Expectations in 2020–23
Predictions of $100 per barrel oil during the coming winter have raised fears of persistently high inflation and rising inflation expectations for years to come. However, quantitative analysis suggests that these concerns have been overstated.
The rapid surge in inflation rates in 2021 reflected rising demand, as the economy adapted to the COVID-19 pandemic, tight labor markets, supply chain disruptions and the recovery of energy prices from their pandemic lows.
With the price of West Texas Intermediate (WTI) oil rising above $80 per barrel in October, concerns have grown that the oil price could reach $100 in the winter, as power plants in Europe and Asia switch to petroleum products because of a shortage of coal and natural gas.
Such a surge in oil demand combined with low oil inventories, inadequate oil production in OPEC+ countries and anemic growth in U.S. shale oil production could push the oil price to levels not seen since the early 2010s.
Inflation Expectations Concerns
There are growing worries among policymakers and analysts that further, substantial oil price increases could push U.S. inflation higher for extended periods as well as drive up consumers’ inflation expectations, as rising oil prices are reflected in retail gasoline prices.
Such a development could lead to inflation expectations becoming embedded in the wage- and price-setting process. For example, analysts at Bank of America warned on October 1, 2021, that oil could surge above $100 in the event of a cold winter and spark inflation. Despite these warnings, there has been no quantitative analysis of this scenario.
These concerns prompt two key questions. First, to what extent have shocks to the gasoline price affected U.S. inflation and inflation expectations since the beginning of the pandemic? Second, how much further would a rise in the price of oil to $100 in the winter of 2021–22 increase inflation and inflation expectations and how persistent would these effects be over the next two years?
Our analysis of these questions is based on a structural econometric model of the relationship between nominal retail gasoline prices, headline consumer price inflation and the Michigan Survey of Consumers’ median household expectation of one-year inflation expectations, recently proposed by Lutz Kilian and Xiaoqing Zhou.
What Happened So Far
Chart 1 plots the cumulative contribution of gasoline price shocks to headline Consumer Price Index (CPI) inflation rates based on the estimated model. A positive value indicates by how many percentage points all gasoline price shocks to date have raised inflation in a month (expressed as annualized rates); a negative value indicates by how much they have lowered inflation in that month. We first focus on the impact of gasoline price shocks from June 2019 to August 2021.
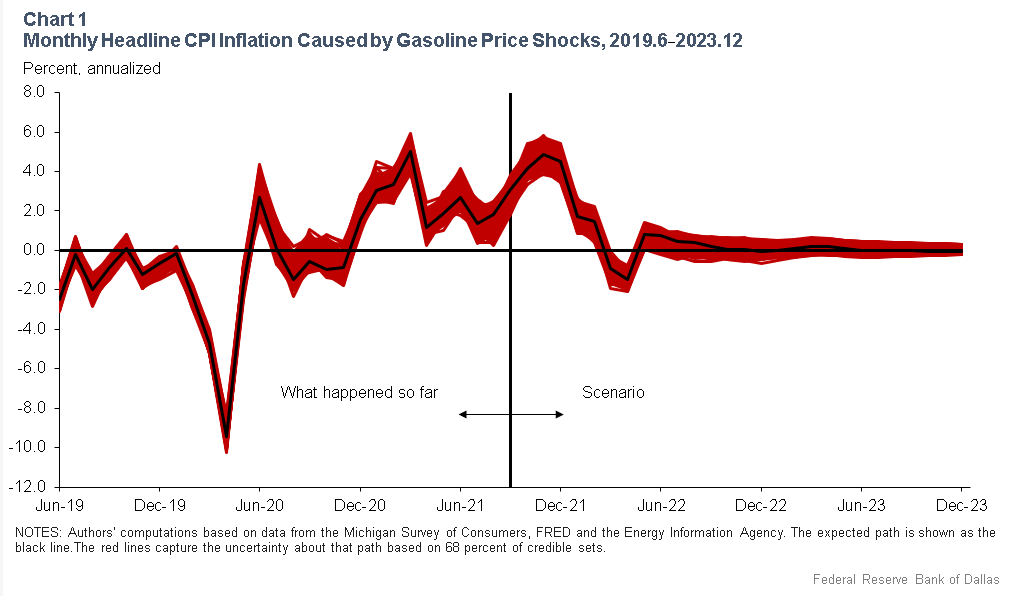
The unexpected drop in gasoline prices in early 2020, as the pandemic paralyzed the U.S. economy, lowered headline inflation by 9 percentage points on an annualized basis. This drop explains nearly all of the temporary decline in inflation during that period. Starting in May, the economy and, hence, gasoline prices began recovering. Inflation briefly spiked in June 2020 as a result. It was only in December 2020, however, that gasoline price shocks started to persistently raise headline inflation.
In early 2021, the recovery in gasoline prices added as much as 5 percentage points to headline inflation. This effect starting waning later in the summer. In August, gasoline price shocks added a mere 1.8 percent to annualized inflation.
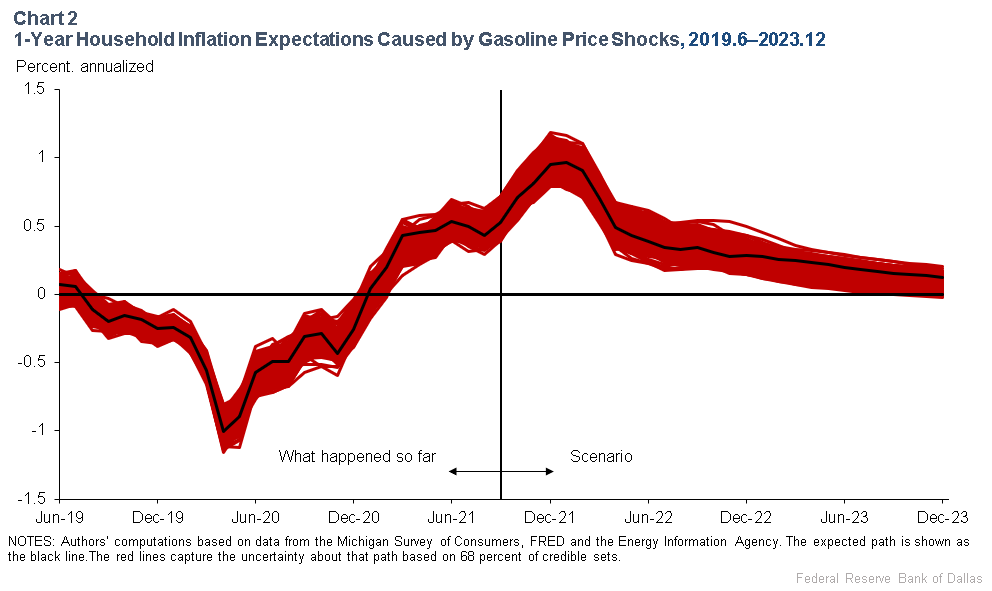
The fall and rise in gasoline prices during the pandemic are also reflected in household inflation expectations. There is clear evidence that unexpected gasoline price fluctuations temporarily lowered inflation expectations by as much as 1 percentage point at the height of the lockdown in early 2020 (Chart 2). As the price of gasoline recovered, it pushed inflation expectations up by as much as 0.5 percentage points in 2021, with expectations stabilizing starting in March 2021.
This evidence shows that gasoline price shocks have played an important role in driving both headline inflation rates and one-year inflation expectations during the pandemic. Their importance derives from gasoline prices’ tendency to be a bellwether for broader changes in economic activity and in other consumer prices.
This raises the question of how much further a rise in the price of oil to $100 per barrel would drive inflation and inflation expectations and how long these effects would last. We address this question by modeling this situation within our structural model. We start by describing a scenario for the WTI price that reflects the concerns articulated by the Bank of America analysts and other observers.
The $100 WTI Oil Scenario
In our thought experiment, the price of WTI crude oil gradually rises from $72 in September 2021 to $100 in December 2021 and remains at that level through February 2022, before gradually dropping to a long-run price of $80 (Chart 3).
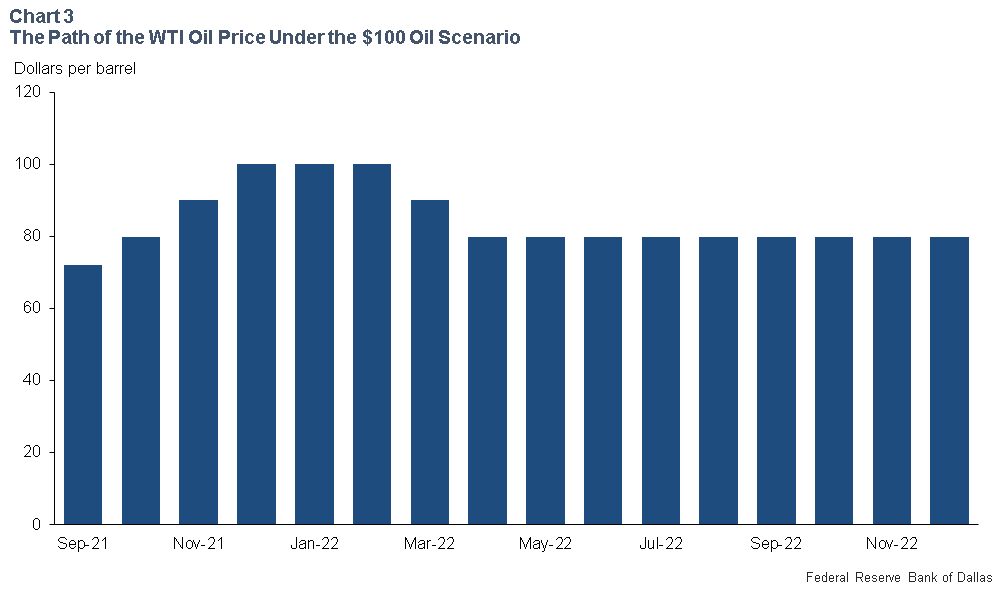
The assumption of rising oil prices from October to December reflects the view that the market will tighten considerably, as consumers of fuels including power plants scramble to find supplies at a time when inventories are already low.
During December through February, when temperatures are at their lowest, the price is expected to peak at $100 per barrel. The assumption of a decline in the oil price starting in March 2022 reflects lower oil consumption, as the weather warms. The assumption that the price remains constant in the long run is equivalent to assuming that the price of oil is not expected to change from May 2022 to December 2023. Similar results would be obtained with a long-run price of $70 per barrel.
This scenario ignores the demand destruction expected at higher oil prices as well as possible supply responses from OPEC+ or other producers. It implicitly assumes that the winter in the Northern Hemisphere will be unusually harsh and that the global supply of oil will remain constrained. This makes it of particular interest for assessing the upside inflation risks associated with the oil market.
Impact on Headline CPI Inflation, Inflation Expectations
Under our thought experiment, the growth rate in the nominal U.S. retail price of gasoline is half that of the growth rate of the price of oil implied by Chart 3, given that the share of crude oil in the cost of producing gasoline is roughly 50 percent.
We use the estimates of our structural model to simulate the evolution of headline inflation and inflation expectations under the maintained assumption that the percent change in gasoline prices follows this hypothesized path, while setting all other shocks in the model to zero in expectation.
Chart 1 shows that this scenario is associated with a rise in headline inflation not unlike that caused by the gasoline price shocks in early 2021, but starting from a higher base level. At the peak, gasoline price shocks add 5 percentage points to annualized inflation. This effect quickly fades in 2022, however, and becomes negligible by 2023. In other words, the inflationary effects of positive gasoline price shocks vanish almost as soon as gasoline prices stop rising.
Chart 2 showed that one-year inflation expectations had already risen to 0.5 percentage points by August 2021. The further surge in gasoline prices we hypothesized would double that impact, raising inflation expectations by as much as 1 percentage point in early 2022, before gradually falling off. Unlike headline inflation, inflation expectations remain somewhat elevated throughout 2022 and even in 2023, however.
How Much of a Concern Is This Scenario?
Table 1 summarizes the main results. It shows that, under this scenario, about 3 percentage points of the annual inflation increase in 2021 can be attributed to gasoline price shocks, but only 0.2 percentage points in 2022 and 0.1 percentage points in 2023. In contrast, the effect on inflation expectations in 2021 is only 0.5 percentage points, but that effect persists in 2022 before coming down to 0.16 percentage points in 2023.
Table 1: Inflationary Effects by Year Under the $100 Oil Scenario
(percentage points)| 2021 | 2022 | 2023 | ||
| Annual headline CPI inflation | 3.07 | 0.22 | 0.08 | |
| 1-year inflation expectation | 0.50 | 0.50 | 0.16 | |
| NOTE: Computations based on estimated structural econometric model. | ||||
The estimates suggest that fears that further oil price increases to $100 in the winter of 2021–22 would trigger an era of prolonged inflation are not supported by the data. The impact of 0.2 percentage points in 2022 is nonnegligible, but modest. Our estimates illustrate the well-documented fact that even large positive gasoline price shocks have no persistent effect on U.S. inflation. Though the price level remains elevated, its rate of growth returns to zero rather quickly.
There is evidence that the hypothesized temporary oil price surge would raise inflation expectations by about a half-percentage point in 2022, but these magnitudes appear modest compared with historical variation in household inflation expectations over time, and any effect they may have on headline inflation is already incorporated in the estimated inflation response.
Our analysis speaks to the component of inflation and inflation expectations driven by gasoline price shocks. Obviously, rising gasoline prices are only one source of inflationary pressures. This post does not speak to the broader cost pressures from tight labor markets and sustained disruptions of supply chains which have also been putting upward pressure on U.S. consumer prices.
About the Authors

Lutz Kilian
Kilian is a senior policy advisor in the Research Department at the Federal Reserve Bank of Dallas.

Xiaoqing Zhou
Zhou is a senior research economist and advisor in the Research Department at the Federal Reserve Bank of Dallas.
The views expressed are those of the authors and should not be attributed to the Federal Reserve Bank of Dallas or the Federal Reserve System.