How did federal stimulus recipients use their checks?
When the COVID-19 pandemic hit, the unemployment rate jumped from 3.5 percent in February 2020 to 14.8 percent two months later amid fears that the ensuing recession would be deep and long lasting.
To boost incomes and support the spending needs of low- and moderate-income groups, three rounds of stimulus checks, or Economic Impact Payments, were distributed. The bulk of the first round of stimulus checks was sent in April 2020, followed by round 2 in January 2021 and round 3 in March 2021. The first-, second- and third-round payments were $1,200, $600 and $1,400, respectively, for a fully qualifying single adult, and $3,400, $2,400 and $5,600 for a married couple with two dependent children. The third-round stimulus payments were the most generous.
Aggregate effects of stimulus payments
The stimulus payments provided a substantial boost to disposable personal income, consumer spending and personal savings. As intended, the payments significantly increased household incomes (Chart 1). The payments accounted for about 18.6 percent of personal disposable income in March 2021 (round 3), compared with 13.7 percent in April 2020 (round 1) and 8.7 percent in January 2021 (round 2).
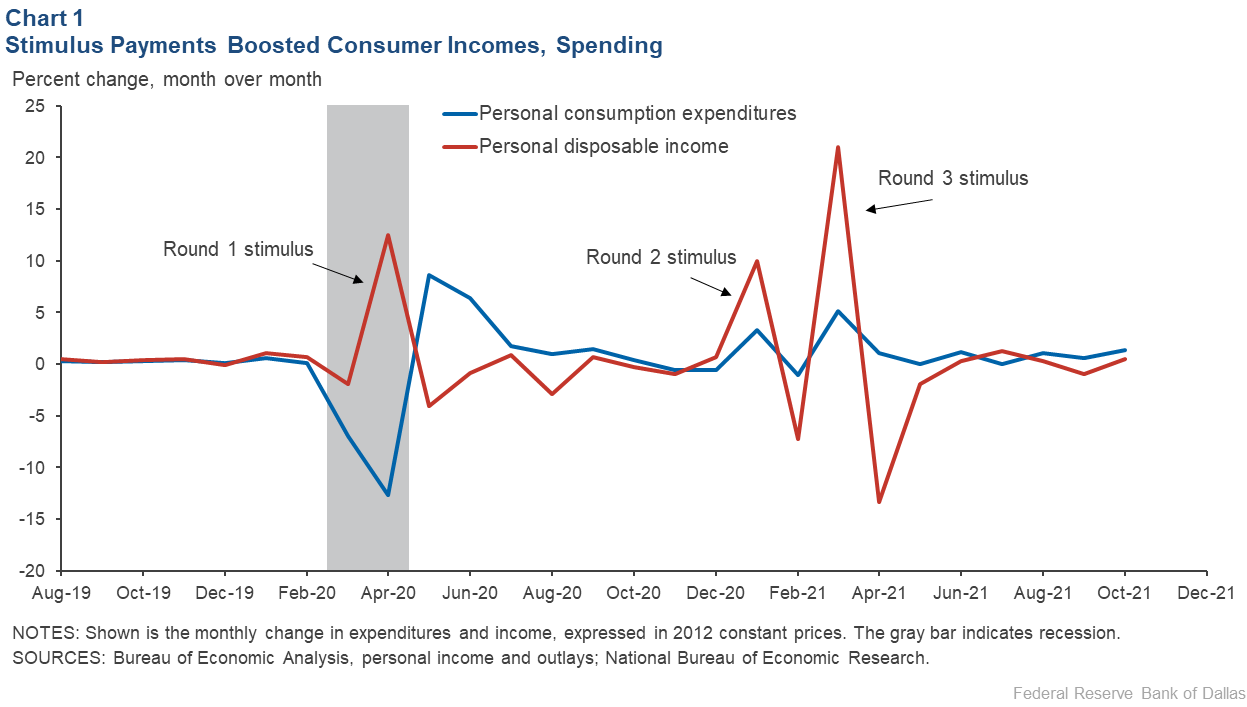
More importantly, the first-round stimulus payments and other pandemic-related government payments to households helped halt and then reverse an unprecedented 6.7 percent decline in consumer spending in March 2020 and a 12.2 percent drop April 2020. Instead, spending gains of 8.4 and 5.9 percent occurred in the following two months.
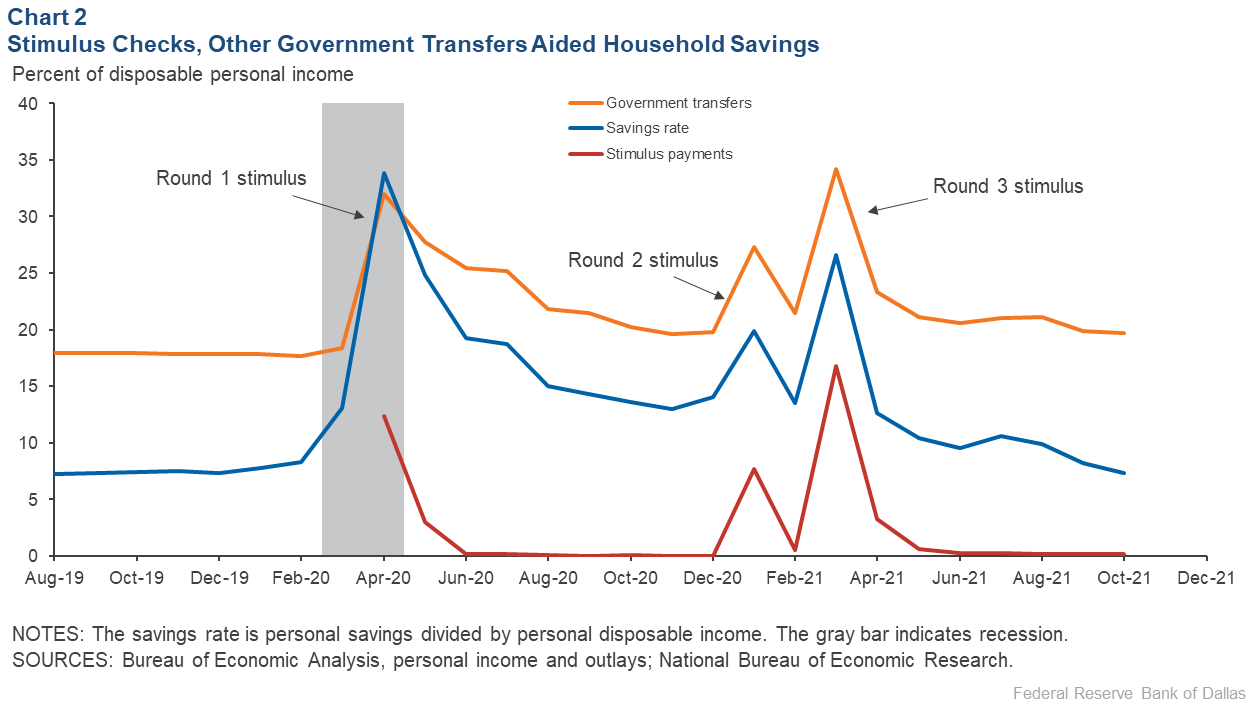
The personal savings rate—the share of current personal disposable income that isn’t spent— jumped as COVID-19 concerns brought large swaths of the economy to a halt. It peaked at an unprecedented level of almost 34 percent in April 2020 (Chart 2). (In the 50 years preceding the onset of the pandemic, the peak savings rate was 17.7 percent.)
The jump in the savings rate coincided with historic levels of layoffs and consumer uncertainty brought by COVID-19’s arrival, countered by large stimulus payments and other government support for households and the unemployed. Spending also sharply fell for services such as restaurants and lodging at a time of expanding lockdowns and the fear of infection.
Although the timing of the savings rate peak corresponds with the bulk of round 1 stimulus payments, the payments are only one of many factors behind the spike in savings. Chart 2 shows that the timing of rounds 2 and 3 corresponded with smaller spikes in the savings rate in January and March 2021.

Household Pulse Survey provides added insight
Of course, it would be good to see more direct evidence of how households, especially those hardest hit by the pandemic, responded to the stimulus-check payments. The Census Bureau’s Household Pulse Survey provides some useful information.
When the pandemic emerged in first quarter 2020, the Census Bureau initiated the Household Pulse Survey to quickly collect and disseminate data showing how people’s lives were affected. Starting in April 2020, 60,000 or more respondents were surveyed every week or two weeks about the pandemic and how stimulus checks were used.
Stimulus recipients’ main use of payments changed over time
Almost three-quarters (73.0 percent) of first-round stimulus recipients reported that they mainly spent their payments, compared with about a quarter or less of second-round recipients (25.8 percent) and third-round recipients (22.5 percent) (Table 1). Between the first and subsequent rounds, the share of recipients who mostly saved their stimulus payments roughly doubled, from 12.5 percent (round 1) to 22.4 percent (round 2) and 25.3 percent (round 3). Respondents from low- and moderate-income households were more likely to mainly spend round 1 stimulus checks and pay down debt with round 2 and 3 checks.
Table 1: Main Use of Stimulus Payments Varied by Stimulus Round
| Primary use of stimulus payments | Mostly spent (%) | Mostly saved (%) | Mostly paid down debt (%) | |
| Round 1 | 73.0 | 12.5 | 14.6 | |
| Round 2 | 25.8 | 22.4 | 51.8 | |
| Round 3 | 22.5 | 25.3 | 52.3 | |
| NOTES: Round 1: survey weeks 7–12 (June 6 to July 21, 2020); round 2: survey weeks 22–26 (Jan. 6 to March 15, 2021); round 3: survey weeks 28–33 (April 14 to July 5, 2021). Percentages do not sum to 100 percent due to rounding. SOURCE: Census Household Pulse Survey, weighted responses. |
||||
The share of respondents reporting that they mostly used stimulus payments to pay down debt increased sharply from less than one in seven (14.6 percent) in the first round to more than half in the second and third rounds (51.8 percent and 52.3 percent, respectively).
It’s likely that as people felt more confident about the economic outlook and their financial positions, they chose to reduce future payments and avoid future evictions or foreclosures by paying down debt. One caveat: Survey respondents in rounds 2 and 3 were asked about the use of stimulus payments received in the prior seven days, so spending is likely underestimated.
Overall, Table 1 suggests that the first-round stimulus payments were very effective in supporting the spending needs of credit-constrained and/or low- and moderate-income groups. The round 2 and 3 stimulus payments were less effective in supporting spending and probably could have been better targeted despite helping many people pay down debt.
Researchers have used different sources (survey data, credit card data or bank account data) to estimate the impact of the first-round stimulus payments on spending. Unfortunately, the range of estimates of the so-called “marginal propensity to consume” is wide, running from 25 percent to 50 percent or more. The range of estimates reflects differences in population coverage, spending definitions and time horizons covered. Nevertheless, the Household Pulse Survey responses in Table 1 are consistent with the higher end of the range of the marginal-propensity-to-consume estimates.
Differences in stimulus use by race and ethnicity
A higher percentage (10 percentage points or more) of Black and Hispanic stimulus recipients than white recipients mainly spent their first-round payments, reflecting the greater incidence of layoffs and job losses for these groups and their lower levels of financial resources (Chart 3). By contrast, more white recipients (about 10 percentage points) mainly saved their first-round payments.
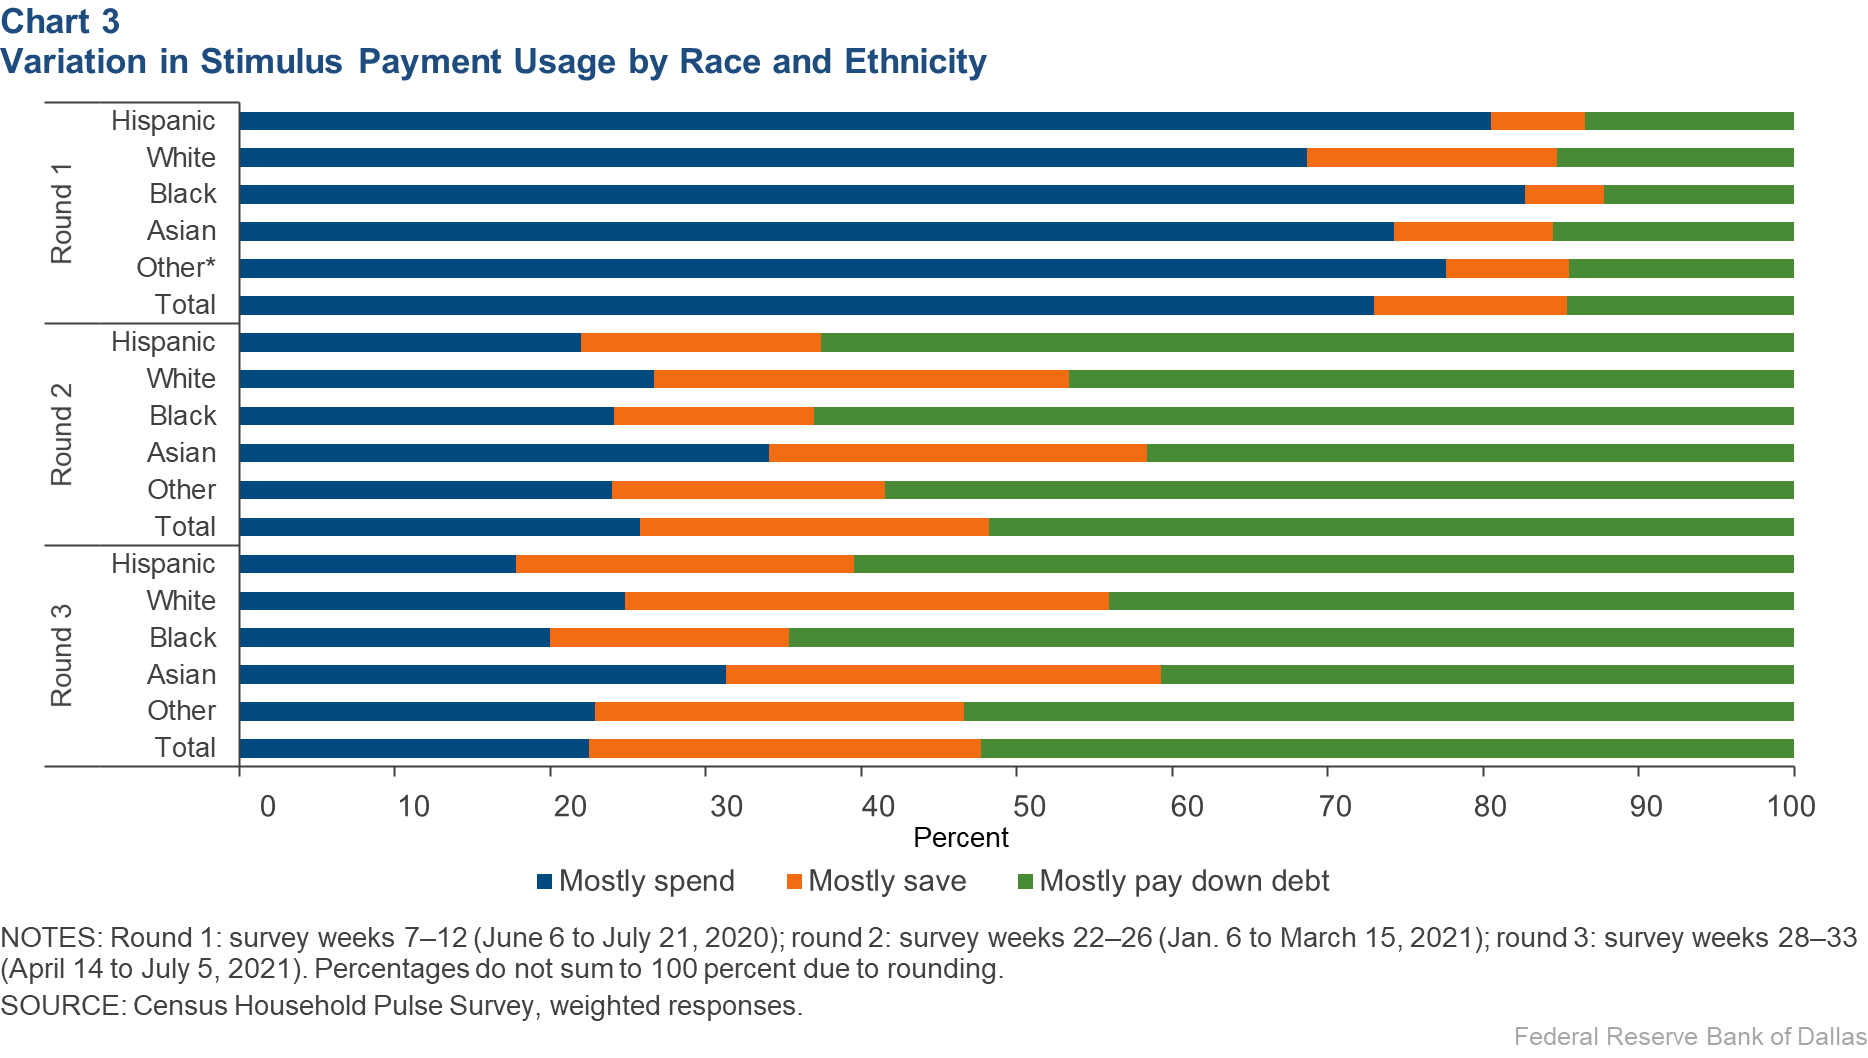
More white recipients than Black or Hispanic recipients mainly saved their second- and third-round stimulus payments. Instead, more Black and Hispanic recipients reported using the second- and third-round payments to pay down accumulated debt, consistent with evidence that COVID-19 more negatively affected the economic well-being of Black and Hispanic households than white households.
Stimulus payments supported minority and low-income groups
Did stimulus payments go to—and were they used by—those who needed them the most? The evidence suggests that this was the case. Minority and low-income groups that were hit hardest by the pandemic mainly used the stimulus payments for necessities and to pay down accumulated debt. However, second- and third-round stimulus payments to other groups could have been better targeted.
About the Authors

Jonah Danziger
Danziger is a research analyst in the Research Department at the Federal Reserve Bank of Dallas.

Anthony Murphy
Murphy is a senior economic policy advisor in the Research Department at the Federal Reserve Bank of Dallas.
The views expressed are those of the authors and should not be attributed to the Federal Reserve Bank of Dallas or the Federal Reserve System.


