Electric vehicles gain ground but still face price, range, charging constraints
Electric vehicles (EVs), though they can drive further than ever on a single charge, have yet to overcome performance gaps relative to internal combustion engines in terms of range, upfront cost and “refueling” convenience.
The competitiveness of EVs in terms of such factors influences their ability to gain market share—they made up about 2 percent of U.S. light-vehicle sales in 2019—and provides insight into the pace at which a large part of the transportation sector could transition from fossil fuels.
EV range rising over time
Consumers want to know if EVs can travel the distance they require for trips to work, school and leisure activities. To quantify this ability, we group vehicles into three categories—gasoline, Tesla and non-Tesla EVs—and use Environmental Protection Agency (EPA) vehicle-range test estimates. The EV categories exclude hybrid vehicles. Tesla is considered separately because it historically has had greater range than other EVs, though this difference has narrowed in recent years as other automakers introduced new models.
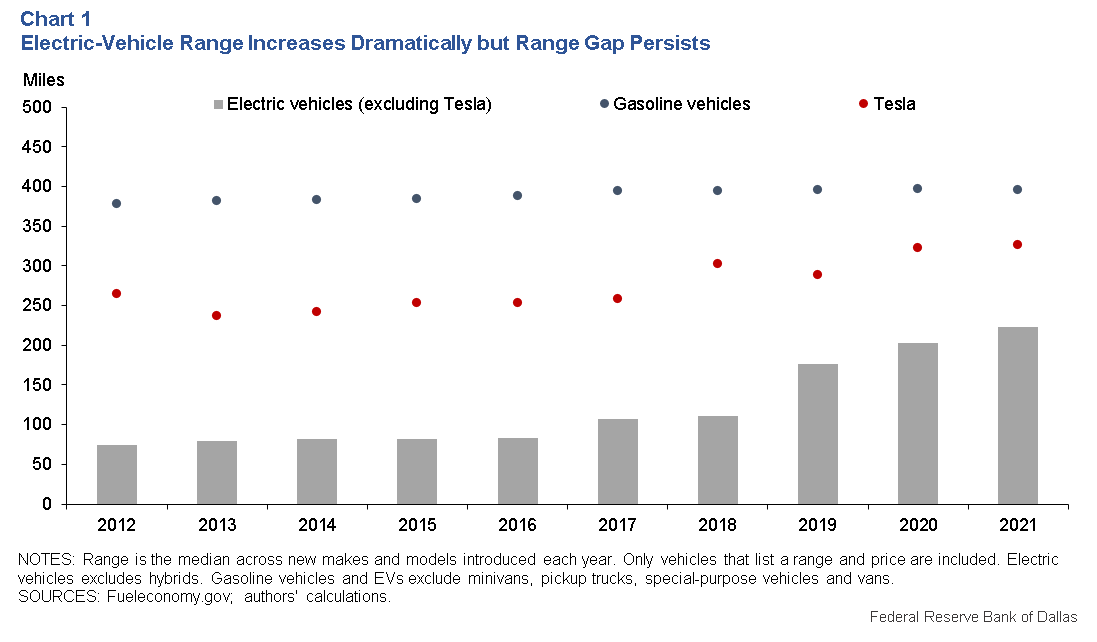
Over the past decade, the range gap between EVs and gasoline-powered vehicles has lessened due to improved batteries and the introduction of new makes and models of EVs (Chart 1). The median range of non-Tesla EVs was only about 75 miles in 2012 but rose to almost 225 miles—a 200 percent increase—by 2021, while the Tesla median range increased from 265 miles to 326 miles during the period. Meanwhile, the typical gasoline vehicle still goes further on a tank of gasoline, about 395 miles.

EPA testing is done in a controlled environment using a fully charged battery run to empty. Studies have shown an EV’s actual range depends upon numerous factors, such as ambient temperature and average speed. Also, in real-world settings, batteries are often only charged to 80 or 90 percent. The EPA makes a downward adjustment to its initial range estimates to account for these factors. Third-party testing often finds the EPA range is an upper limit.
With a range of more than 200 miles, the typical EV should now be able to meet the daily needs of most U.S. households. It would still, however, struggle with longer drives that the typical gasoline vehicle can easily complete.
EVs become more cost-effective, remain relatively expensive
Price is a bottom-line metric affecting consumer demand. However, a comparison of the manufacturer’s suggested retail prices (MSRPs) between models, while intuitive, could be misleading because of differing vehicle capabilities.
We instead divide a vehicle’s MSRP by its range to derive the vehicle’s retail cost per mile of range. A high number suggests a vehicle is relatively expensive based on the distance it can travel. This is a rough comparison, as it ignores other features associated with the price of a car, including some that consumers may value more than retail cost and range.
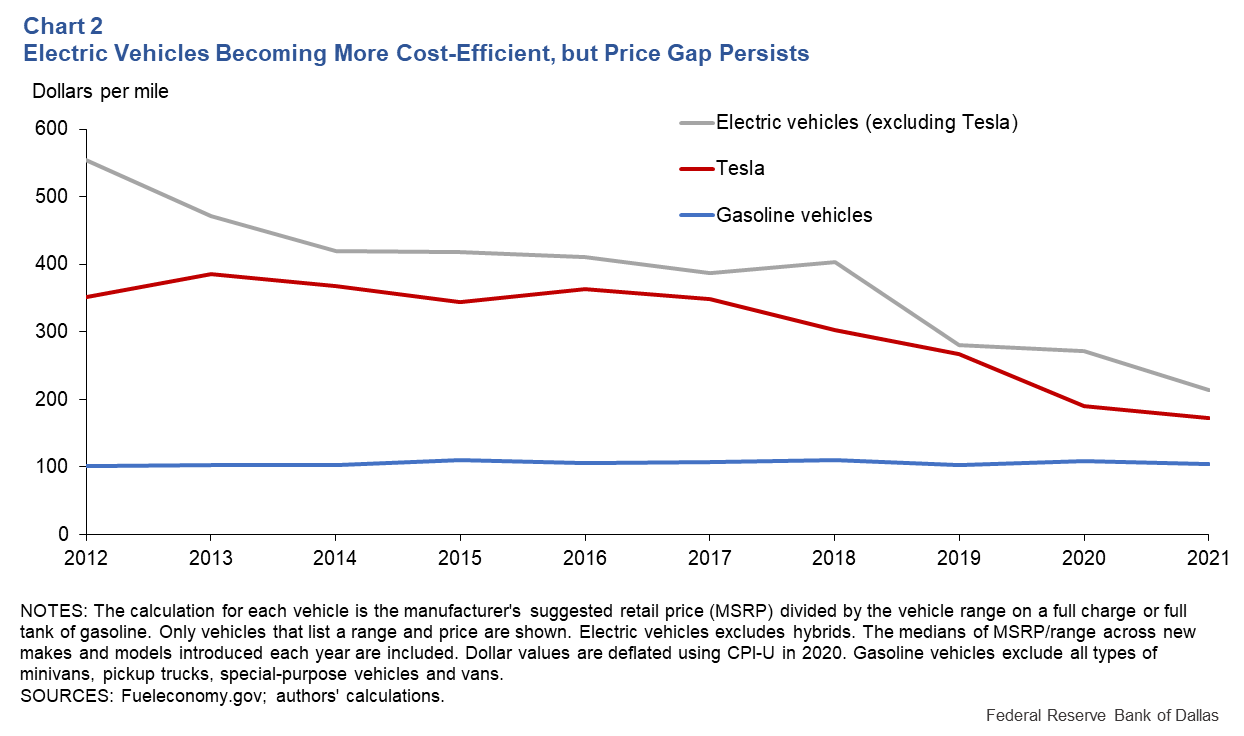
Tesla and other EV brands have become less expensive per mile of range over the past decade but trail gasoline-powered vehicles (Chart 2). In inflation-adjusted terms, the median EV costs $554 per mile of range in 2012 compared with $214 in 2021, a 61 percent change. Tesla reached $173 per mile in 2021, down from $352 in 2012. Still, even the EV with the lowest MSRP/range in 2021—at $133 per mile—exceeded the gas-powered median of $104 per mile.

Our calculation also ignores federal and state subsidies for purchasing EVs because of the difficulty of a direct comparison. State incentives, for example, vary greatly, while the federal tax credit of $7,500 per car is not available for all automakers and cannot exceed a taxpayer’s actual tax liability (i.e., tax bill). The price an individual consumer pays could vary significantly.
Charging time and infrastructure are considerations
Just like a gas-powered car, EVs must be "refilled," and this is done by recharging the battery. Key considerations are: How long does it take to charge, where is the charging done, and what are the costs?
Unlike traditional cars, the time it takes to refill an EV can vary widely, depending upon the size of the battery, how “empty” it is and, crucially, the type of charger used. Chargers are divided into level 1, level 2 and direct current (DC) chargers—level 1 is the slowest, DC the fastest.Level 1 chargers provide about 4 miles of range per hour while level 2 chargers can typically charge 10 to 20 miles of range per hour. By comparison, DC chargers can, in the best case, recharge even the largest battery in about a half-hour, where recharge is usually defined as going from 20 percent to 80 percent full.
For those whose commute is not too far, level 1 and level 2 chargers are sufficient as long as recharging can occur overnight at home or during the day at work. However, those driving long distances or those who are impatient will seek DC fast chargers. Some inconvenience remains even in this case, as DC chargers still take longer than filling a gas tank.
The adoption of EVs often assumes widespread availability of at-home charging, which mitigates the inconvenience of charging elsewhere. While homeowners can install level 1 and level 2 chargers, many who live in apartment complexes and condos lack access to such chargers and cannot install them at their own discretion.
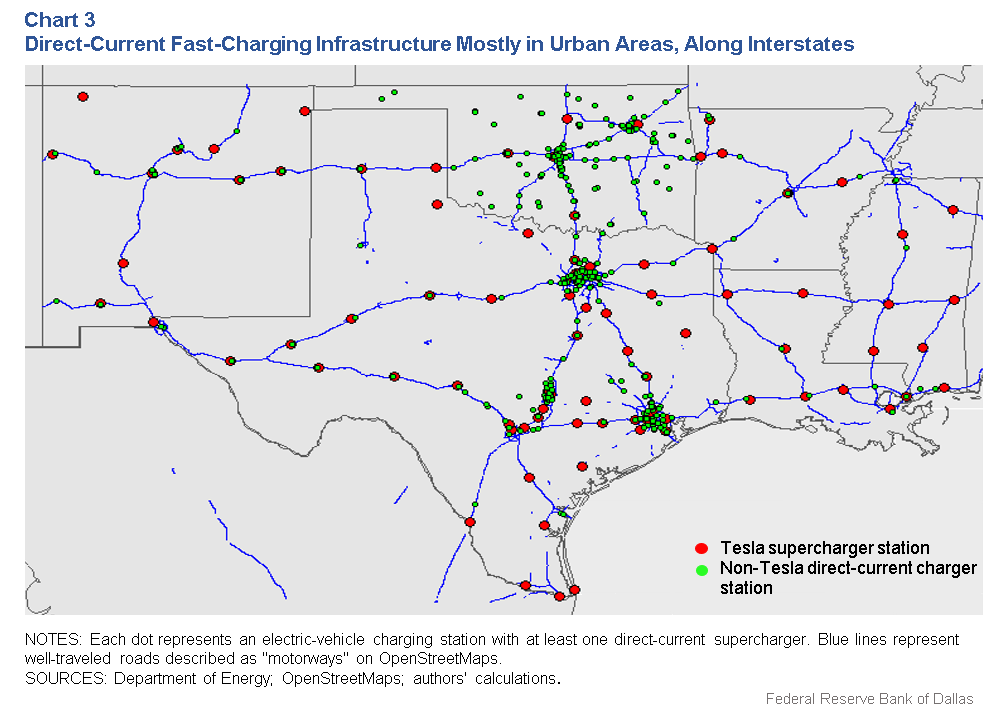
A similar infrastructure gap occurs when considering those who must charge away from home or work, particularly in rural areas, where there often exists limited availability of level 2 or DC chargers. Commercial charging stations are concentrated in urban areas and, to a lesser extent, along major throughfares, such as interstates, as is evident in Texas and most neighboring states (Chart 3). Areas away from main throughfares largely lack access to fast-charging infrastructure.

Oklahoma offers an exception, likely due to a 2019 grant program that helped expand EV infrastructure to 4.1 fast-charging stations per 100,000 people—third-most in the country, surpassing California (fourth) but trailing Vermont (first) and Oregon (second).
There are also costs associated with charging. These can vary significantly, complicating a direct comparison with gasoline vehicles. Residential electricity prices vary widely across the U.S. but tend to be much lower than the rates charged at commercial charging stations. Analysis also shows that charging at home is usually less expensive than filling a gas tank given what households pay for electricity relative to gasoline.
Though not applicable to everyone, there is also the potential upfront cost of installing a charger, as well the value of the extra time spent charging versus filling a gas tank. Finally, while EV owners avoid paying taxes on motor fuels, many states have begun imposing additional registration fees on EVs to cover those otherwise-lost revenues.
Further improvements needed
EVs make up a small but growing share of U.S. auto sales. Despite significant advances over the past decade, gaps remain in terms of range, cost and the convenience of charging. Further improvement seems necessary before a wholesale switch to EVs occurs in the U.S. Consumers will have a wider range of options in the future, though, as many traditional automakers expand their lineups of EVs to make their products more appealing to a broader audience.
About the Authors
The views expressed are those of the authors and should not be attributed to the Federal Reserve Bank of Dallas or the Federal Reserve System.


