Real-time market monitoring finds signs of brewing U.S. housing bubble
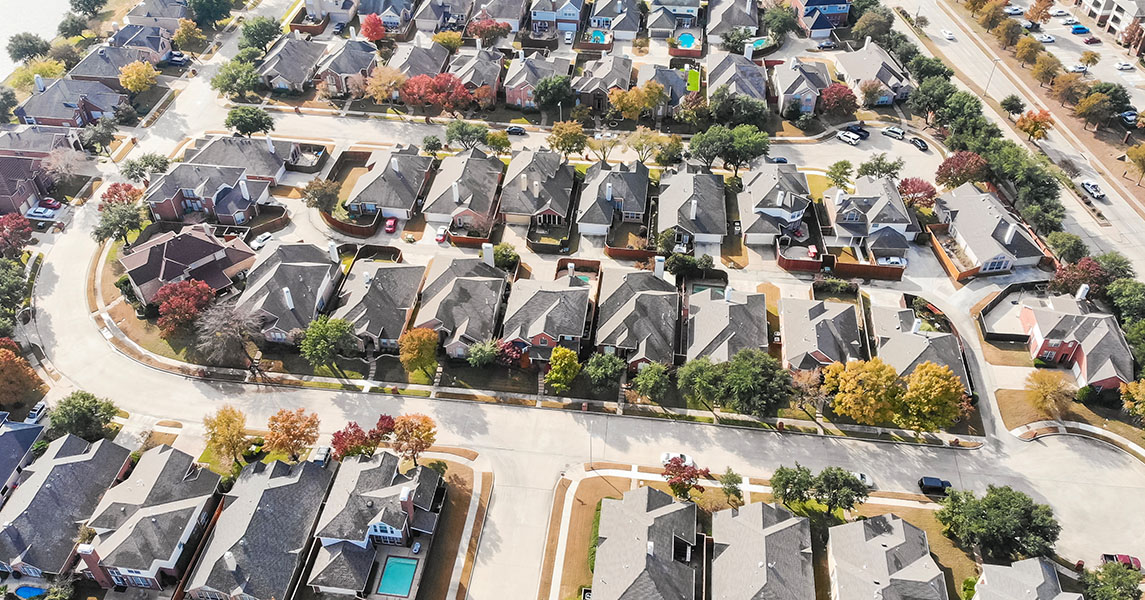
Real house prices—prices adjusted for inflation—have steadily increased in the U.S. since 2012. Further acceleration in the pace of house-price appreciation began before the pandemic but has strengthened noticeably since early 2020.
For prospective buyers and sellers as well as policymakers, knowing the state of housing markets is imperative. Using a novel statistical toolkit for assessing the health of the U.S. housing market in real time, we argue that the underlying causes of the run-up differ from those during the last housing boom, which preceded the 2007–09 Global Financial Crisis. However, there is growing concern that U.S. house prices are again becoming unhinged from fundamentals.
Monitoring emergence of housing bubbles in real time
An asset—in this case, housing—is in the primary expansionary phase of a bubble when price rises are out of step with market fundamentals. Rapid real house-price appreciation, such as that observed now, does not in itself signal a bubble. Shifts in disposable income, the cost of credit and access to it, supply disruptions, and rising labor and raw construction materials costs are among the economic reasons for sustained real house-price gains.
But real house prices can diverge from market fundamentals when there is widespread belief that today’s robust price increases will continue. If many buyers share this belief, purchases arising from a “fear of missing out” can drive up prices and heighten expectations of strong house-price gains.
This self-fulfilling mechanism leads to price growth that may become exponential (or explosive), resulting in the housing market becoming progressively misaligned from fundamentals until investors become cautious, policymakers intervene, the flow of money into housing dries up and a housing correction or even a bust occurs.
Expectations-driven explosive appreciation (often called exuberance) in real house prices has many consequences, including the misallocation of economic resources, distorted investment patterns, individual bankruptcies and broad macroeconomic effects on growth and employment. Monitoring the housing market in real time for the emergence of such booms in prices can help investors and policymakers respond before misalignments become so severe that subsequent corrections produce economic upheaval.
Time series of real house prices that contain episodes of expectations-driven bubbles display two important properties—they are nonlinear when graphed because they are explosive during their boom (or exuberant) phase, and they result in a correction or even a collapse if the market crashes.
To provide market diagnostics, the Dallas Fed’s International House Price Database team, in partnership with a network of scholars from around the world collaborating under the International Housing Observatory, produces datasets and statistics that characterize potential market exuberance. The methodology uses novel statistical methods to continuously monitor housing markets—in the U.S. and around the world—to detect symptoms and signal the presence of emerging housing booms.
Signs of a market tipping point
When the statistics derived from these techniques are significant, the periods are date-stamped to signify exuberance—prices growing at an exponential rate exceeding what economic fundamentals would justify. The indicators are computed quarterly. A test outcome above a 95 percent threshold signifies 95 percent confidence of abnormal explosive behavior, or housing market fever.
The history of the U.S. exuberance indicator is shown against the 95 percent threshold in Chart 1. The statistic plotted in the bottom panel delivers a market temperature reading, like that from a personal thermometer. The exuberance indicator shows the temperature, and the confidence upper bound is the abnormality threshold. The current reading indicates that the U.S. housing market has been showing signs of exuberance for more than five consecutive quarters through third quarter 2021.
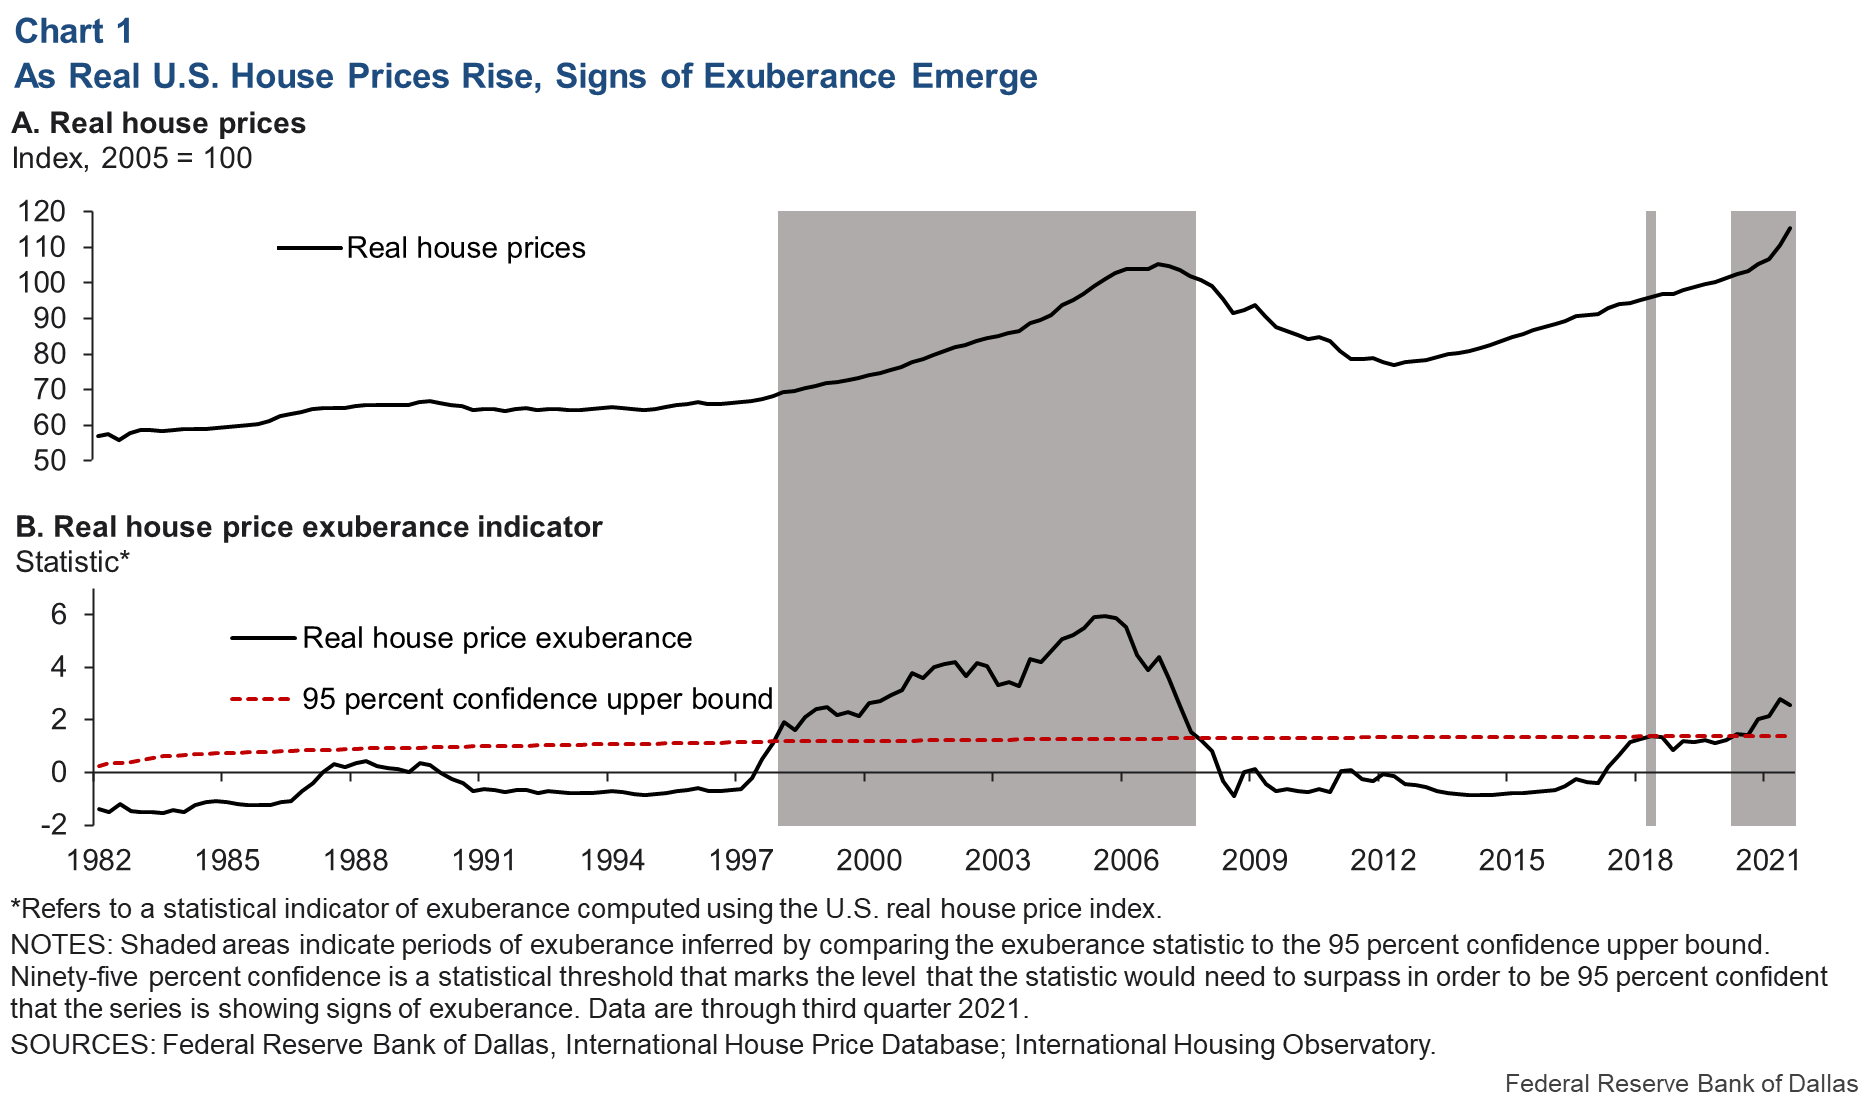
The U.S. is not alone in experiencing housing market fever. Fourteen of the 25 countries in the Dallas Fed’s International House Price Database show signs of real house-price exuberance.
A diagnostic approach to U.S. housing markets
To assess U.S. house prices during the pandemic, we first develop an empirical relationship between house prices and those economic fundamentals underpinning the market, based on data through fourth quarter 2019. The theoretical benchmark is the fundamental value of housing based on the sum of discounted future rents. This is similar to the finance tenet that the fundamental value of a company’s stock is the flow of future dividends discounted by the cost of capital. (Analogously, the company here is a house, and its dividends are rents that are discounted by interest rates.)
Working from that benchmark, the house-price-to-rent ratio is explained by a small set of lagged economic variables, such as personal disposable income per capita, housing rents and long-term interest rates. The residual of the regression, after removing the effects of fundamentals, is assessed for any remaining evidence of explosive behavior. The upshot: Since the beginning of 2020, the price-to-rent ratio has soared beyond what observed fundamentals alone can explain (Chart 2).
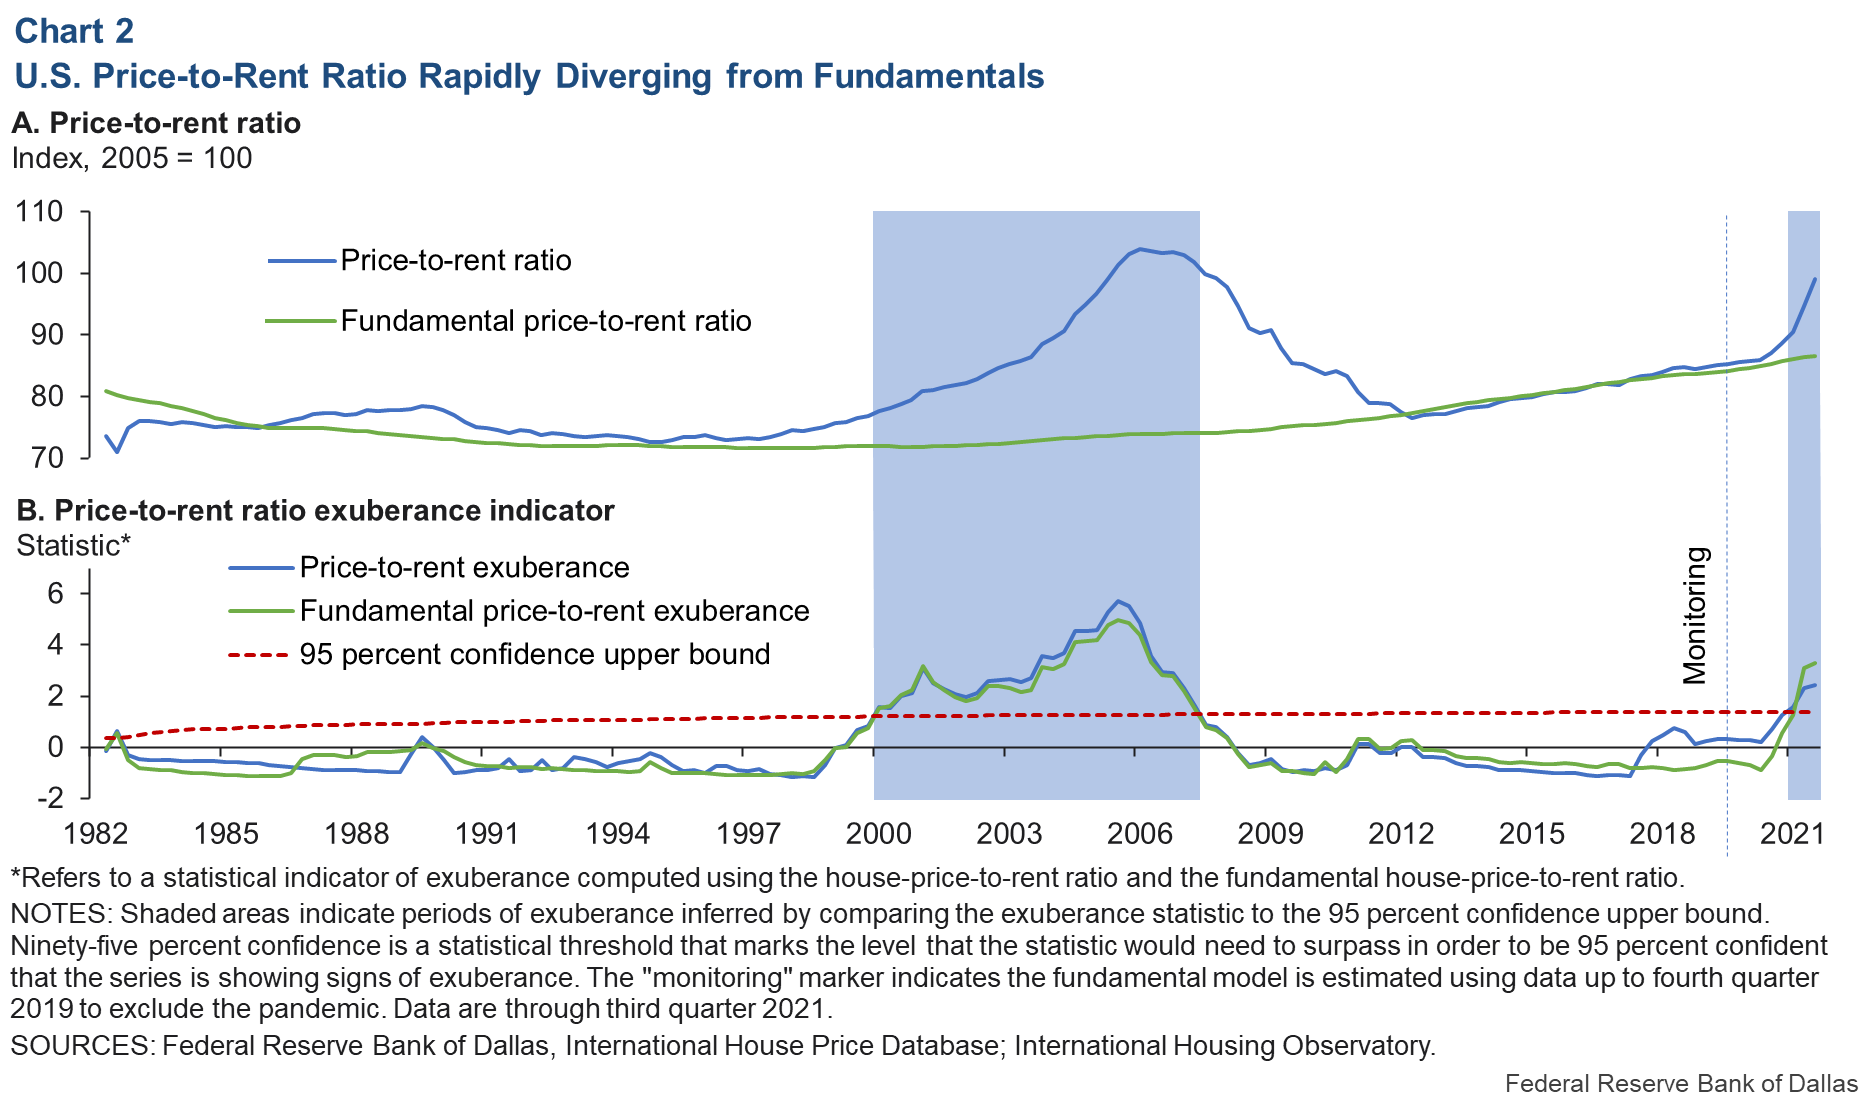
The gap between the actual price-to-rent ratio and its fundamental-based level in the U.S. has grown rapidly during the pandemic—comparable to the run-up of the last housing boom—and started showing signs of exuberance in 2021. The exuberance statistic confirms that recent increases are far from ordinary.
Another important long-run anchor—tied directly to housing affordability—is the ratio of house prices to disposable income. Chart 3 shows dates of episodes of exuberance for this measure of housing affordability. These data—unlike our previous metrics—do not yet display evidence of explosiveness in the third quarter of 2021. But the rapid increase in the statistic close to the threshold during 2021 indicates that U.S. real house prices may soon become untethered from personal disposable income per capita.
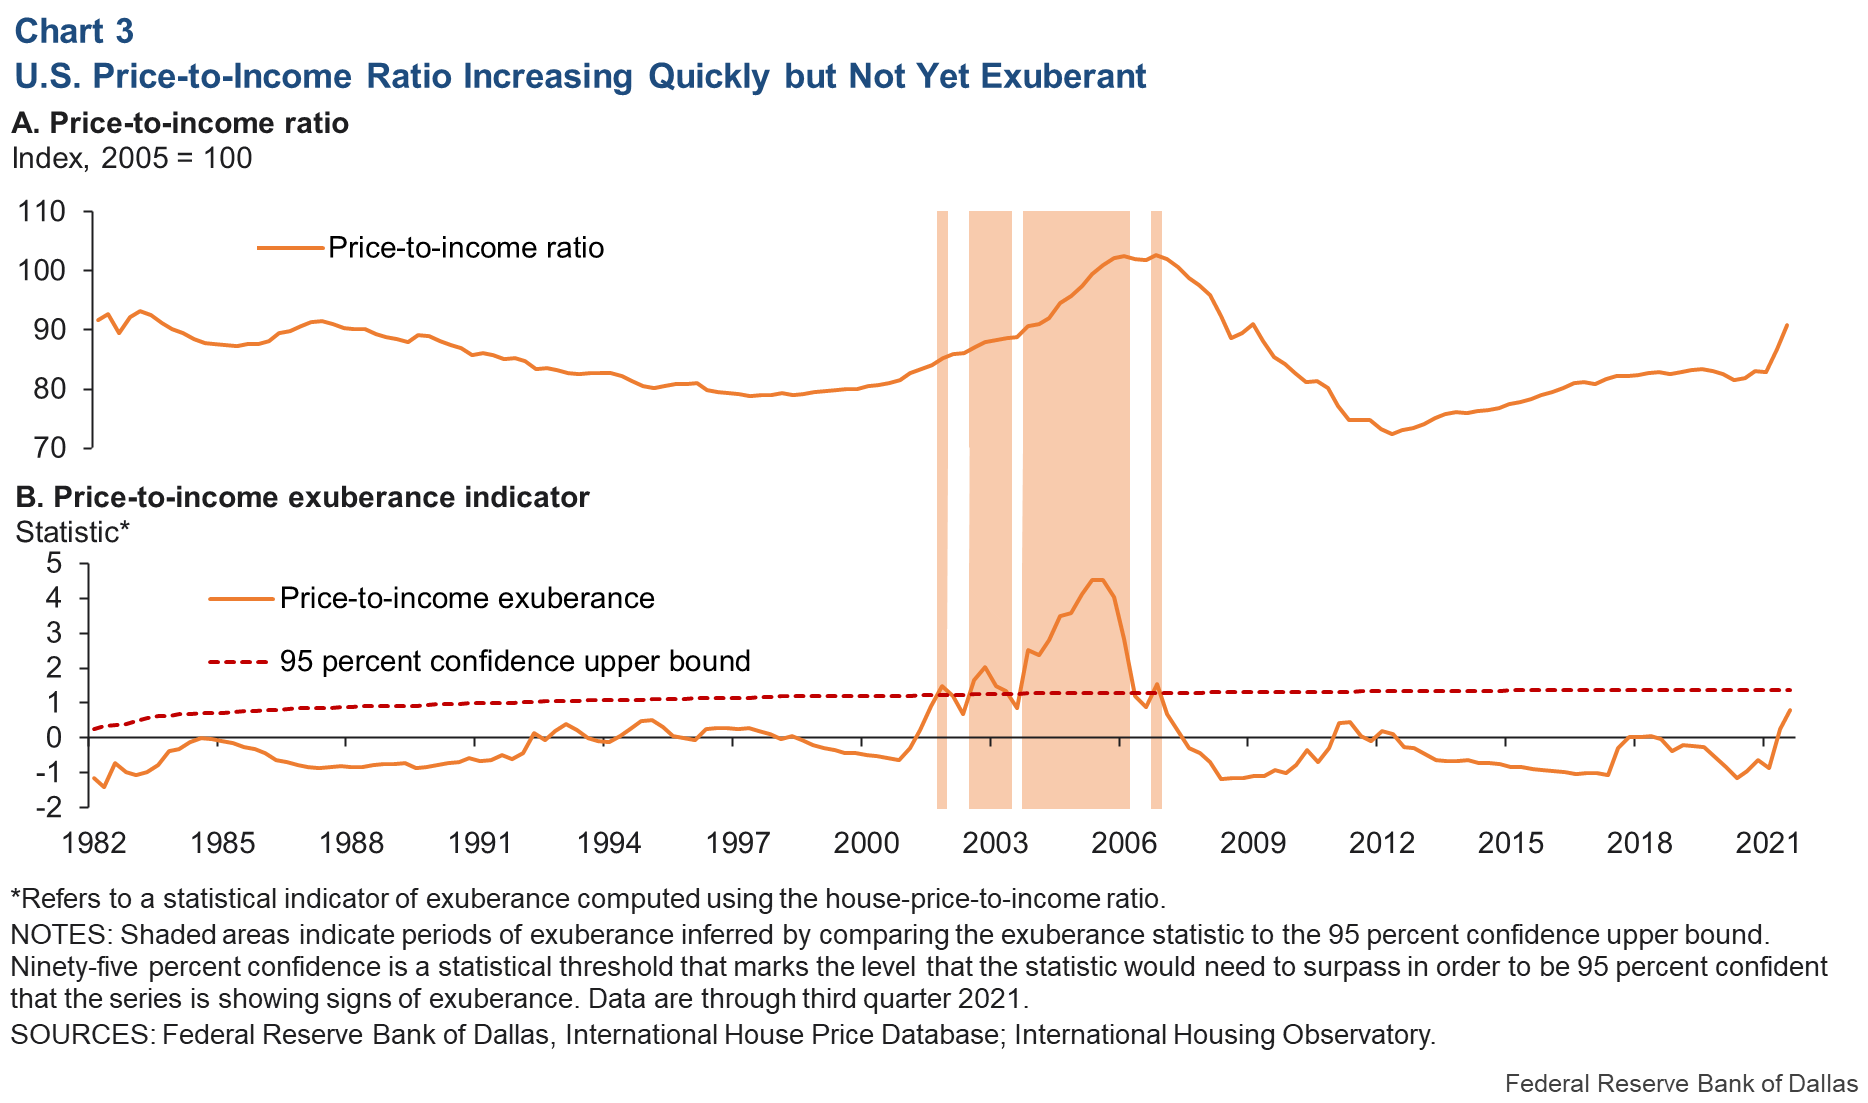
The delay in elevation of this exuberance statistic is partly the consequence of a surge in real disposable income during the pandemic that led to slower growth rates in the price-to-income ratio. The surge in disposable income is mostly associated with pandemic-related fiscal and monetary stimulus efforts and reduced household consumption arising from mobility restrictions and lockdowns.
If disposable income increases turn out to be transitory—as fiscal stimulus wanes and the Federal Reserve reverses its accommodative monetary policy—recent patterns in the price-to-income ratio may prove a less-useful measure of housing affordability. Such transitory increases in disposable income are not strong determinants of long-term housing investment. Thus, the price-to-income ratio measure alone may produce overly conservative results when identifying housing market bubbles.
Another U.S. housing bubble brewing?
Our evidence points to abnormal U.S. housing market behavior for the first time since the boom of the early 2000s. Reasons for concern are clear in certain economic indicators—the price-to-rent ratio, in particular, and the price-to-income ratio—which show signs that 2021 house prices appear increasingly out of step with fundamentals.
While historically low interest rates are a factor, they do not fully explain housing market developments. Other drivers have played a role, including pandemic-related U.S. fiscal stimulus programs and COVID-19-related supply-chain disruptions and associated policy responses. The resulting fundamental-driven higher house prices may have fueled a fear-of-missing-out wave of exuberance involving new investors and more aggressive speculation among existing investors.
Based on present evidence, there is no expectation that fallout from a housing correction would be comparable to the 2007–09 Global Financial Crisis in terms of magnitude or macroeconomic gravity. Among other things, household balance sheets appear in better shape, and excessive borrowing doesn’t appear to be fueling the housing market boom.
Importantly, experience from the housing bubble in the early 2000s and the subsequent development of advanced tools for early detection and deployment of warning indicators—some illustrated in this analysis—mean that market participants, banks, policymakers and regulators are all better equipped to assess in real time the significance of a housing boom. Thus, they are in a more-informed position to react quickly and avoid the most severe, negative consequences of a housing correction.
About the Authors

Jarod Coulter
Coulter is a research analyst in the Research Department at the Federal Reserve Bank of Dallas.

Valerie Grossman
Grossman is a researcher and the web content manager in the Research Department at the Federal Reserve Bank of Dallas.

Martínez García is a senior research economist and advisor in the Research Department at the Federal Reserve Bank of Dallas.

Peter C.B. Phillips
Phillips is Sterling Professor Emeritus at Yale University and a distinguished professor at the University of Auckland.

Shuping Shi
Shi is a professor of economics at Macquarie University in Sydney, Australia.
The views expressed are those of the authors and should not be attributed to the Federal Reserve Bank of Dallas or the Federal Reserve System.