
U.S. economy less vulnerable to geopolitical oil price shocks than in the past
The 2026 Iran war has raised the question of how exposed the U.S. economy is to geopolitical oil supply disruptions. It is widely believed that the U.S. economy has become less vulnerable to such disruptions, as it has reduced its dependence on oil and changed from a major net oil importer to a net oil exporter.
Recent Federal Reserve Bank of Dallas research shows that the response of U.S. real (inflation-adjusted) GDP growth to this shock is only one-twentieth of what it would have been in 1980. Moreover, the response of U.S. real GDP growth today is only one-sixth of the decline in the rest of the world.
Reasons for concern about the 2026 oil supply disruption
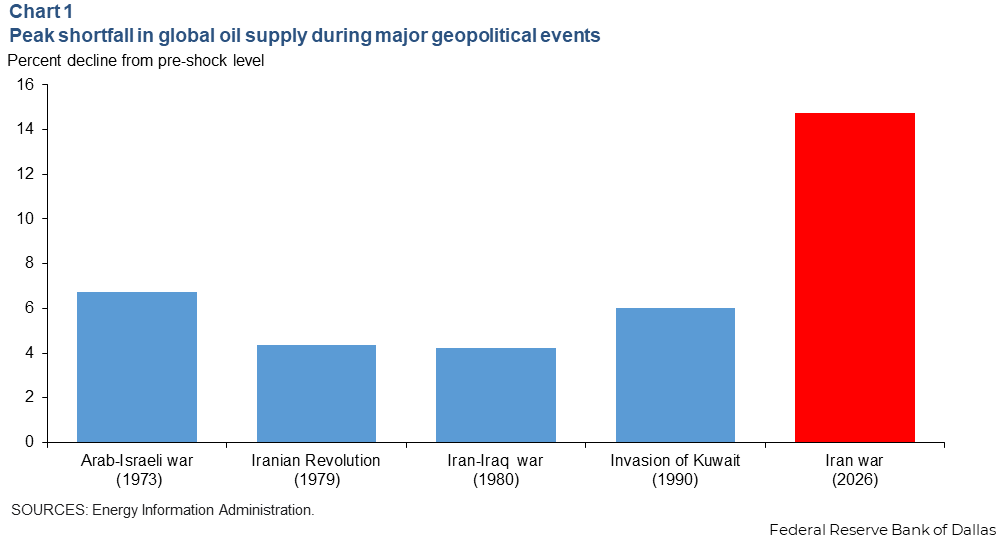
The closure of the Strait of Hormuz in 2026 demonstrated beyond a reasonable doubt that major geopolitical oil supply disruptions are by no means limited to history books. In fact, the 2026 disruption of global oil supplies has been more than twice as large as the peak disruption during the 1973 oil crisis, the largest oil supply shortfall on record before 2026 (Chart 1).
Thus, it is natural to expect the Iran war to cause a major reduction in global and U.S. GDP growth. After all, the prices of crude oil and refined products such as jet fuel, diesel fuel and gasoline are determined in global markets, so disruptions elsewhere in the world are inevitably reflected in U.S. fuel prices.
Reasons why this time may be different
There are also reasons to expect the U.S. economy to be less exposed to such events today than in the 1970s and 1980s. For example, Federal Reserve Vice Chair Philip N. Jefferson stressed in March 2026 that “when economists discuss oil price shocks in the U.S., the example is often the events of the 1970s. While informative, it is important to understand that the U.S. is in a very different position relative to a half-century ago.” The view that the U.S. is far better positioned to absorb this shock than in past cycles is shared by many market observers.
It has been widely noted that the shale oil revolution has allowed the U.S. to greatly reduce its dependence on imports of crude oil and refined products. Whereas the U.S. economy had been a major net importer of oil and oil products since the 1970s, the U.S. became a net exporter in late 2019, if only by a small margin (Chart 2, panel A).
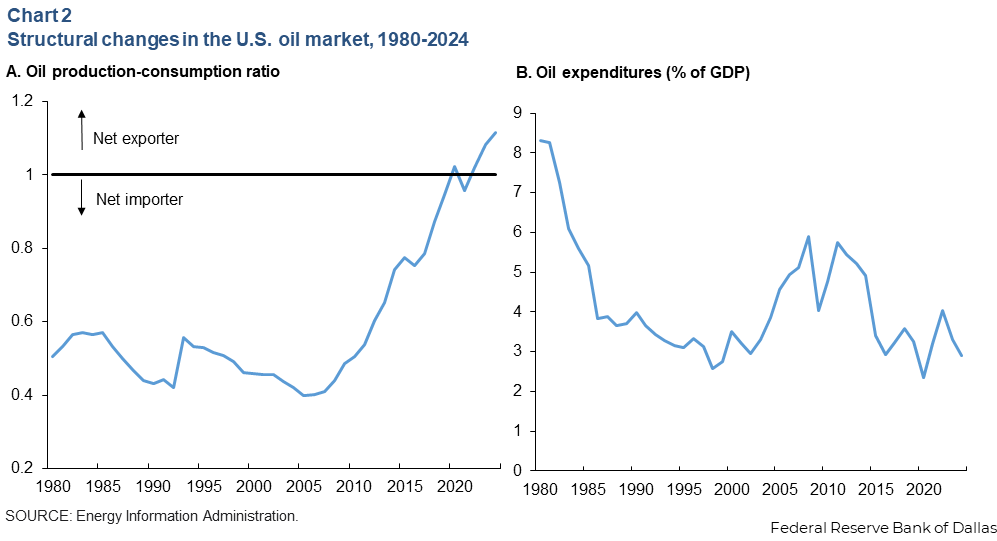
In addition, oil and oil product expenditures as a share of GDP substantially declined from a high near 8 percent in 1980 to 3 percent in 2024 (Chart 2, panel B).
U.S. response today compared with 1980
Assessing the impact of the shortfall in global oil supplies caused by the closure of the Strait of Hormuz is complicated by the unprecedented magnitude of this oil supply disruption.
We address this question based on a two-country model of the global economy with large geopolitical oil supply disruptions that distinguishes between the U.S. economy and the rest of the world. This allows us to quantify how structural changes in the dependence of the U.S. economy on oil and its ability to generate oil export revenues have affected the resilience of the U.S. economy to such shocks.
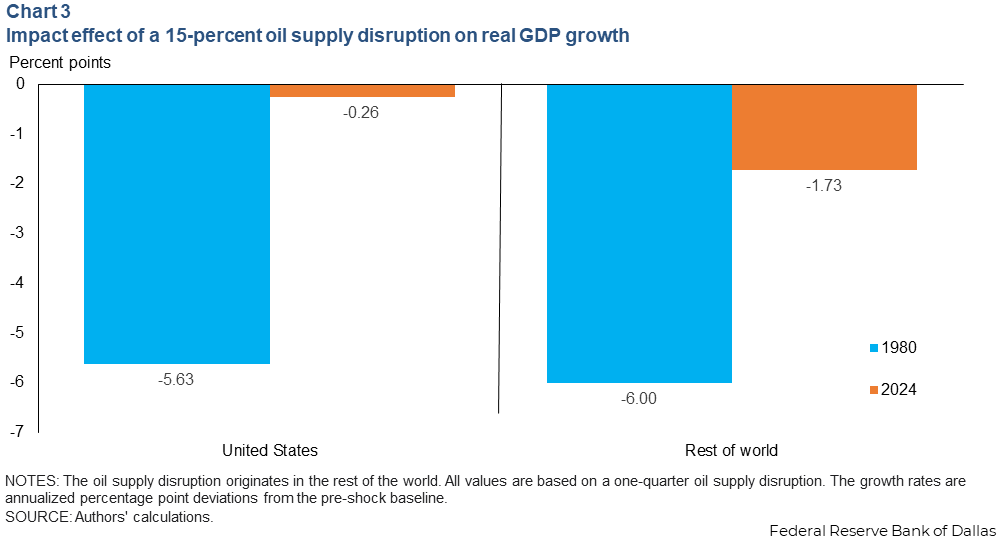
For this purpose, we evaluate our model first under a parameter setting that matches the data for 1980 and then under a setting that matches the data for 2024, the most recent data currently available. A useful thought experiment is to compare the effects of a geopolitical disruption of 15 percent of global oil supplies today, as occurred after the outbreak of the 2026 Iran war, to the effects of the same disruption if it had occurred in 1980.
Whereas our model implies that such a disruption in 1980 would have caused annualized U.S. real GDP growth to decline by 5.6 percentage points, the same event today reduces growth by only 0.3 percentage points, one-twentieth of the 1980 decline (Chart 3). Thus, the U.S. has become substantially less exposed to major disruptions in global oil markets.
Our prediction of a 5.6 percentage point reduction in U.S. real GDP growth may appear large. Of course, the world never experienced a geopolitical supply disruption as large as 15 percent before 2026. For example, the disruption caused by the outbreak of the Iran-Iraq war in late 1980 only amounted to 4 percent of global oil supplies. Our model implies that the latter event reduced U.S. real GDP growth by about 1.5 percentage points at an annualized rate.
Why the U.S. economy’s resilience has increased
An important question is what determines the reduced sensitivity of U.S. GDP growth to geopolitical oil supply disruptions today compared with the past. While the oil trade balance and the dependence of the U.S. economy on oil are natural candidates, the relative importance of these structural changes is not well understood.
Chart 4 takes the model specification for 2024 as the baseline and shows how setting the oil expenditure share and the oil trade balance, one at a time, to their 1980 values affects the impact on U.S. and rest-of-the-world real GDP growth, conditional on a 15 percent oil supply disruption and a one-quarter closure of the Strait of Hormuz.
Setting the oil share to its 1980 value increases the decline in U.S. real GDP growth from 0.3 to 0.7 percentage points, while setting the oil trade balance to its 1980 value increases it to 1.3 percentage points. Individually, these changes leave a large unexplained gap relative to the 5.6 percentage point decline that would have been observed in the model for 1980.

There are important interaction effects, however. When both the oil expenditure share and the oil trade balance are set to their 1980 values, U.S. real GDP growth falls by 5.1 percentage points, nearly as large as the 5.6 percentage point decline observed in the model for 1980 and far larger than the sum of their individual contributions of 0.4 and 1.0 percentage points would suggest in the absence of interactions.
To understand these interaction effects, observe that real GDP is the sum of non-oil GDP and net oil income.
Starting from the 2024 specification, consider raising the U.S. oil expenditure share to its value in 1980. The higher oil expenditure share makes the U.S. economy more sensitive to changes in the oil price, which causes a larger reduction in non-oil real GDP in response to the oil supply disruption.
When the U.S. is a net oil exporter—as was the case in 2024—the higher expenditure share also generates higher net oil income, partially offsetting the decline in non-oil real GDP. As a result, the overall effect on the impact response of U.S. real GDP growth is modest.
In contrast, when both the U.S. oil expenditure share and its oil trade balance are set to their 1980 values, the absence of a large increase in net oil income means that the overall decline in real GDP largely matches the decline in non-oil GDP. This interaction effect is large, given the magnitude of the structural changes in the oil market since 1980.
U.S. response today relative to the response of other economies
The structural changes documented in Chart 2 are also expected to make the U.S. economy less responsive to geopolitical oil supply disruptions than many net oil-importing countries. For example, Europe, Japan, South Korea and China heavily rely on imports of crude oil and refined products to sustain their growth.
This observation led U.S. Energy Secretary Chris Wright to argue that the U.S. is in a better place to deal with the current crisis than other countries. Similarly, then-Federal Reserve Chair Jerome Powell stressed that the U.S. is “an oil exporter, so we’re not feeling the same kind of pain … that economies in Western Europe and, certainly, in Asia are feeling.” How much more advantageous the U.S. position is has not been quantified.
Our analysis demonstrates that the contraction in the U.S. in response to a geopolitical oil supply disruption was similar to that in the rest of the world in 1980. This is no longer the case. A global oil supply disruption of 15 percent today causes a decline in annualized real GDP growth of 1.7 percentage points in the rest of the world, compared with only 0.3 percentage points in the U.S.—roughly one-sixth of the response in the rest of the world.
This finding not only matters for understanding the global transmission of the oil supply disruption caused by the Iran war, but also helps understand where the destruction of oil demand required to restore equilibrium in the global oil market will come from as oil inventories are drawn down.
About the authors

Lutz Kilian is a vice president in the Research Department and director of the Center for Energy and the Economy at the Federal Reserve Bank of Dallas.

Michael Plante is an assistant vice president in the Research Department at the Federal Reserve Bank of Dallas.

Alexander W. Richter is a vice president in the Research Department at the Federal Reserve Bank of Dallas.