
Is the U.S. ‘exorbitant privilege’ of favorable rates fading?
The United States has held what then-French Finance Minister Valéry Giscard d’Estaing called “exorbitant privilege.” In international financial markets, the dollar is a global reserve currency, widely accepted and conveying the privilege to borrow at a favorable rate.
The U.S. has a negative net foreign asset position—the value of foreign liabilities, accumulated over the years, exceeds that of foreign assets. Nonetheless, the U.S. has earned a positive net return on foreign investment, and the U.S. earns a higher rate of return on foreign assets compared with the rate of return it owes on liabilities to other countries.
This privilege has partially financed the U.S. trade deficit. In the decade before the pandemic, U.S. net income from foreign investments averaged 1.2 percent of GDP per year. However, it turned negative in 2024, for the first time since at least 1960, raising the question of whether the “privilege” will be sustained.
U.S. foreign receipts and payments
The U.S. current account measures U.S. net foreign income. It is a matter of accounting that this net foreign income is equal to U.S. total net savings, which is also equal to U.S. net capital outflows. When the U.S. incurs negative net income—sustaining a loss—the U.S. has negative net saving and must finance that negative saving by selling assets (usually Treasury bonds) to the rest of the world.
U.S. net foreign income comes from three sources:
- Net exports—proceeds from export sales minus payments for imports.
- Net primary income—dividends and coupon payments paid to U.S. residents from their foreign assets minus dividends and coupon payments paid to foreign residents from U.S. assets they hold.
- Net secondary income—unilateral transfers such as foreign aid and remittances foreigners paid to U.S. residents minus unilateral transfers U.S. residents paid to foreigners.
Primary income tends to receive much less attention than the trade side of the current account, but it can be sizable (Chart 1).
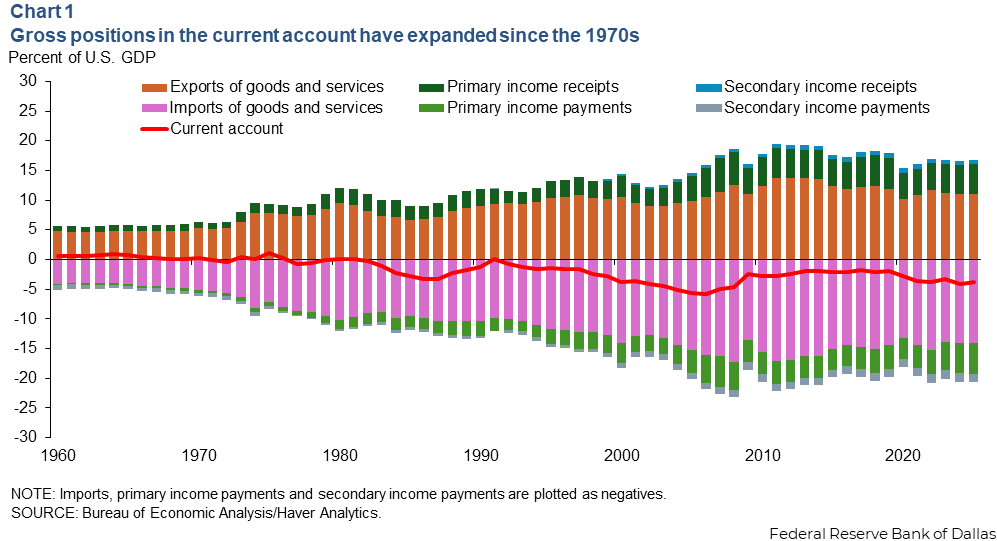
U.S. exports were about 11 percent of GDP In 2025, and imports were 14 percent of GDP. Primary income receipts and payments were each about 5 percent of GDP, and secondary income receipts totaled 0.7 percent of GDP while payments were about 1.4 percent of GDP.
When thinking about the U.S. current account, we usually just think about the trade balance. Before the 2008 Global Financial Crisis, U.S. net primary and secondary income usually balanced each other out, with positive net primary income and negative net secondary income. That left the trade balance as the factor determining the balance of the current account (Chart 2).
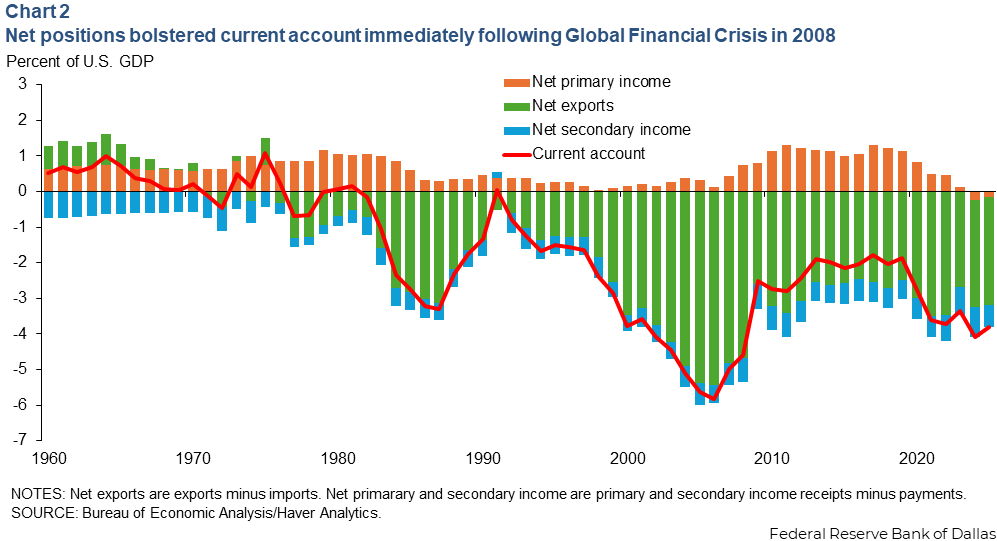
This changed after 2008 and before the pandemic. Between 2010 and 2019, U.S. net primary income averaged 1.2 percent of GDP while the U.S. trade deficit averaged 2.8 percent of GDP. Thus, net primary income from foreign investments financed around 40 percent of the U.S. trade deficit.
Things changed again following the pandemic. U.S. primary income decreased rapidly after peaking at 1.4 percent of GDP in 2018. In 2024, U.S. primary income turned negative for the first time since at least 1960. The U.S. trade deficit has averaged 3.2 percent of GDP since 2020, not much different from the average in the decade before the pandemic. U.S. net secondary income is largely unchanged.
What changed? Net primary income has averaged just 0.2 percent of GDP since the pandemic. Despite only a small change in the trade deficit, the U.S. current account deficit has increased and annual U.S. borrowing from the rest of the world is now close to 4 percent of GDP, the highest since 2008.
U.S foreign assets and liabilities
The positive net income the U.S. earned from foreign investments is a bit of a puzzle. The U.S. net foreign asset position—the value of foreign assets held by U.S. residents minus the value of U.S. assets held by foreign residents—has been negative since the 1980s.
An interesting aspect of the U.S. net foreign asset position since the early 1980s is the negative position in debt securities the U.S. had while maintaining a positive position in equity securities (Chart 3). This phenomenon led economists Pierre-Olivier Gourinchas and Hélène Rey to dub the U.S. the “world[’s] venture capitalist.”
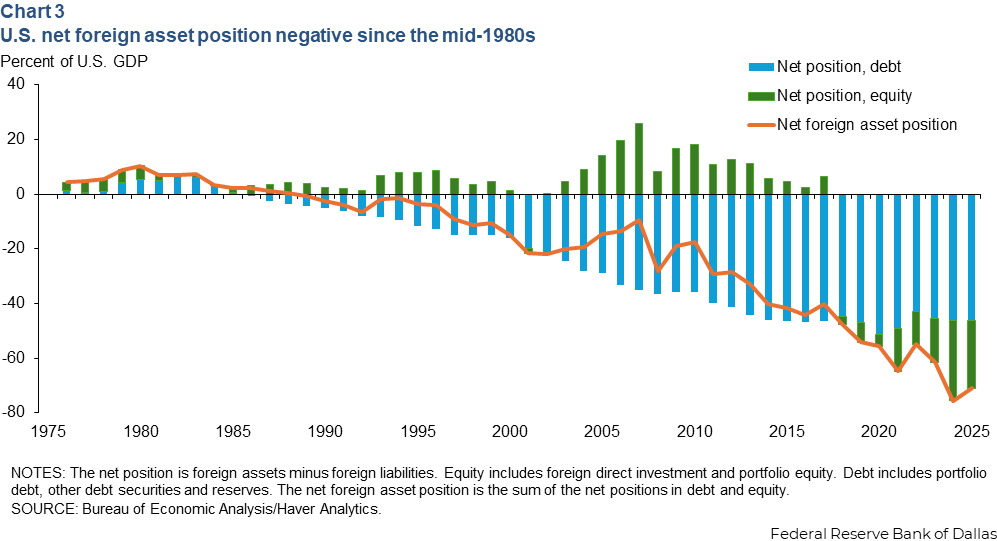
However, the net equity position has deteriorated since 2010. It turned negative in 2018, largely because of U.S. equity markets’ strong performance—simultaneously boosting the value of foreign U.S. equity holdings. The value of these foreign positions is a liability to the U.S.
Comparatively, the net position in debt securities has remained relatively stable as a share of GDP since 2010.
Despite being an international debtor, the U.S. earned a positive net primary income until 2024. Given the negative net asset position of the U.S., we would expect net primary income to also be negative.
However, net primary income is affected by more than simply the stock of assets and liabilities. The yields on those assets and liabilities also matter. For a country to have a more positive position in net primary income compared with its net position in assets, it must earn a higher yield on its external assets than it pays on its external debt. This is the case for the U.S.
Primary income yields can be decomposed into equity and debt, each split into assets and liabilities. This leaves four categories of yields.
The U.S. historically has had a positive position in equity assets. Yields are generally higher for equity relative to debt. Within the category of equity, the foreign equity held by U.S. residents has a higher yield than the U.S. equity held by foreign residents.
The yield on U.S. foreign equity assets has been fairly stable (at 5–6 percent) since 2010, while the yield on U.S. equity liabilities has also remained stable (2–3 percent) (Chart 4). Economists Stephanie Curcuru, Charles Thomas and Francis Warnock write that this is because the U.S. earns a higher yield on foreign direct investment than foreigners earn on direct investment in the United States.
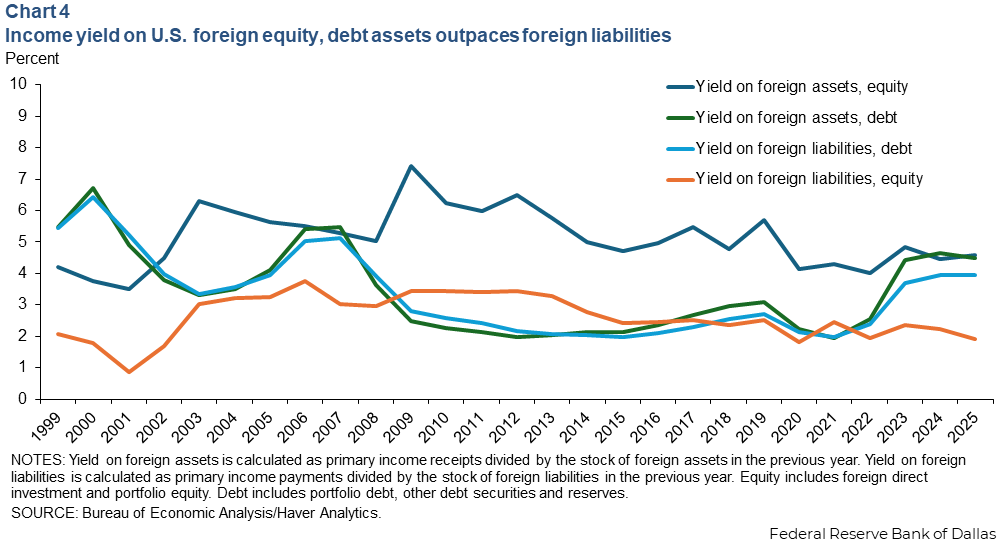
Furthermore, during 2010–21, yields on U.S. external debt assets and liabilities were around 2 percent. Since 2022, these yields increased rapidly, exceeding 4 percent. Notably, foreign equity owned by U.S. residents earns a much higher yield than U.S. equity held by foreigners. The relationship doesn’t hold for debt, where foreign and U.S. yields are nearly identical.
Where did the ‘exorbitant privilege’ go?
The combination of these yields and foreign asset and liability positions drive changes in U.S. net primary income. Chart 5 plots the three components of U.S. net primary income— net income from equity securities, net income from debt securities, and a very small component dealing with the net compensation of employees (typically, the salaries of foreign cross-border or seasonal workers).
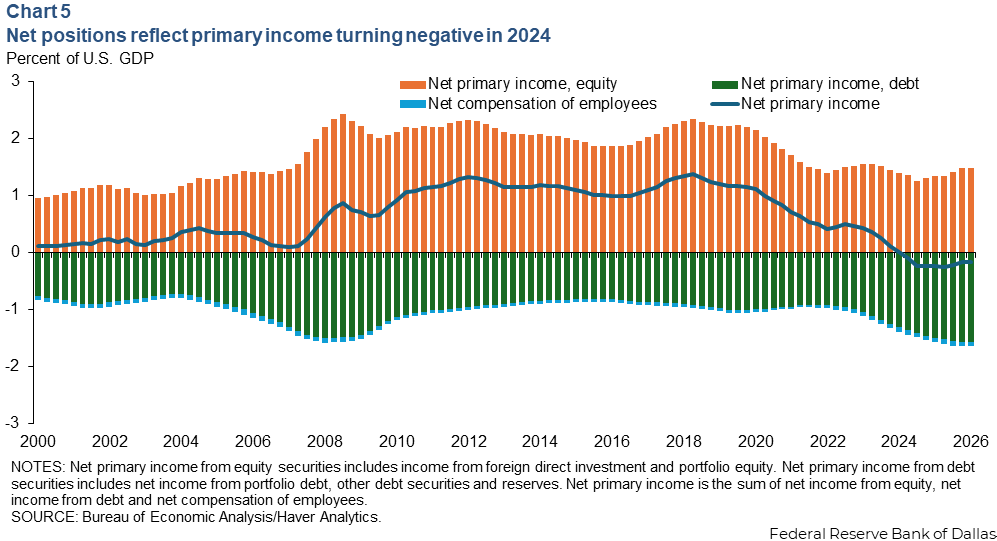
Importantly net income earned on equity assets has remained positive even though the net equity position has turned negative. This is because within the equity category, the U.S. earns a greater yield on its assets than it pays on its liabilities.
With the U.S. net primary income to GDP ratio falling by about 1.5 percentage points since peaking in 2018, about 0.9 percentage points of this decline is due to less primary income from equity assets, and about 0.6 percentage points reflects lower primary income from debt assets.
Equity yields have not changed much since 2018. However, there has been a sharp decrease in the net position in equity assets. As this net position falls, so will net primary income, putting the U.S.’s exorbitant privilege under pressure.
For net income from debt securities, the stock of U.S. external debt as a share of GDP has changed little since 2010. However, the yield on that debt has increased. The U.S. has a highly negative net position in debt. Higher interest rates mean that this negative net position in debt assets costs more to service, resulting in a greater drag on total net primary income.
How negative primary income affects U.S. borrowing
Recently, there has been a sharp increase in U.S. foreign borrowing. In the decade preceding the pandemic, the current account deficit averaged 2.2 percent of GDP. Since the pandemic it has averaged 3.7 percent of GDP. Notably, the trade deficit as a share of GDP has recently remained relatively steady and is not driving this change. The increase in the current account deficit can largely be attributed to the deterioration of net primary income.
The surplus in net primary income partially financed the trade deficit in the decade before the pandemic. This allowed the U.S. to run trade deficits without as much foreign borrowing. However, in the years since the pandemic, the role of net primary income has reversed. Instead, net primary income is increasing the current account deficit raising questions about whether the U.S. still maintains an exorbitant privilege.
About the authors

Scott Davis is an assistant vice president in the Research Department of the Federal Reserve Bank of Dallas.

Abigail MacLean is a research analyst in the Research Department at the Federal Reserve Bank of Dallas.