Blame higher U.S. equity prices for recent moves in U.S. external liabilities
The U.S. net foreign asset position—the value of foreign assets held by U.S. residents minus the value of U.S. assets held by foreign residents—has fallen sharply since the 2008 Global Financial Crisis.
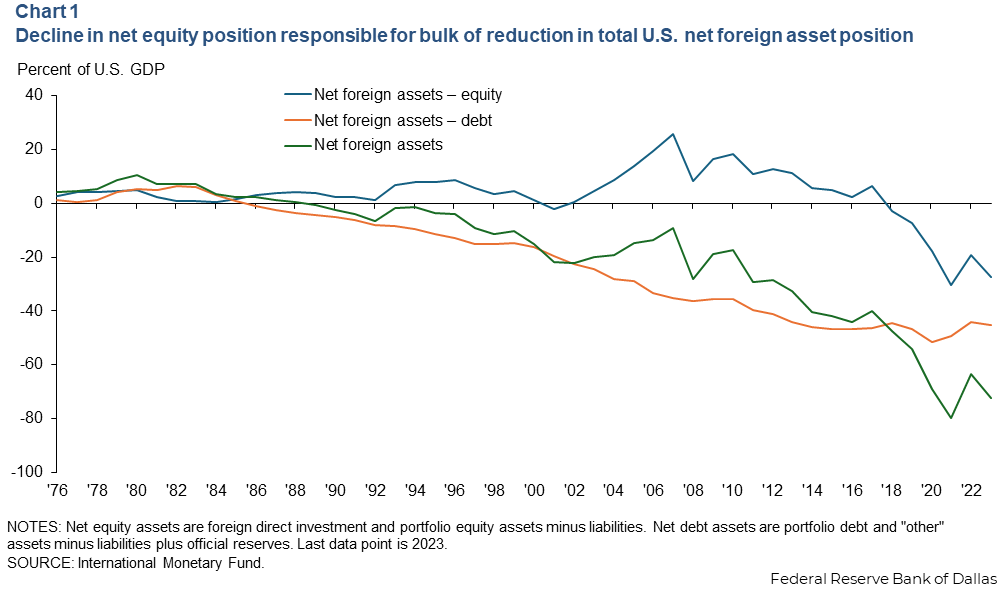
The net foreign asset position measures net external liabilities and is sometimes referred to as a measure of external wealth. A positive or negative net foreign asset position asks whether U.S. holdings of foreign assets exceed or are less than foreign holdings of U.S. assets. In 2007, the U.S. net foreign asset position was -9 percent of GDP. In 2023, the position had slid to -72 percent of GDP, indicating that the U.S. net external liabilities had grown sharply.
Changes in the U.S. external liabilities can be driven by new borrowing or by changes in the relative valuation of existing assets. A decomposition shows that the recent deterioration in the net foreign asset position is mainly due to changes in equity prices and their effect on the value of existing assets, not new borrowing.
What led to deterioration in the U.S. external position?
The international investment position can be separated into subcategories. We can look at the position in equity assets, foreign direct investment and portfolio equity. We can also examine debt assets, which are portfolio debt (bonds), “other” (mainly deposits and bank lending) and official reserve assets.
When the U.S. net foreign asset position is divided into these two broad categories, the 63-percentage-point fall in the total net foreign asset position since 2007 is due to a 53-percentage-point decline in the net position in equity assets (from +26 percent to -27 percent of GDP). A lesser contributor is a 10-percentage-point fall in the net position in debt assets (from -35 percent to -45 percent of GDP) (Chart 1).

Not only was the decline of the net equity position five times greater than the net position in debt securities, the net equity position changed signs. Pierre-Olivier Gourinchas and Hélène Rey wrote in 2007 how the U.S. had gone from being the world’s banker in the 1970s and early ’80s, with a positive net foreign asset position in both debt and equity assets. Instead, the U.S. became the world’s “venture capitalist,” with a negative position in debt assets and a positive position in equity assets.
This ability to borrow in low-yielding debt assets and lend in high-yielding equity assets was the basis of the U.S.’ so-called “exorbitant privilege.” Writing in 2022, Andrew Atkeson, Jonathan Heathcote and Fabrizio Perri examine the change in the U.S. net foreign equity position over the past 15 years and discuss “the end of the privilege.”
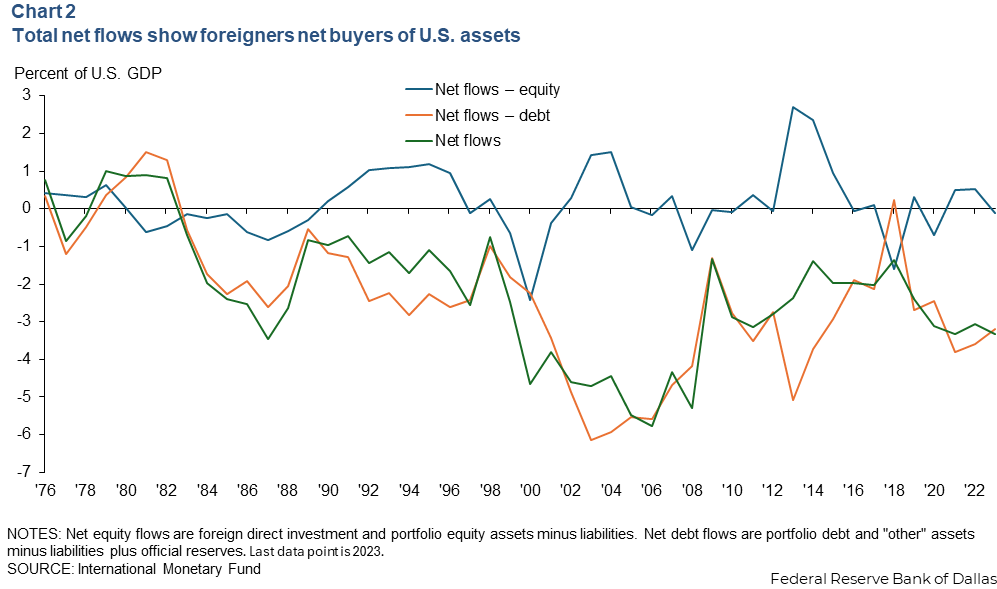
The net foreign asset position simply indicates the value of foreign assets at a given time. New asset purchases over a specified period are given by net capital flows. Chart 2 plots debt, equity and total U.S. net capital flows, where net flows are simply purchases of foreign assets by U.S. residents minus purchases of U.S. assets by foreign residents. Net capital flows are equal to net national saving. If the U.S. runs a negative net savings rate, it finances that deficit through the net sale of U.S. assets.

Notably, U.S. net capital flows were negative for most of the sample period. Foreigners have been net buyers of U.S. assets. Net capital flows were especially negative from 2000 to 2007, where net flows were around -6 percent of GDP. Since 2008, net flows have been a more manageable -3 percent of GDP.
Net equity flows fluctuate around zero. In some years, purchases of foreign equity by U.S. residents exceed foreign purchases of U.S. equity, and some years the opposite is true.
Net debt flows are very similar to total net flows. The U.S. has been borrowing from the rest of the world for most of this period. Such borrowing has occurred through the sale of debt assets to the rest of the world, not equity assets.
Decomposing net foreign asset position into flows, valuation effects
The change in the net foreign asset position from one period to the next can be written as new net foreign asset purchases during the period (net flows) plus the effect of price changes in the value of an existing group of assets (valuation effects).
Thus, the net foreign asset position can be summarized as the cumulative sum of past net flows plus the cumulative sum of past valuation effects.
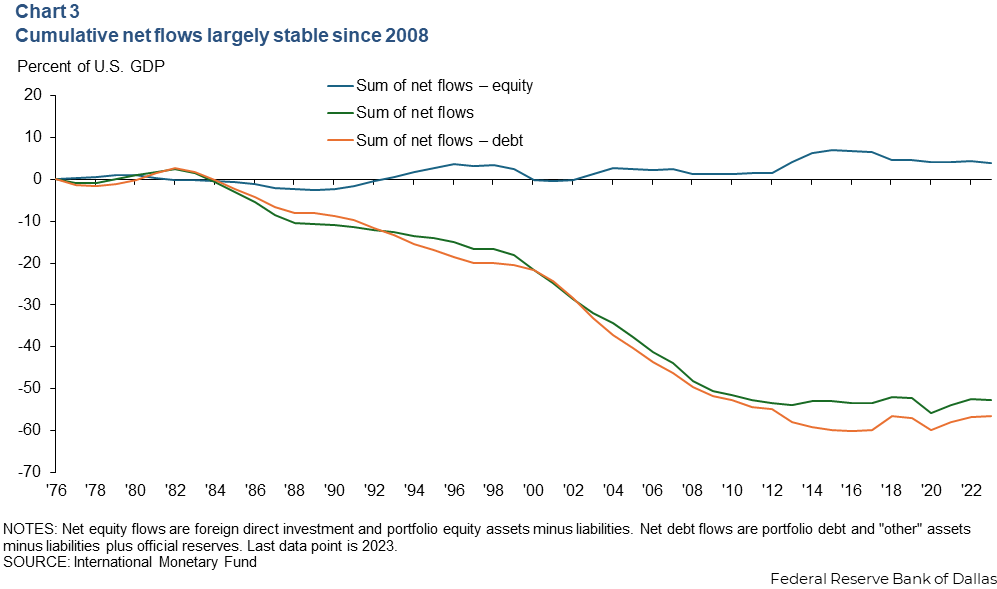
Chart 3 plots the cumulative sum of debt, equity and total net flows since 1976. The cumulative sum of net equity flows is close to zero, meaning that the cumulative sum of net debt flows is very close to the cumulative sum of total net capital flows—the sum of national savings. This cumulative sum of national savings fell sharply between 2000 and 2007 but has remained fairly constant as a share of GDP since 2008.

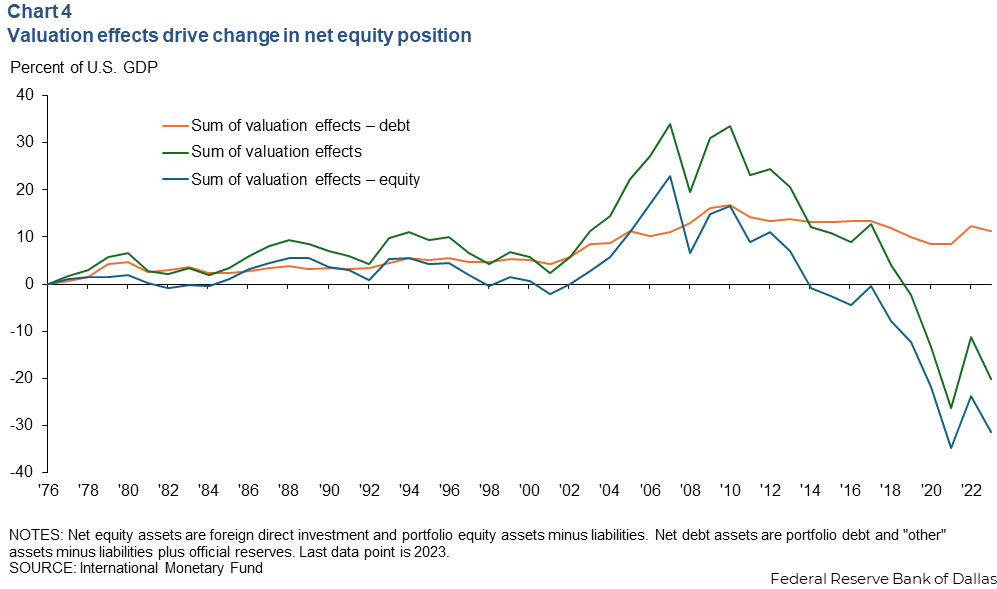
Given the net foreign asset positions in Chart 1 and the cumulative sum of net flows in Chart 3, we can back out the cumulative sum of valuation effects in Chart 4.

For the net position in debt securities, the sum of valuation effects is small and stable. This indicates that most changes in the debt position are due to net debt flows. The opposite is true for the net equity position. Given that the cumulative sum of past net equity flows is close to zero, the net equity position simply reflects the cumulative sum of past valuation effects.
What has driven this fall in the valuation of the U.S net equity position? U.S. equities have far outperformed foreign equities over the past 15 years, as Atkeson, Heathcote and Perri (2022) discuss. The net return on the Morgan Stanley Capital International (MSCI) U.S. equity index was 477 percent (including reinvestment of net dividends) from August 2009 through August 2024, and the net return on the MSCI World ex. U.S. index has been 145 percent (including dividend reinvestment).
This means that the value of U.S. equity assets held by foreign residents has risen much more than the value of foreign equity assets held by U.S. residents.
Decline in the net equity position reflects risk sharing
U.S residents hold a diversified portfolio of domestic and foreign equities. This diversification is key to minimizing risk of their holdings, and it means that the risk of relative asset price changes is shared between U.S. and foreign residents.
Over the past 15 years, there has been a sharp increase in U.S. equity prices, and, thus, in the value of the equity liabilities of U.S. firms, which the rest of the world increasingly holds. This decline in the U.S. net equity position following this increase in the relative value of U.S. equities reflects the fact that some of the wealth created by increasing U.S. equity prices has been shared with the rest of the world.
About the author


