Austin Economic Indicators

Austin economic activity held steady in May. The Austin Business-Cycle Index continued to grow near trend. Job growth accelerated after softening in March and April, while the unemployment rate fell to its lowest rate since the beginning of the year. Recently released detailed job data for high-tech employment suggest that growth in both tech services and manufacturing was strong last year.
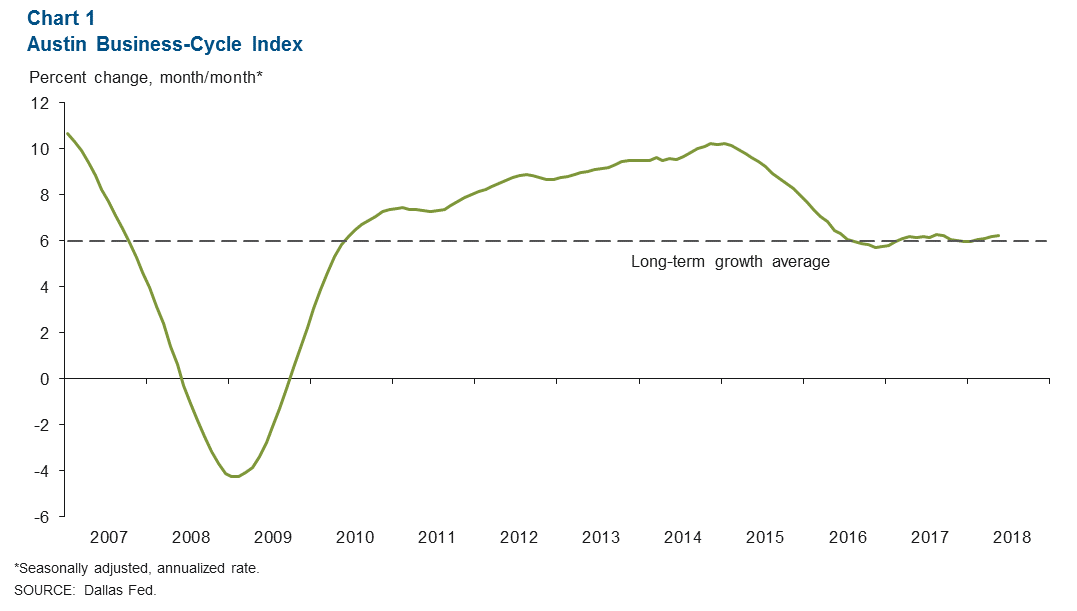
Austin Business-Cycle Index
The Austin Business-Cycle Index expanded at a 6.2 percent rate in May (Chart 1), similar to April’s pace and slightly above the long-term rate of 6.0 percent. May employment growth and the jobless rate continued to indicate strength; however, growth in the index remains somewhat subdued and has held near its long-term average since mid-2016.
Labor Market
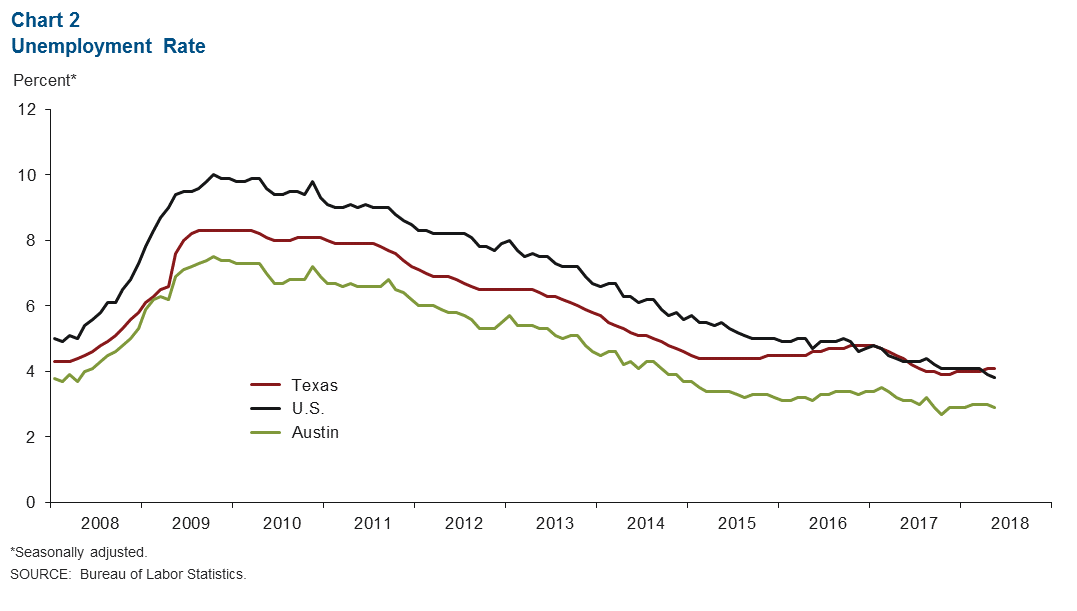
Unemployment Rate Falls
Austin’s unemployment rate fell to a low 2.9 percent in May from 3.0 percent in April (Chart 2). This is well below the May state and U.S. jobless figures of 4.1 and 3.8 percent, respectively. The local labor force has expanded at a strong 3.8 percent annualized pace year to date, faster than Texas’ 3.5 percent and behind only Dallas among the state’s major metros.
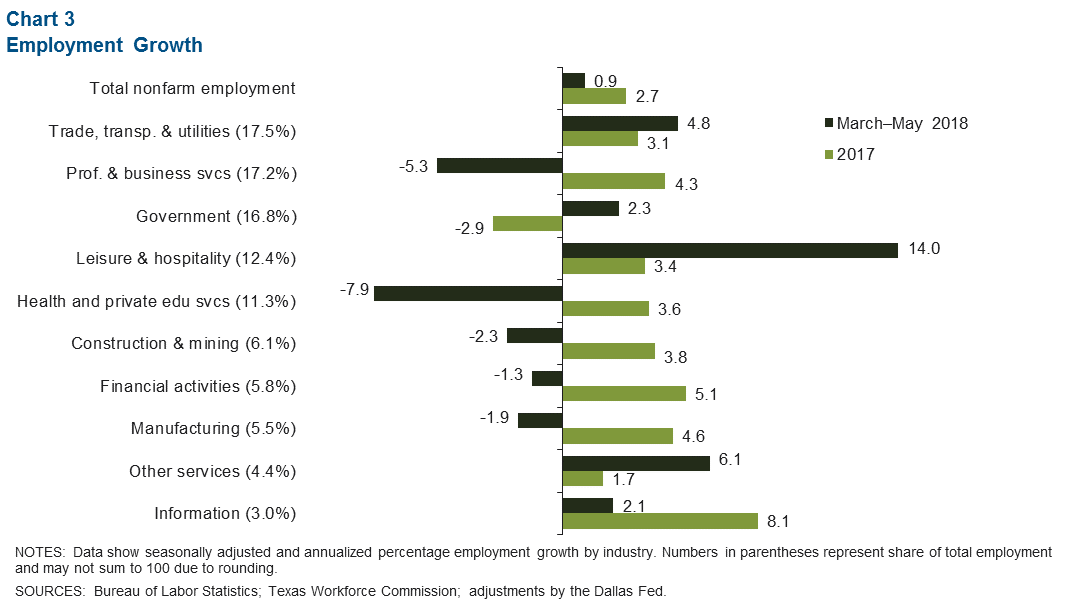
Recent Job Growth Moderates
Austin jobs grew at a mild 0.9 percent annualized rate over the three months through May (Chart 3). Growth was mixed across industries, with all goods-producing sectors and several large service sectors shedding jobs. The large sectors of professional and business services and health and education services in particular experienced sharp declines and shed nearly 3,300 jobs over this time. Conversely, leisure and hospitality employment surged, adding over 4,200 jobs. Retail and wholesale trade continued to grow, pushing trade, transportation and utilities employment well above its pace last year.
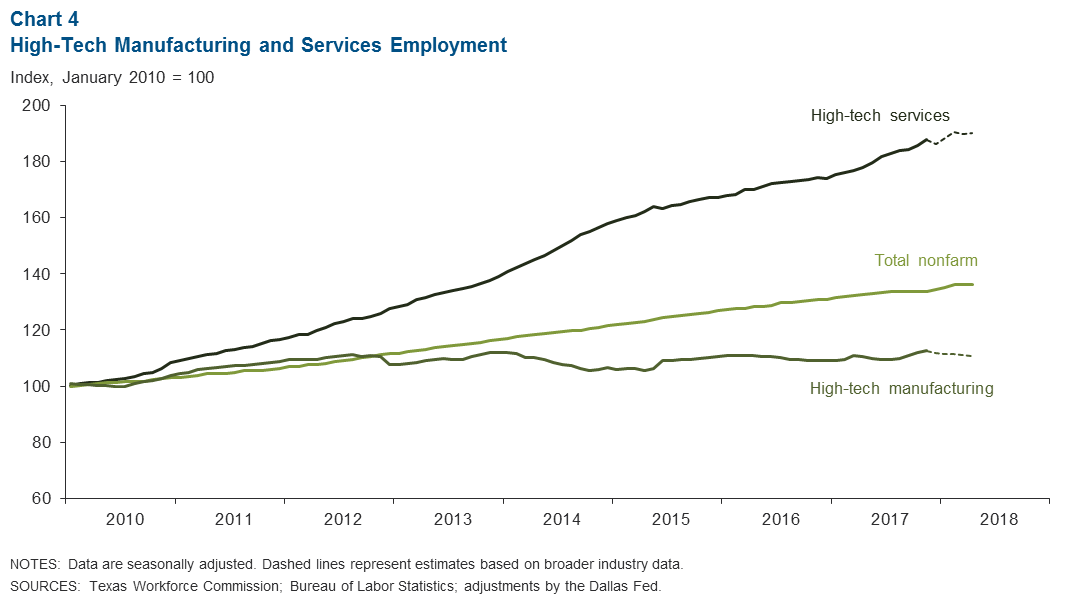
High-Tech Services Jobs Grow Steadily
High-tech service and manufacturing jobs grew last year in Austin (Chart 4). The most recently available detailed industry data show that the high-tech industry added jobs at a 6.3 percent rate in 2017, more than double the 2.7 percent rate for total jobs. However, the tech services sector, which includes computer systems design, data processing, scientific research and development, and other related industries, accounted for the majority of this growth at 7.7 percent. Meanwhile, manufacturing, which primarily comprises computer and electronics manufacturing, grew just 3.1 percent. Broader industry data suggest that year-to-date growth in high-tech has slowed somewhat, with services increasing 3.1 percent (annualized) and manufacturing declining 4.0 percent.
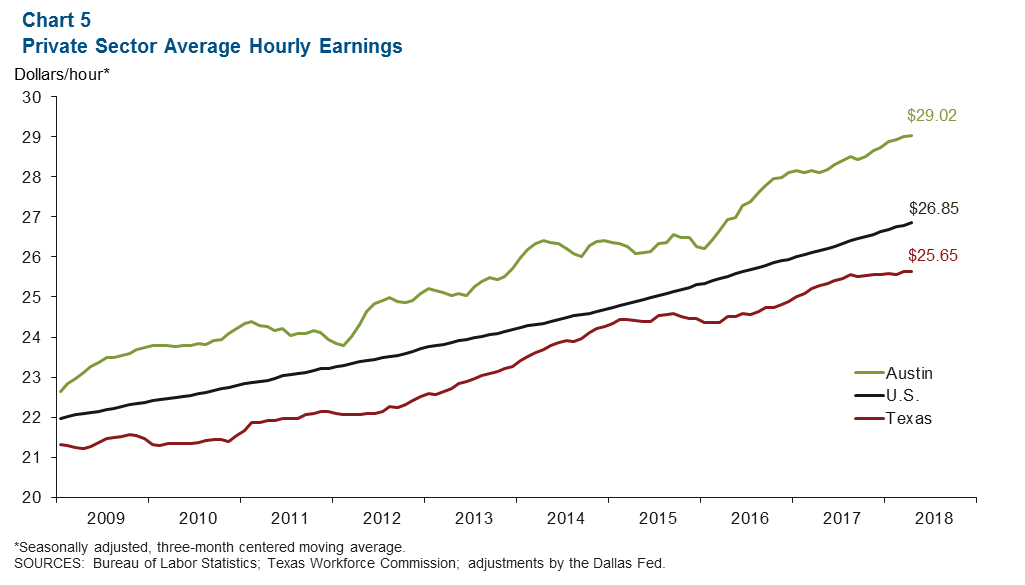
Wages Continue to Climb
Hourly wages in Austin rose in May, and the April value of the three-month centered moving average rose to $29.02 (Chart 5). This remains well above the U.S. and Texas averages. Year over year, average wages in Austin rose 3.4 percent, compared with a 2.7 percent rise for the U.S. and a 1.3 percent increase for Texas. However, year-to-date wage growth has moderated to just 0.8 percent, possibly due to the recent sharp decline in high-paying professional services jobs combined with a surge in hiring for lower-paying leisure and hospitality jobs.
Real Estate
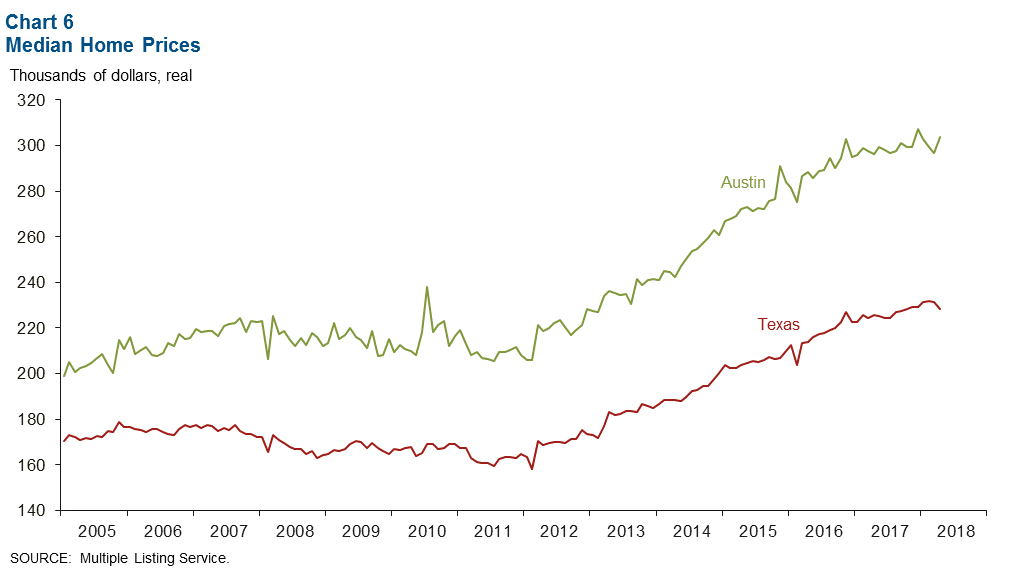
Austin’s median home price picked up in April to $303,628, compared with a dip in the Texas median price to $228,137 (Chart 6). Year over year, prices are up 2.5 percent in Austin—notably weaker than the 5.6 percent growth rate 12 months prior but still above the state’s 1.0 percent increase. Austin remains the most expensive residential housing market in Texas and has the second-lowest inventory levels— 2.5 months’ supply—behind Fort Worth among the state’s large metros.
NOTE: Data may not match previously published numbers due to revisions.
About Austin Economic Indicators
Questions can be addressed to Christopher Slijk at christopher.slijk@dal.frb.org. Austin Economic Indicators is released on the first Thursday of every month.