Dallas-Fort Worth Economic Indicators

Dallas–Fort Worth economic growth continued to be healthy in March. Payroll employment in the first quarter expanded at its fastest rate in two and a half years. Unemployment fell to an 18-year low, and the Dallas and Fort Worth business-cycle indexes expanded further. Office leasing activity and industrial demand remained solid in the first quarter.
Labor Market
Payroll Expansion Remains Robust
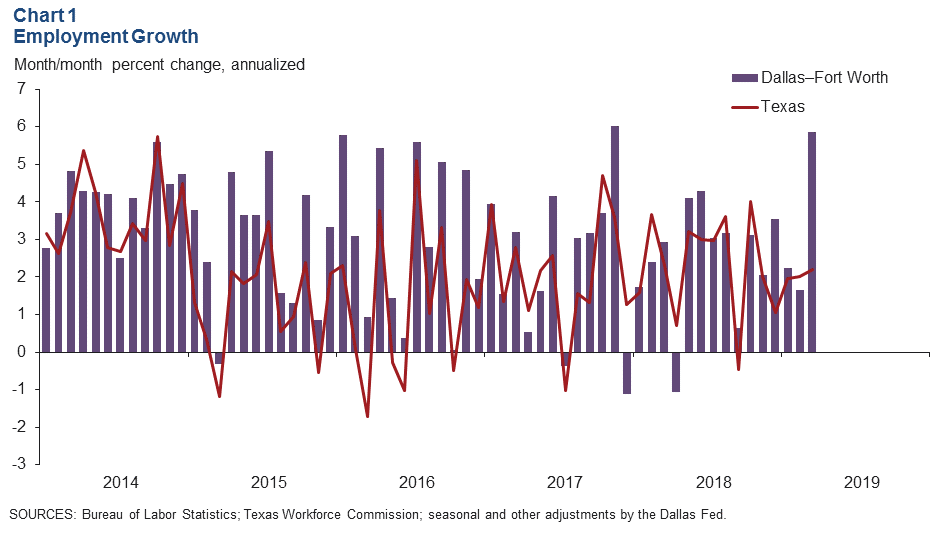
DFW employment rose an annualized 5.9 percent in March (Chart 1). Payroll expansion remained strong in Dallas at 6.0 percent (13,060 jobs). Employment in Fort Worth rebounded in March, rising 5.5 percent following declines the previous two months. In the first quarter, Dallas added jobs at an annualized 4.6 percent pace, while employment was flat in Fort Worth at -0.1 percent.
Job Gains Accelerate in First Quarter
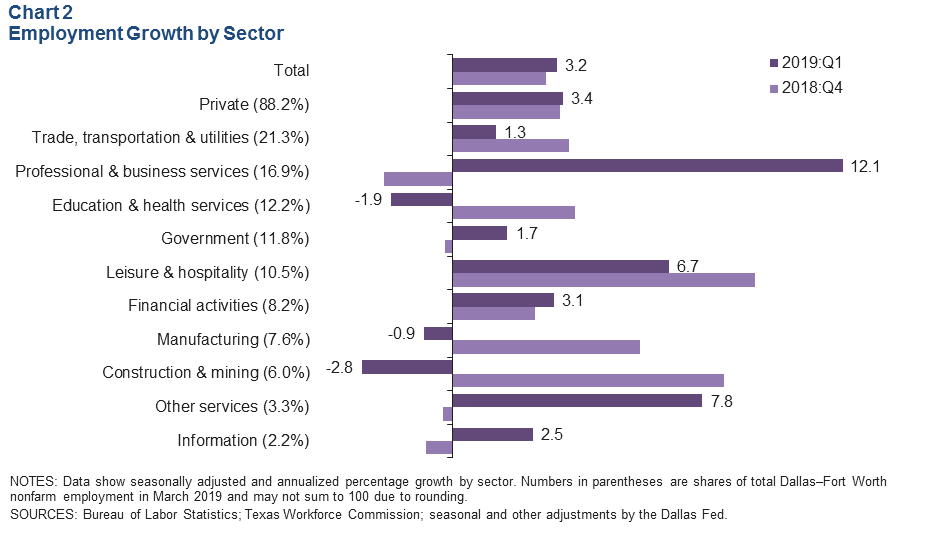
Jobs in DFW grew at a 3.2 percent annualized rate in the first quarter—the fastest pace since third quarter 2016, when employment expanded 4.5 percent. Growth was mixed, with payrolls in the goods-producing sector contracting an annualized 1.7 percent. Expansion among service-providing industries was led by a surge in professional and business services employment (Chart 2). Hiring in leisure and hospitality and other services was also strong, particularly in Dallas. Job growth accelerated in financial activities in the quarter but moderated in trade, transportation and utilities as a result of payroll declines in Fort Worth’s retail trade and transportation, warehousing and utilities industries. Education and health care employment contracted over the three-month period, partly due to a slowdown in health care and social assistance hiring.
Unemployment Drops to Multiyear Lows
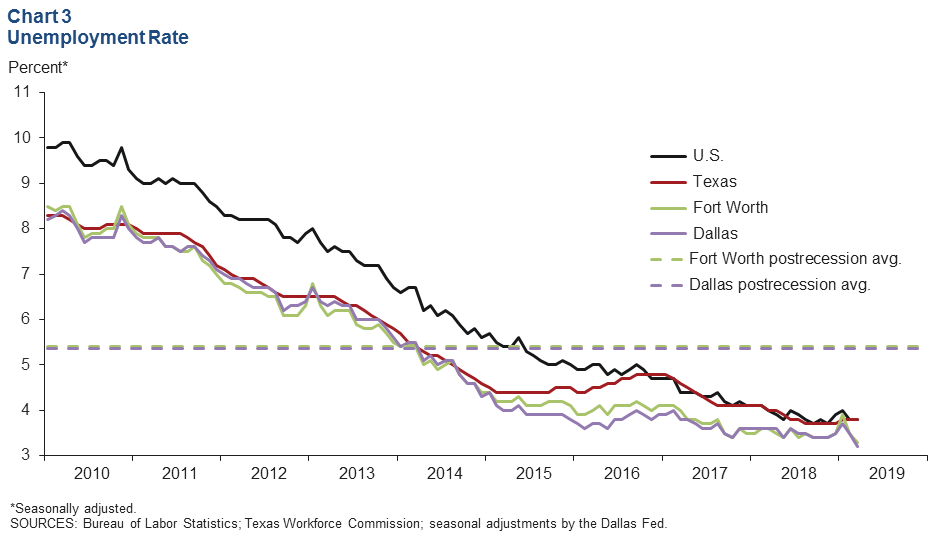
The labor market tightened further, with unemployment dropping to its lowest level since December 2000 in both Dallas and Fort Worth. The unemployment rate dipped to 3.2 percent in Dallas and 3.3 percent in Fort Worth (Chart 3). Jobless rates in both metros were below the state and U.S. rate of 3.8 percent.
Business-Cycle Indexes
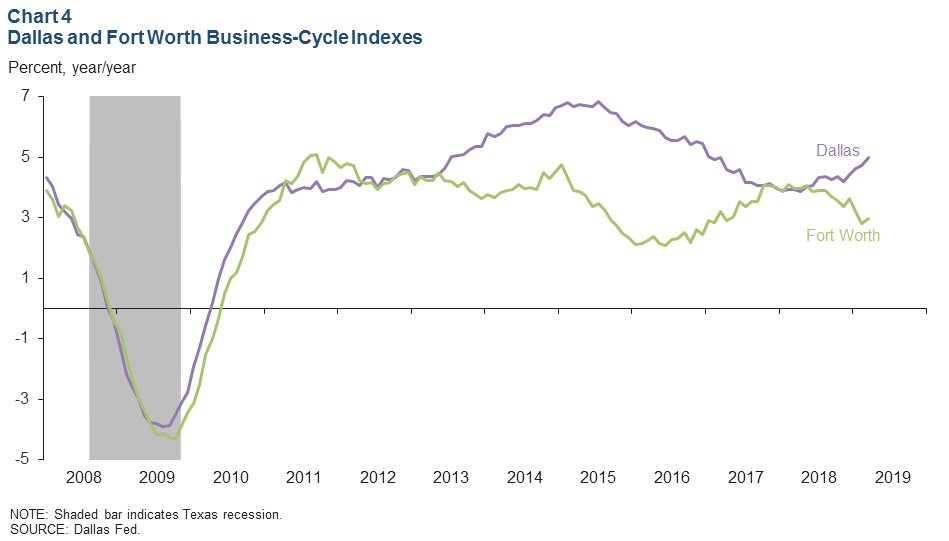
The Dallas and Fort Worth business-cycle indexes strengthened in March as job growth improved and unemployment fell (Chart 4). The Dallas index rose an annualized 7.4 percent, quicker than February’s 6.0 percent rate. The Fort Worth index rebounded, expanding 6.1 percent after declining for two straight months. After tracking closely from late 2017 through mid-2018, growth in the two metro indexes has diverged again, in part due to stronger job growth in Dallas.
Commercial Real Estate
Office Leasing Stays Strong
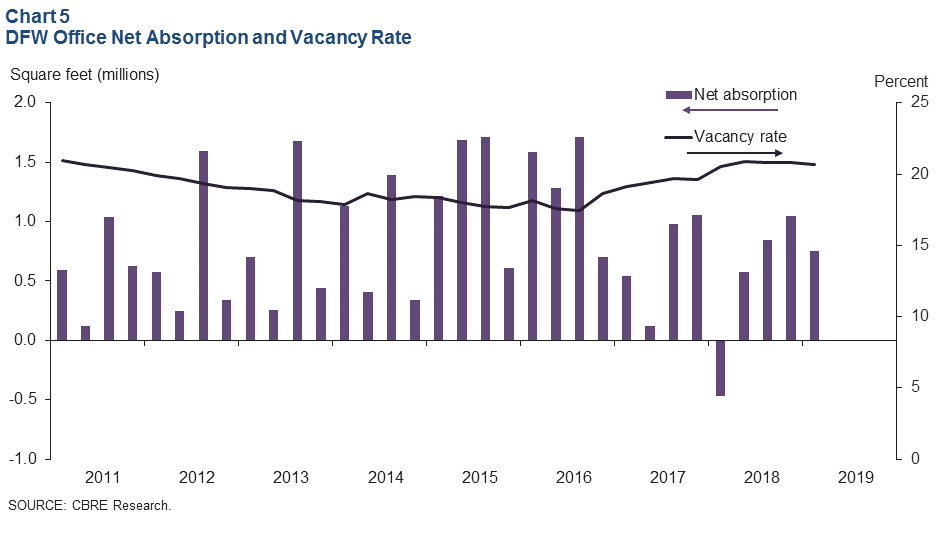
The DFW office market was active in the first quarter, with net absorption totaling over 750,000 square feet and the vacancy rate dipping to 20.7 percent, according to data from CBRE Research (Chart 5). Average asking rents edged up. The construction pipeline remained robust at 4.1 million square feet, similar to the trend observed the past few years.
Industrial Demand Remains Healthy
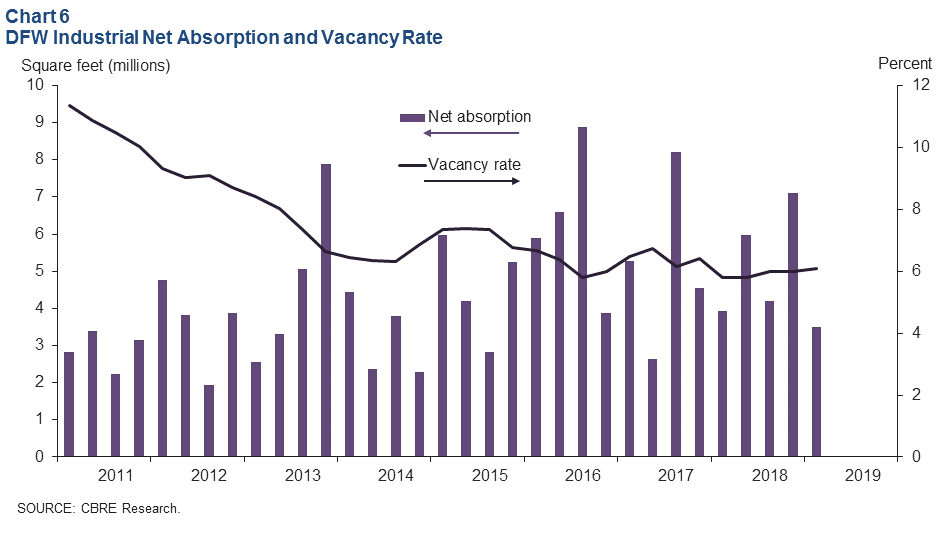
Leasing activity continued to be solid in the industrial space, with positive absorption and persistently low vacancy rates in the first quarter, according to CBRE (Chart 6). Net absorption was 3.5 million square feet, driven by demand from consumer goods, e-commerce and third-party logistics firms. The vacancy rate edged up to 6.1 percent but remains below the historical average. The construction pipeline grew to 22.7 million square feet, and nearly half of the product under construction was preleased.
NOTE: Data may not match previously published numbers due to revisions.
About Dallas–Fort Worth Economic Indicators
Questions can be addressed to Laila Assanie at laila.assanie@dal.frb.org. Dallas–Fort Worth Economic Indicators is published every month on the Tuesday after state and metro employment data are released.