Houston Economic Indicators

Recent economic data remain positive for Houston. January employment growth was healthy, and job growth in 2017 was stronger than initially estimated. Though business bankruptcy filings remain elevated, leading indicators of local employment growth have been improving and suggest Houston will receive a tailwind from the state and national economies.
Business-Cycle Index
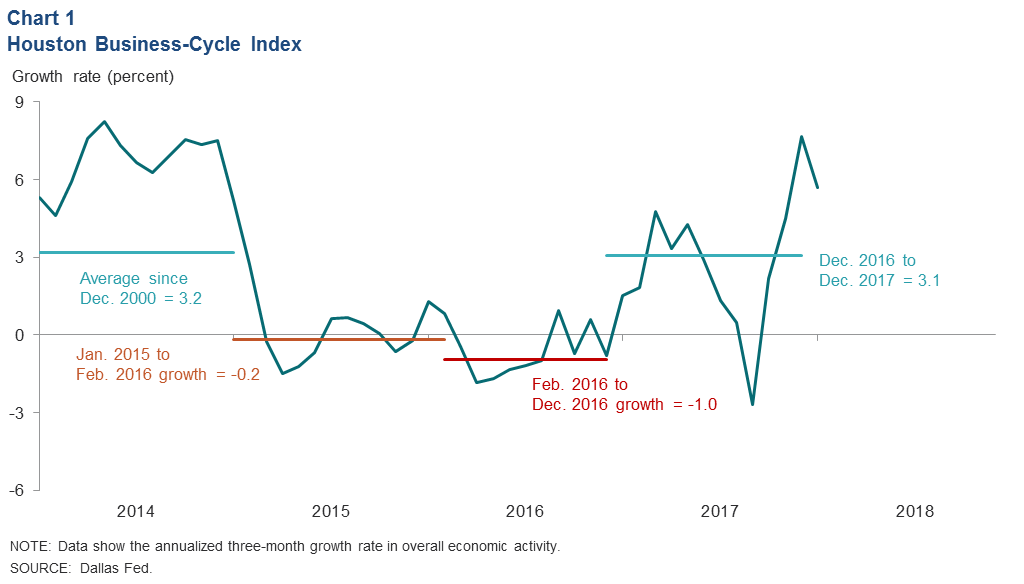
Growth in the Houston Business-Cycle Index was 5.7 percent over the three months ended in January 2018 (Chart 1). For 2017, the index was revised up from a growth rate of 2.3 percent to 3.1 percent—on par with its longer-run average of 3.2 percent. Current evidence suggests that the collapse of oil prices at the end of 2014 triggered a mild recession in Houston from early 2015 to late 2016.
Employment
The Bureau of Labor Statistics upwardly revised its estimate for Houston employment in 2017 based on more comprehensive data. The estimate shows that employment grew 1.9 percent from December 2016 through December 2017 (about 57,800 jobs), above the Dallas Fed early estimate of 1.4 percent reported at the end of January (Chart 2). The biggest job gains were in professional and business services (23,000) and trade, transportation and utilities (11,300), followed by construction (8,000), which surged at the end of the year due to post-Hurricane Harvey rebuilding. No broad industry classification in Houston saw net job losses over 2017.
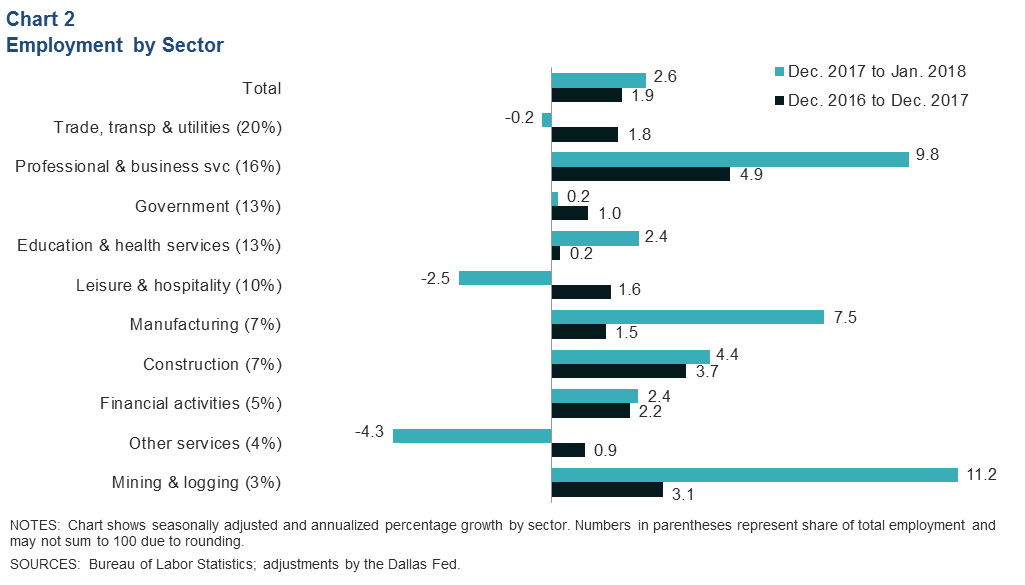
While one should use caution interpreting a single month of data, the initial estimate for January 2018 shows annual growth of 2.6 percent (6,500 jobs), above Houston’s longer-term trend of 2.1 percent. Professional and business services added the most jobs of all industries (3,900), followed by manufacturing (1,300). Mining saw the largest percentage gain in January at an annual 11.2 percent, or about 700 jobs. Leisure and hospitality (700) and other services (400) lost the most jobs. Leisure and hospitality likely declined as Harvey victims began moving out of hotels and back into their homes.
The unemployment rate in Houston was 4.7 percent in January, in line with the six-month moving average. For comparison, the unemployment rate was 4.0 percent in Texas in January and 4.1 percent in the U.S.
Bankruptcies
Business bankruptcies filed in the Southern District of Texas, principally in Houston, dropped in the second half of 2017 (Chart 3). However, it is unclear if the upward trend that began in 2015 has ended. Filings by energy companies have dropped off substantially, based on monthly data tracked by law firm Haynes and Boone, but other industries stressed by the oil bust as well as Hurricane Harvey may have contributed to the end-of-year numbers.
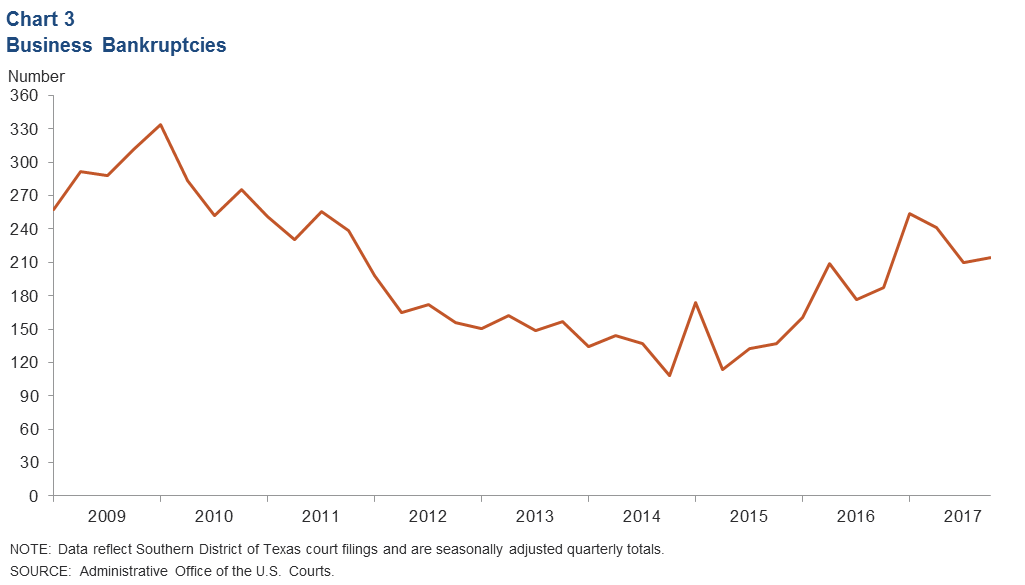
Bankruptcies are a lagging indicator of economic activity—they tend to change direction months after the broader economy has already turned. For example, despite the end of the Great Recession in June 2009 and the dawn of an oil-and-gas drilling boom, business bankruptcies filed in the Southern District court didn’t fall to prerecession levels until 2012. Broader measures of the regional and national economy improved during 2017 and should put downward pressure on bankruptcy filings going forward.
Leading Indicators
Houston Leading Index Accelerates Through January
An index of leading economic indicators developed for Houston grew for the fifth consecutive month through January 2018 (Chart 4). The increase is suggestive of healthy job growth over the next six months. All 11 components contributed to the improvement. Oil prices and chemical production were the biggest contributors, while single-family residential construction permits and existing-home sales were the smallest.
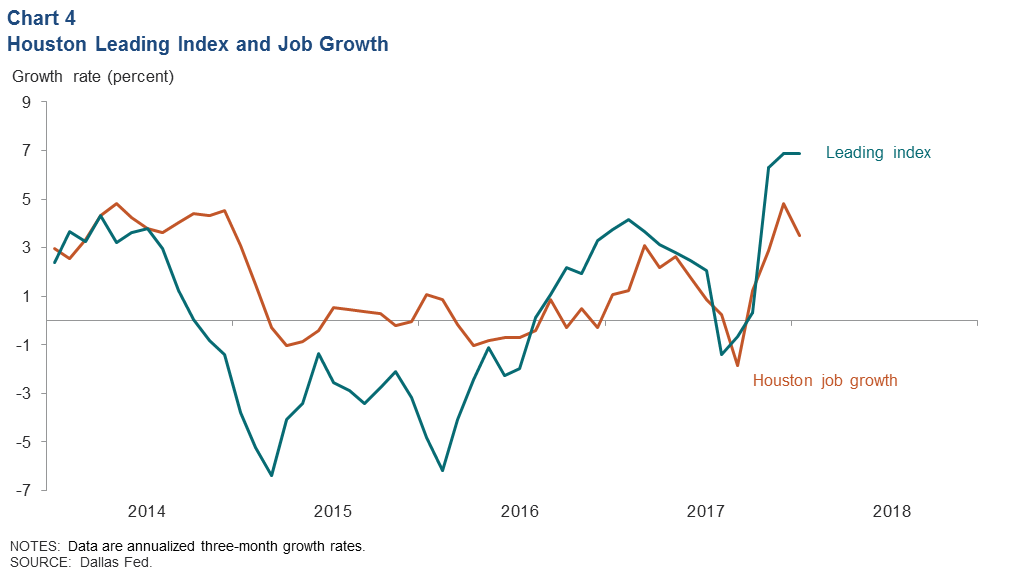
Other components include the Houston 150 stock index, the Conference Board’s U.S. leading index, the sales and production components of the Houston Purchasing Managers Index, the number of active oil and gas drilling rigs in the U.S., Help Wanted OnLine job advertisements from the Conference Board and the Texas Leading Index (TLI).
Locally Focused Data Point to Growth
The Houston Purchasing Managers Index ticked up to 55.6 in February—its fourth consecutive month above 50 and the strongest reading since October 2014 (Chart 5). This index is one of the timeliest indicators of economic activity in Houston, and two of its components are included in the Houston Leading Index. Values above 50 indicate expanding economic activity and strongly suggest positive job growth over the next three to four months.
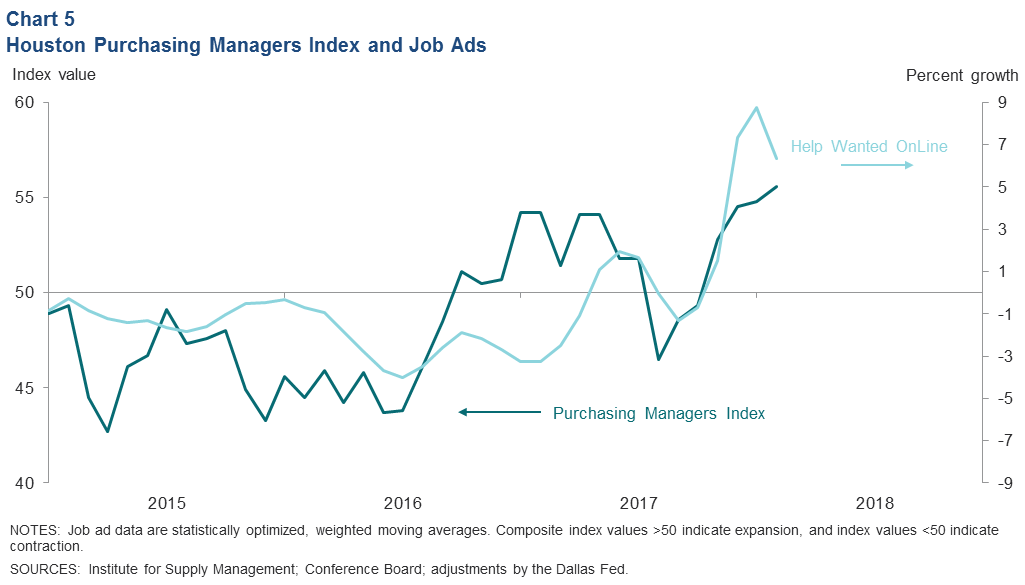
The total number of job advertisements in Houston grew in the final months of 2017 and early 2018—the strongest monthly gains in implied labor demand since the recession. Initially led by construction and maintenance occupations after Hurricane Harvey, advertisements became more broadly based over the four months ending in February. Increases in Help Wanted OnLine ads are associated with accelerated job growth over the next few months.
Broader Economic Conditions Also Improving
Indicators of future growth for the state and national economies suggest Houston will benefit from economic tailwinds. Growth in the U.S. leading economic index accelerated for the third straight month in January on broad-based improvements in economic data and business sentiment (Chart 6). This bodes well for Houston job growth in 2018. The health of the U.S. economy became increasingly important to Houston’s job growth as the region diversified away from energy after the 1980s.
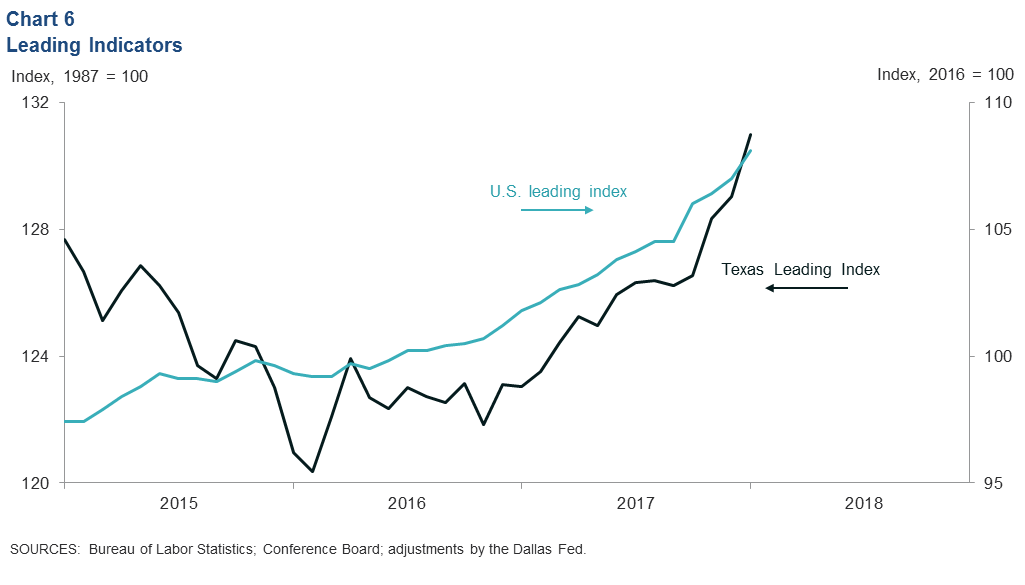
The TLI has also seen a broad-based acceleration over the past three months, with all eight components supportive of job growth. This is suggestive of healthy job growth in Houston over the next six months.
NOTE: Data may not match previously published numbers due to revisions.
About Houston Economic Indicators
Questions can be addressed to Jesse Thompson at jesse.thompson@dal.frb.org. Houston Economic Indicators is posted on the second Monday after monthly Houston-area employment data are released.