Houston Economic Indicators

Houston’s economy continues to grow at a healthy pace despite signs of a slowdown in its core energy-related sectors. Employment and business-cycle indicators are increasing, and loan growth at Houston-based banks continues to outperform the nation. Overall, the outlook remains positive.
Houston Business-Cycle Index
The Houston Business–Cycle Index grew at an annual pace of 6.4 percent from May to August 2018, extending the expansionary trend that characterized the first half of the year (Chart 1).
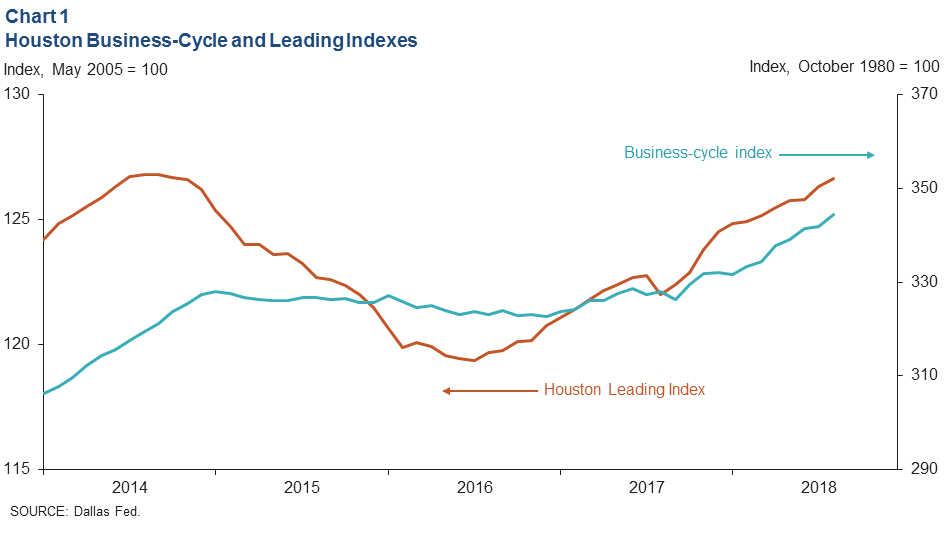
A leading index of 11 economic indicators for Houston grew at an annual pace of 3 percent from May to August despite a sharp drop in the contribution of oil and gas drilling to the index. That change in the index is supportive of above-average job growth through the remainder of the year. Historically, the average has been about 2.1 percent.
Employment by Sector
Houston employment grew 3.8 percent over the three months ending in August, led by a surge in construction (13,600 jobs) (Chart 2). Also seeing gains were education and health services (5,600) and trade, transportation and utilities (4,233—mostly wholesale durable goods and transportation). Job losses were led by other services such as auto repair shops and dry cleaners (1,300). Mining added zero jobs over the period.
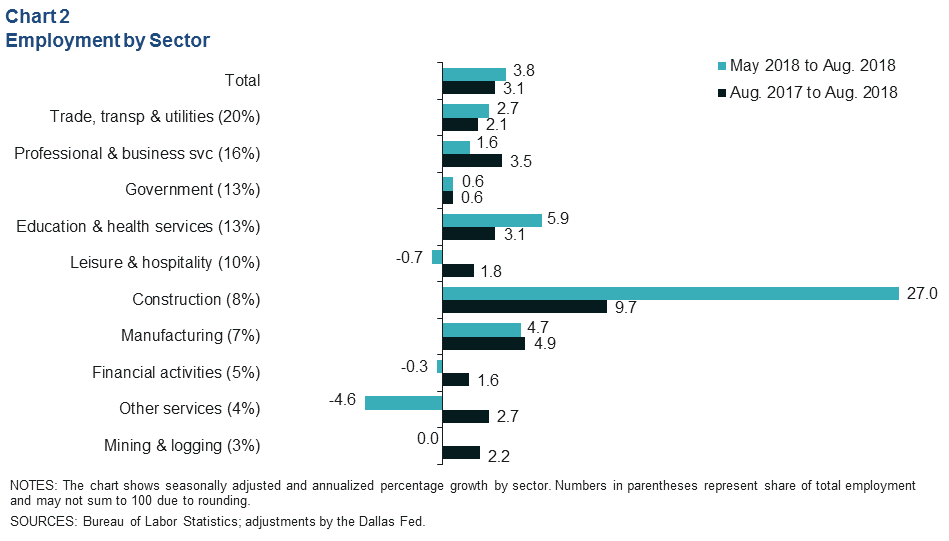
Year over year, Houston employment grew 3.1 percent in August. Construction (20,800) was the growth leader over that period. Professional and business services added the second-largest number of jobs (16,800), while the smaller manufacturing sector logged the second-fastest job growth rate (4.9 percent). All of the major sectors increased from August 2017 to August 2018.
The unemployment rate in the metro fell slightly to 4.2 percent in August amid a very modest decline in the labor force, which tends to pull down the unemployment rate. That is the lowest seasonally adjusted unemployment rate for Houston since February 2008. The U.S. and Texas both had unemployment rates of 3.9 percent in August.
Houston Energy
Energy Economy Plateaus
The price of West Texas Intermediate (WTI) crude oil was unable to break from the trading range that dominated the summer months. September prices averaged nearly $70 per barrel. Pipeline constraints in the Permian Basin, geopolitics and production outages have helped hold up prices under increasing domestic crude oil production. Growth in the U.S. rig count has been nil over the past few months (Chart 3).
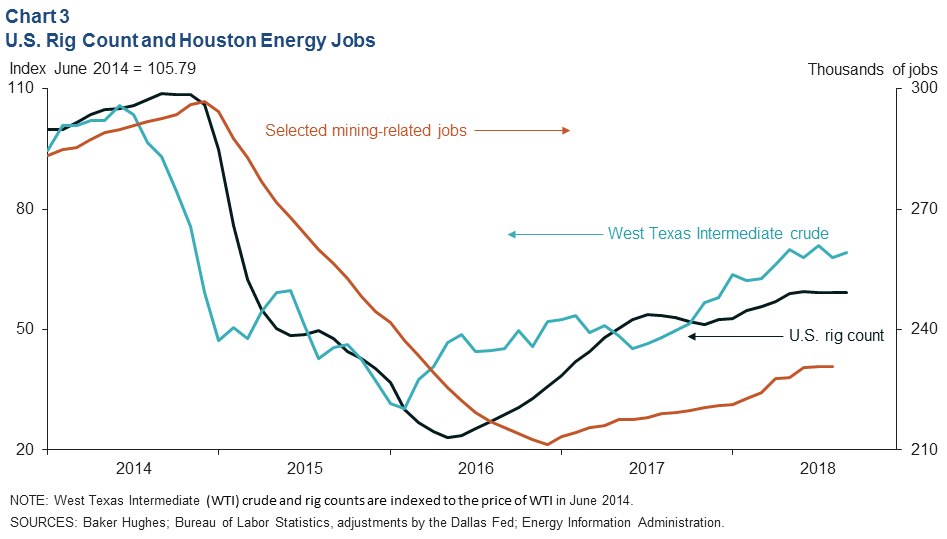
Mining-related job growth—which includes manufacturing and service sector jobs that are highly correlated with drilling activity—was flat from June to August after logging nearly a year and a half of continuous gains. The first half of 2018 saw growth accelerate, but the prospect of pipeline-limited drilling and completion activity in West Texas may curtail the sector’s employment growth potential until new pipelines are delivered in 2019.
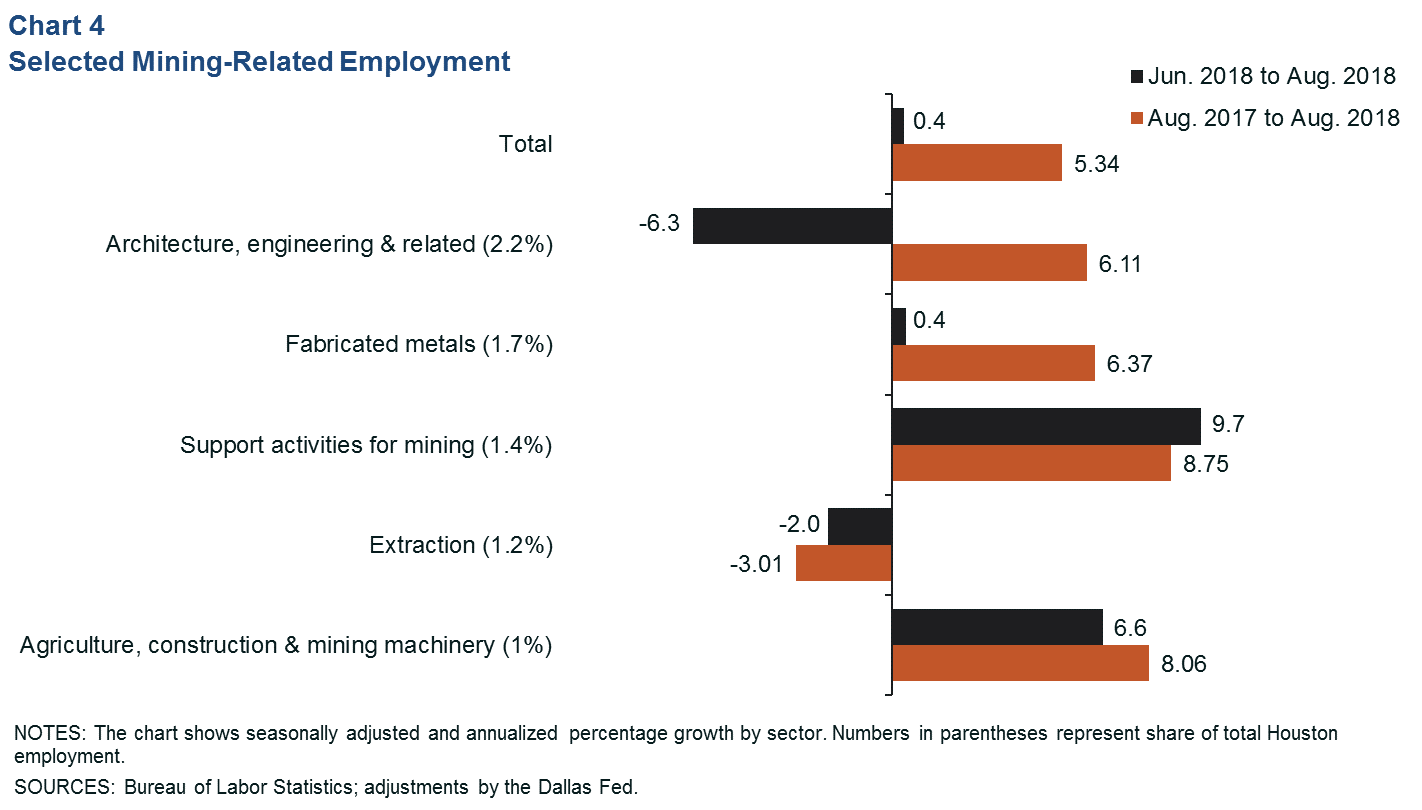
Mining-Related Job Growth Mixed
After adding nearly 2,500 jobs from May to June, the mining-related sector saw mixed job growth over the summer (Chart 4). Support activities for mining such as drilling and completion services (660) and the agriculture, construction and mining machinery manufacturing sector (320) grew substantially over that period. Architecture, engineering and related services (-750) contracted for the first time in over a year, while extraction (-120) continued to shed jobs.
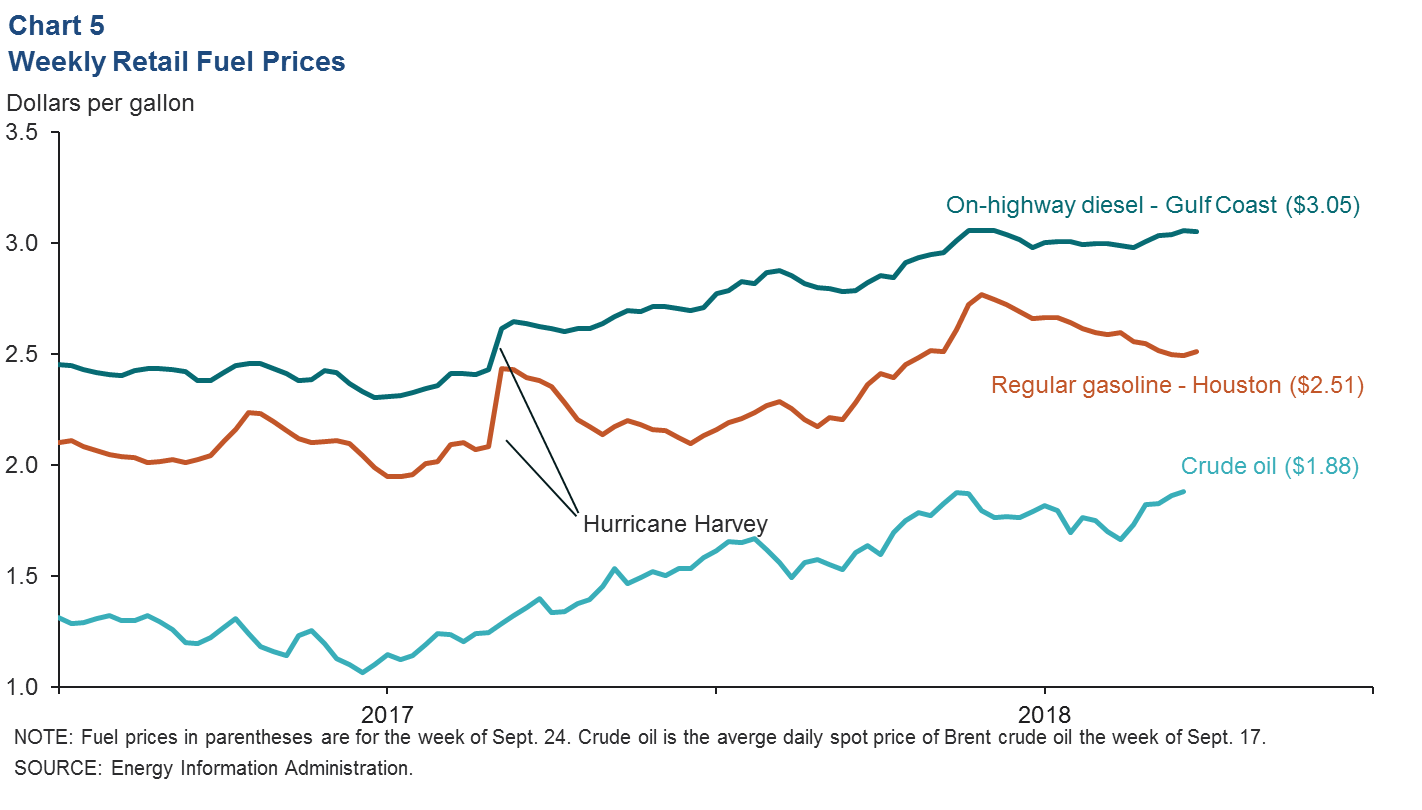
Local Fuel Prices Diverge as Crude Price Rises
On a dollar-per-gallon basis, Brent crude oil has been trending up over the past several weeks, rising from a summer low of $1.66 in mid-August to $1.88 the week of Sept. 17. Motor fuels are traded on a global market and tend to follow the price of international oil benchmark Brent crude more closely than domestic crude prices. On-highway diesel prices in the Gulf Coast region have risen over the past several weeks, while gasoline prices slipped from $2.60 in mid-August to $2.51 in mid-September despite strong weekly U.S. consumption numbers and rising crude prices (Chart 5).
Bank Loan Growth
The outstanding value of loans at banks headquartered or chartered in Houston grew a nominal 11.6 percent from second quarter 2017 to second quarter 2018 (Chart 6). That was slightly slower than the 13.4 percent annual growth logged in the first quarter, but Houston banks are still outpacing the nation as a whole. By comparison, U.S lending growth slowed to 4.3 percent from 4.9 percent in the first quarter.
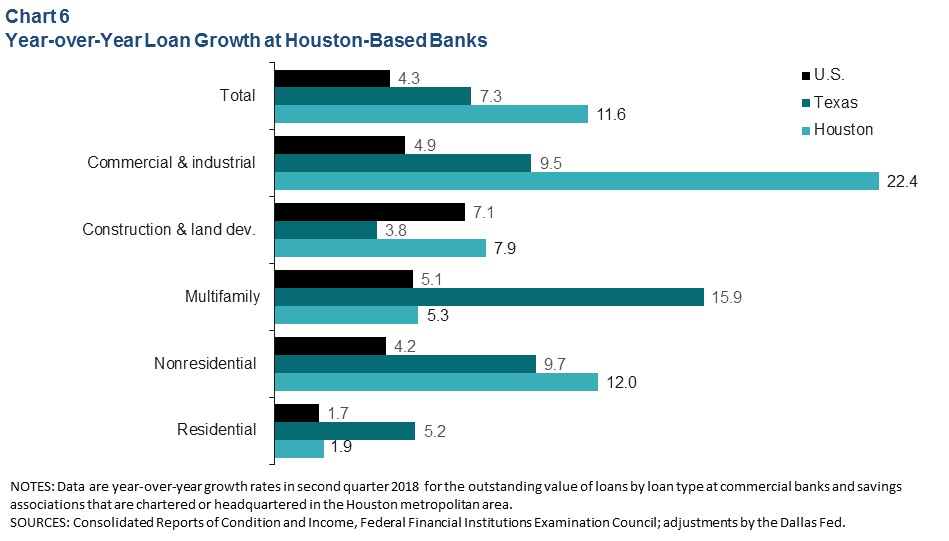
Commercial and industrial (C&I) lending was again the growth driver in Houston, rising 22.4 percent from the same quarter a year ago after climbing 30.5 percent in the first quarter. Over the past year and a half, this sector has logged its strongest annual loan growth since the Great Recession. Multifamily lending grew 5.3 percent in Houston in the second quarter after contracting in the first. Two-thirds of the total outstanding loan value at the 40 banks in the sample came from nonresidential and C&I loans.
NOTE: Data may not match previously published numbers due to revisions.
About Houston Economic Indicators
Questions can be addressed to Jesse Thompson at jesse.thompson@dal.frb.org. Houston Economic Indicators is posted on the second Monday after monthly Houston-area employment data are released.