Houston Economic Indicators

Growth in employment and the business-cycle index slowed for Houston at the start of the year. Leading indicators were mixed but largely painted a softer outlook for 2019. Revisions to 2018 jobs data by the Bureau of Labor Statistics underscored the importance of benchmarking for tracking Houston’s economy in real time, as the recently revised data closely match Dallas Fed estimates. Overall, the outlook for the Houston region remains positive.
Employment
Benchmark Jobs Data Proved More Accurate in Real Time
Quarterly benchmarking by the Dallas Fed provided early evidence that initial estimates of 2018 job growth from the Bureau of Labor Statistics (BLS) would prove too optimistic. Houston employment grew by about 69,000 jobs in 2018—in line with early benchmark estimates produced by the Dallas Fed but less than two-thirds of the initial BLS estimate (not benchmarked) in January (Chart 1).
That the revision would be substantial was evidenced first in August 2018 (Q1 benchmark) and then November (Q2 benchmark). These benchmarks showed job growth in the first half of 2018 trending below initial estimates by 10,000 and 20,000 jobs, respectively.
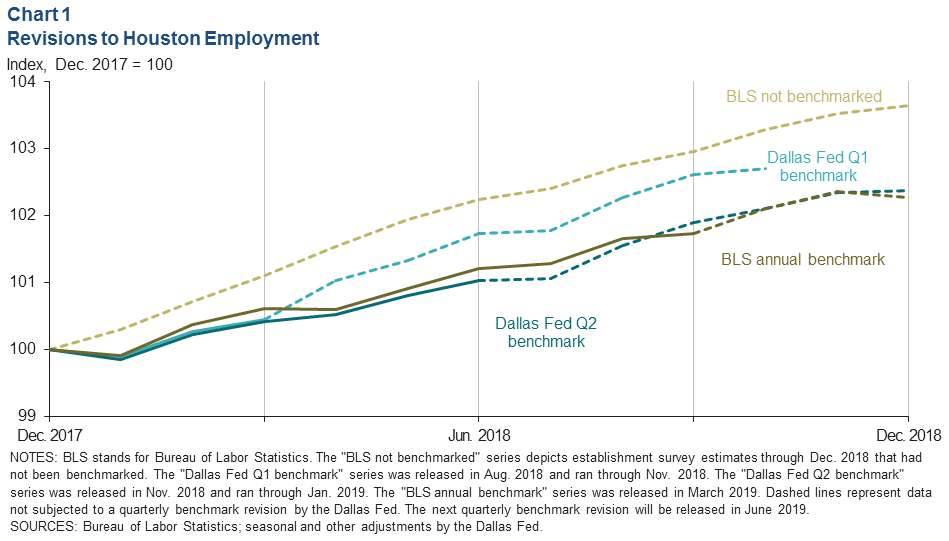
While top-line growth in the BLS annual benchmark for 2018 did not change much from the Dallas Fed’s January numbers (based on the second quarter benchmark), there were significant changes on a sectoral basis. The biggest changes were in manufacturing, which added 12,200 jobs versus 16,300 in the second quarter benchmark, and government, which grew by 5,900 jobs as opposed to 1,900.
Recent Job Growth Slowed
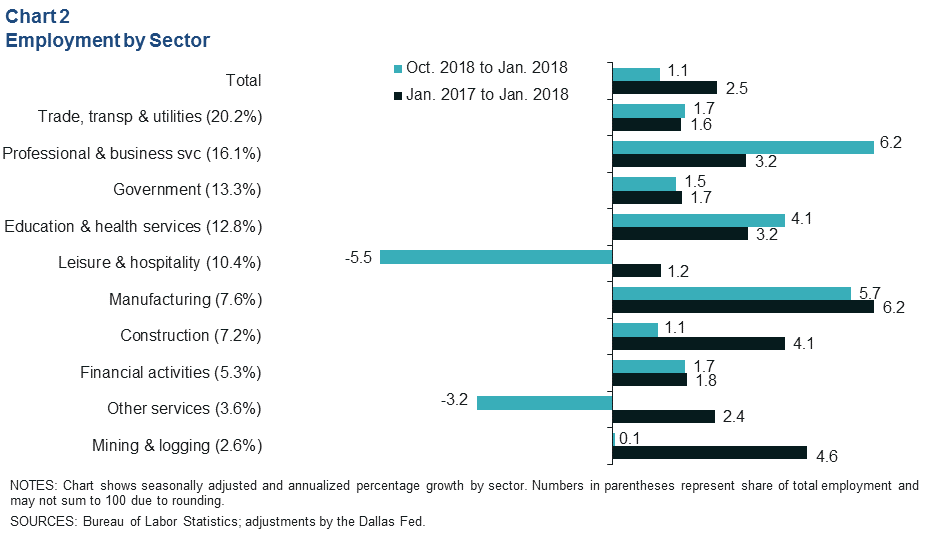
Looking at the most recent data, total nonfarm employment growth for the three months ending in January slowed to 1.1 percent (8,800 jobs) (Chart 2). The biggest contributors to growth over that period were professional and business services (7,500), education and health services (4,000) and manufacturing (3,200). Growth in leisure and hospitality turned sharply negative (-4,600).
The unemployment rate in Houston ticked up to 4.3 percent in January 2019 on a rise in the local labor force. By comparison, the Texas rate was 3.8 percent and the U.S. was 4 percent. Congruent with the recent employment revisions, metro unemployment data for 2018 was updated to show local labor force growth of only 2 percent as opposed to 3.1 percent.
Business-Cycle Indicators
Leading and Coincident Indexes Indicate Slowing
Incorporating a clearer picture of Houston’s 2018 job growth, the Houston Business-Cycle Index—a broad measure of economic activity—grew 4.2 percent from Dec. 2017 to Dec. 2018, above its historical average of 3.5 percent. However, the index slowed to 2.2 percent for the three months ending in January (Chart 3).
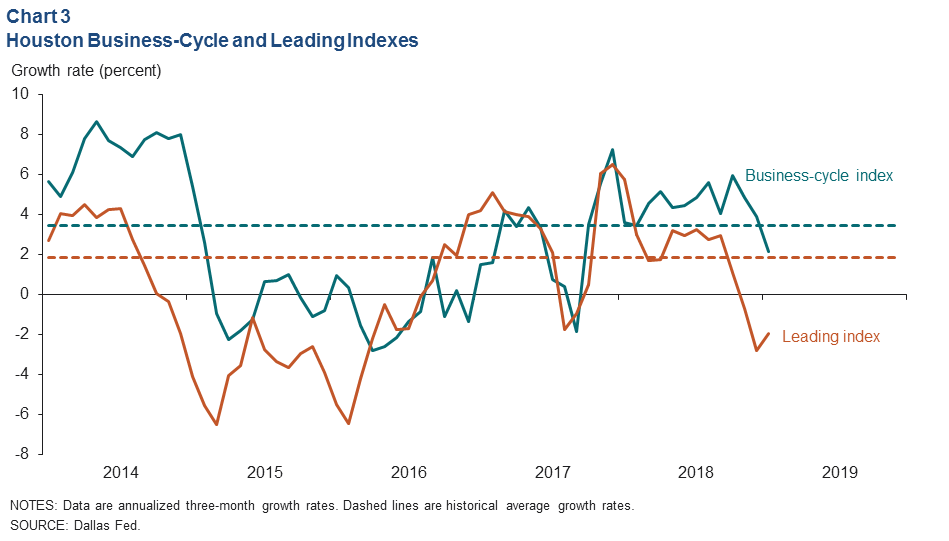
An index of leading indicators for Houston job growth slowed sharply at the end of 2018. Data for the start of the year improved slightly, but the index contracted 2 percent for the three months ending in January. This suggests slower job growth ahead for the first half of 2019.
Deceleration Broad Based Across Components
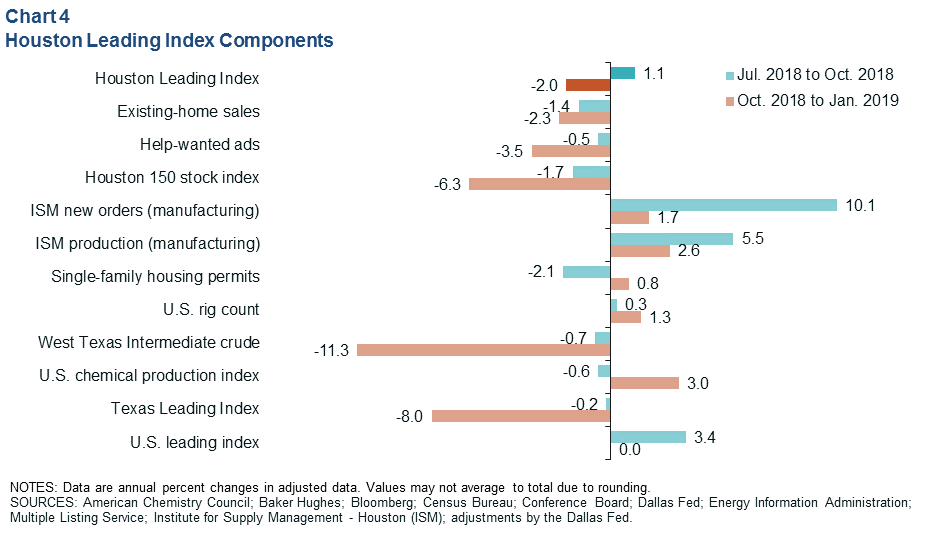
Comparing leading index component performance for the three months ending in Oct. 2018 to the three months ending in Jan. 2019, only three components improved (Chart 4). Single-family housing construction permits shifted from a decline to a rise, growth in the U.S. rig count increased, and the U.S. chemical production index swung from a modest decline to healthy growth. All other components pulled the index downward. The sharpest slowdown among components was crude oil prices followed by new orders for manufacturing—a component of the Houston Purchasing Managers Index.
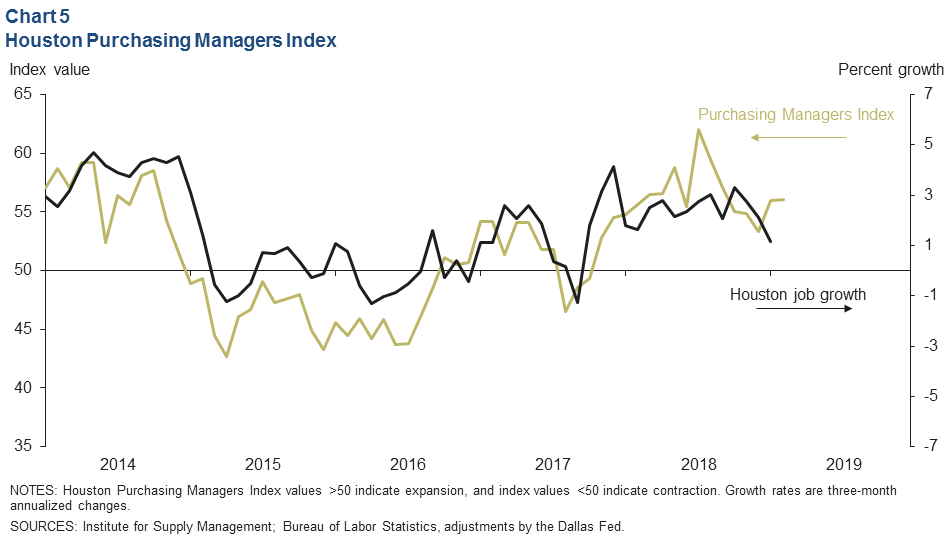
Purchasing Managers Index Points to Growth
The Purchasing Managers Index from the Institute for Supply Management in Houston registered 56.1 in February (Chart 5). The index is highly correlated with job growth in Houston. Any reading above 50 indicates expansion for manufacturing in the region. The February score indicates that the Houston economy continues to expand and that job growth is likely be positive for the next three to four months.
U.S. and Texas Indicators Suggest Fewer Tailwinds from Broader Economy
After growing at an annual rate of 5 percent in the first ten months of 2018, the Conference Board’s U.S. leading index was flat for the fourth consecutive month in January (Chart 6). This suggests a slower U.S. growth outlook in 2019, and indeed, the March 2019 Blue Chip consensus forecast has U.S. GDP growth slowing from 3 percent in 2018 to 2.4 percent this year—still above-trend growth if realized. As Houston’s economy has diversified away from energy since the 1980s, the region’s sensitivity to the broader U.S. economy has increased. Slower U.S. growth should take some of the wind out of Houston’s sails and lead to slower local job growth this year.
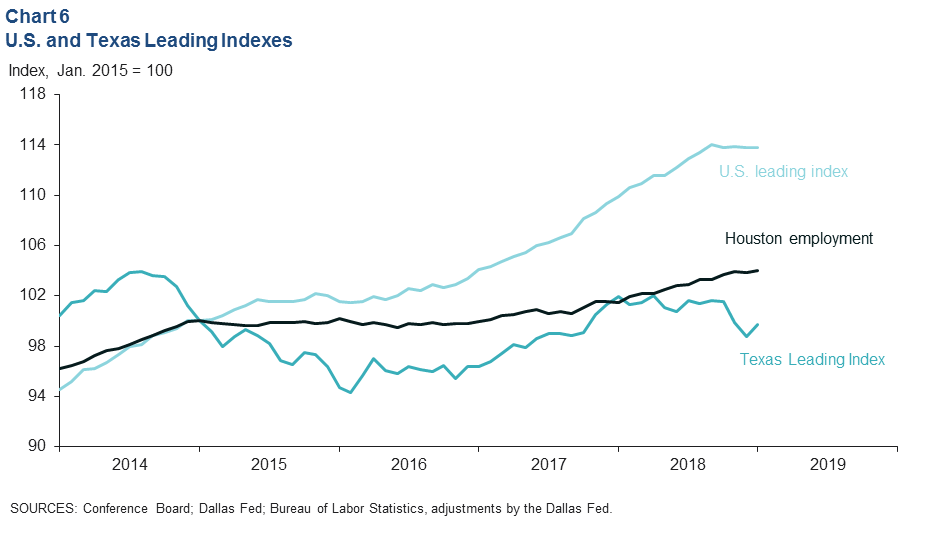
After broad-based declines toward the end of 2018, The Texas Leading Index ticked up in January; this improved the Dallas Fed forecast in March. State employment is projected to grow around 1.5 percent in 2019, down from 2.4 percent in 2018. As Houston accounts for roughly a quarter of state employment, the lower forecast implies slower growth ahead for the region.
NOTE: Data may not match previously published numbers due to revisions.
About Houston Economic Indicators
Questions can be addressed to Jesse Thompson at jesse.thompson@dal.frb.org. Houston Economic Indicators is posted on the second Monday after monthly Houston-area employment data are released.