Houston Economic Indicators

December 5, 2019
Benchmark revisions to second-quarter employment data revealed much weaker job growth in Houston than earlier estimates had suggested. The change brought job growth this year more in line with other leading and coincident data such as the Houston, Texas and U.S. leading indexes as well as the Houston Purchasing Managers Index (PMI). The data point to modest job growth in the region over the next several months.
Employment
Houston added jobs at an annual pace of 2.7 percent over the three months ending in October 2019 (Chart 1). Professional and business services added the most jobs by far (14,900) and was the fastest-growing sector. Growth within that sector was broad based but mainly driven by employment (or staffing) firms and architectural, engineering and related services. Other services (2,200) was the next-fastest-growing sector, followed by manufacturing (2,800). Job losses came mostly from government (1,900) and trade, transportation and utilities (1,400, mostly wholesale durable goods).
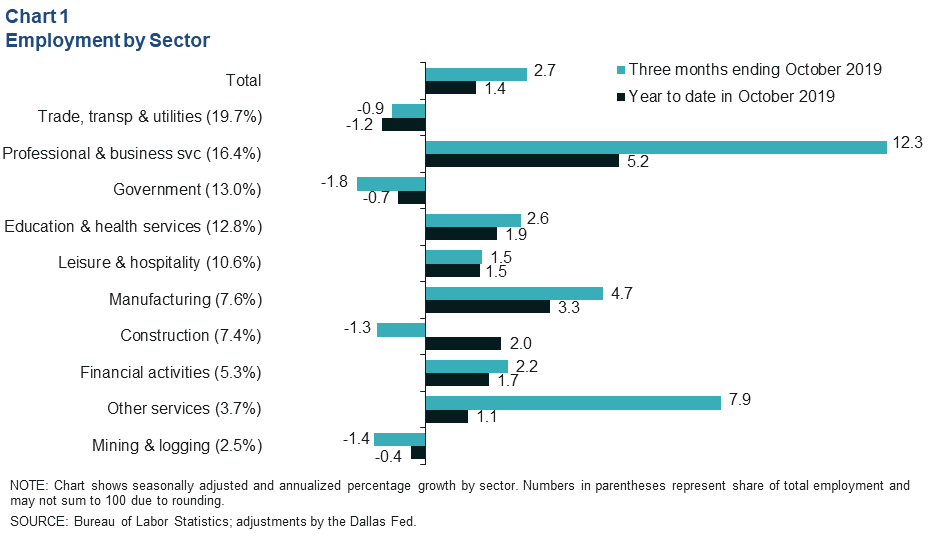
Job growth for the year through October was an annual 1.4 percent (35,200 jobs), down significantly from the growth reported Oct. 30 and below the metro’s historical average rate of 2.1 percent. The lower growth is due to a revision that erased a net 18,200 jobs from the Dallas Fed’s prior benchmark, leaving the latest estimate for Houston payroll jobs 27,400 below the current estimate from the Bureau of Labor Statistics. In 2018, early benchmark revisions gave a more accurate look at local job growth over the year.
The unemployment rate in Houston was 3.7 percent in October. For comparison, the unemployment rate was 3.4 percent in Texas and 3.6 percent in the U.S. as a whole.
Business-Cycle and Purchasing Managers Indexes
Houston Business-Cycle Index Revised Down
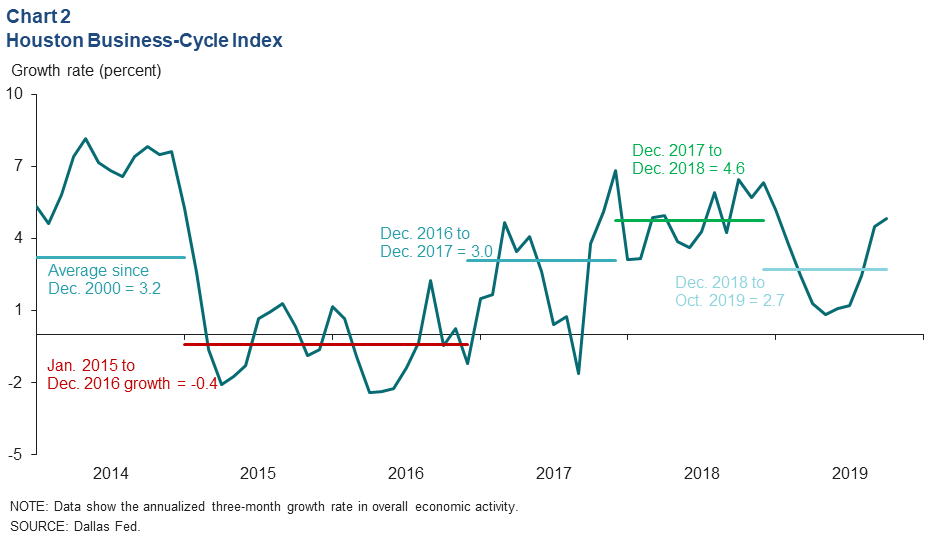
Incorporating revised employment data for the second quarter, the Houston Business-Cycle Index has grown an annual 2.7 percent through October, below its 2000–15 average of about 3.2 percent (Chart 2). This suggests that economic activity has continued to expand this year but at a below-average pace.
Over the three months ending in October, the index accelerated to a 4.8 percent annual growth rate.
Houston PMI Continues to Show Mild Growth
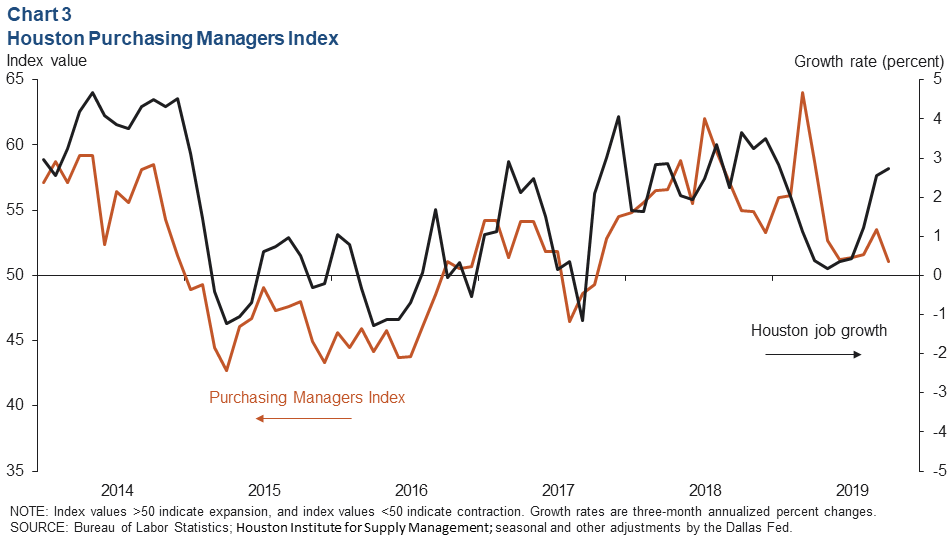
Houston’s PMI registered 51.1 in October, indicating that a slightly higher share of firms reported an increase in business activity than reported a decline (Chart 3). A PMI just above neutral (50) suggests slight expansion in manufacturing and modest job growth in Houston over the next three months. Industries expanding in November included health care, transportation and utilities, and construction. Industries contracting were oil and gas and manufacturing.
Leading Indexes
Revised Job Growth More in Line with Leading Index
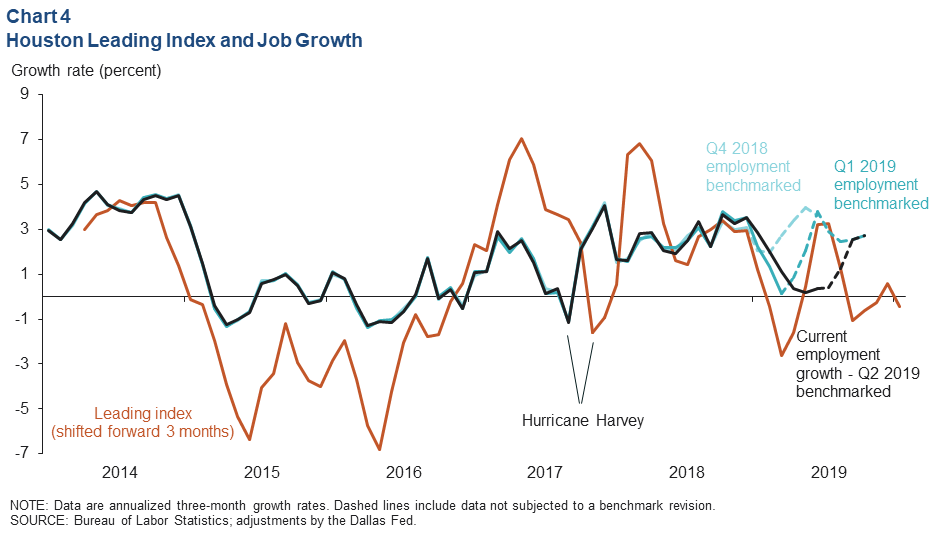
The weaker year-to-date job growth in Houston revealed by benchmark revisions this year is now in closer agreement with other economic barometers like the Houston Leading Index. The index has declined much of the year, resulting in annual growth of only about 0.7 percent year to date, well below its historical average annual rate of 1.8 percent (Chart 4).
Leading Index Components Mixed
An index of 11 leading indicators for Houston contracted at an annual rate of 0.5 percent over the three months ending in October—a slightly shallower rate of decline than in the prior three-month period (Chart 5). A pickup in permits for single-family housing construction, new orders from the Houston PMI, existing-home sales and chemical production offset steepening declines in the U.S. rig count, help-wanted advertising and the Houston 150 stock index.
Combined with recent job growth estimates, the index continues to imply tepid job growth ahead.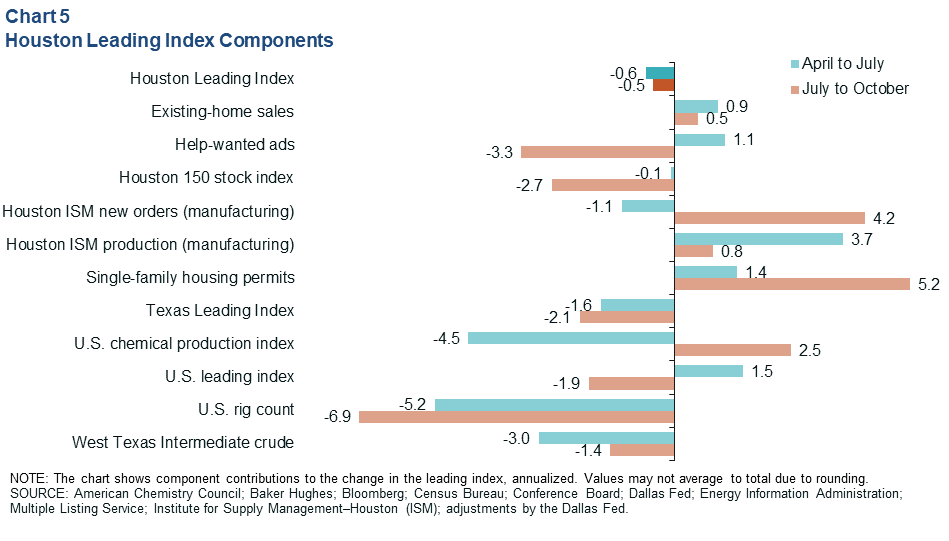
State, National Indexes Point to Moderating Local Outlook
The Texas Leading Index has been drifting down modestly since recovering from a dip at the start of the year (Chart 6). The Dallas Fed recently forecast 2.1 percent job growth for 2019; however, this was before state employment numbers were revised down. Job growth is now likely to come in below that projection.
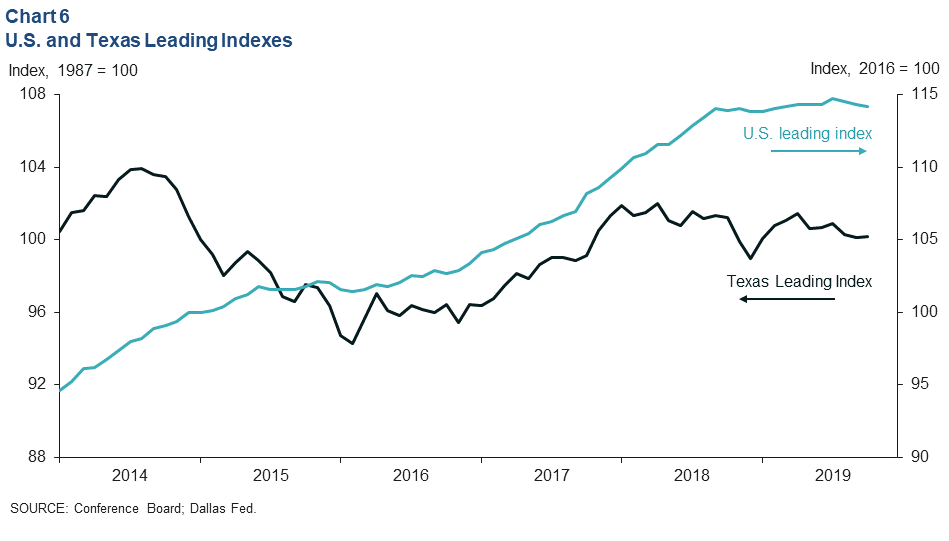
The U.S. leading index—updated by the Conference Board at the end of November—drifted down slightly in the three months ending in October, and the six-month growth rate turned negative for the first time since May 2016. New orders for manufacturing, hours worked and unemployment insurance claims were a drag on the index. The index readings and a softening labor market suggest that “the U.S. economy will end the year … just below 2 percent GDP growth,” reported Ataman Ozyildirim, senior director of economic research at the Conference Board. For context, the Blue Chip consensus forecast in early November was for 2.3 percent GDP growth in 2019.
Weakening indicators for Texas and the broader domestic economy dampen the prospects for any acceleration of Houston job growth into early 2020.NOTE: Data may not match previously published numbers due to revisions.
About Houston Economic Indicators
Questions can be addressed to Jesse Thompson at jesse.thompson@dal.frb.org. Houston Economic Indicators is posted on the second Monday after monthly Houston-area employment data are released.