Houston Economic Indicators

November 4, 2020
Houston’s recovery from the pandemic progressed further in September and October. Houston continued to add jobs in September, and staffing levels in small firms and mobility and engagement improved in October. Existing-home sales have been a bright spot. However, business bankruptcies and vacancy rates for commercial real estate worsened in the third quarter.
Employment
Nearly 41 Percent of Pandemic Job Losses Recovered as Houston Outperforms U.S.
Houston added 143,200 jobs to area payrolls from April to September (Chart 1). Jobs in September grew by 20,500, the largest monthly increase since June. The sector with the largest deficit remaining is leisure and hospitality (mainly restaurants and bars), which is still 57,200 jobs shy of its pre-pandemic level. Trade, transportation and utilities follows with 27,900 positions still not recovered so far.
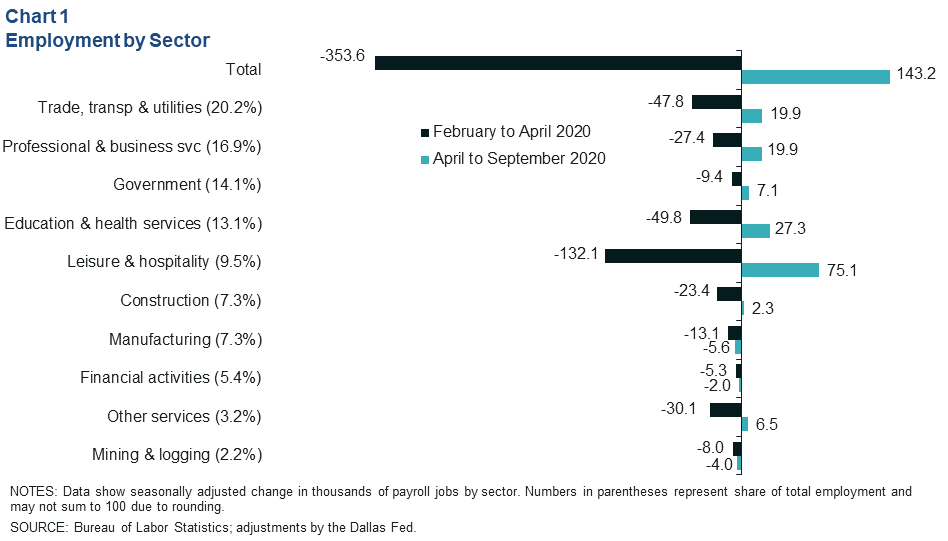
Meanwhile, job losses in mining and manufacturing continued to mount over the summer months but stabilized somewhat by September. Financial activities shed jobs after the initial May-to-July bounce-back, and the sector is down 7,300 jobs relative to pre-pandemic levels, led by losses in the real estate and leasing subsector.
Overall, Houston job growth so far in 2020 is down an annualized 8.5 percent. That’s a smaller decline than the U.S. as a whole at 8.9 percent, but larger than the state, which is down 7.3 percent.
More Hourly Employees Clocking In
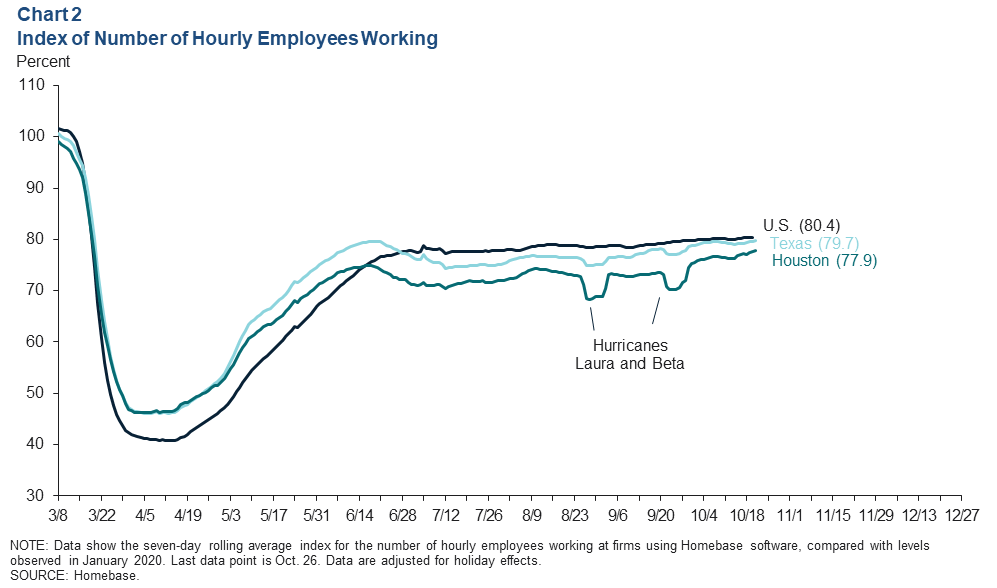
The number of people clocking in to work at mostly small businesses that utilize Homebase software rose to nearly 78 percent of January levels at the end of October, narrowing the gap between Houston, the state and the nation as a whole (Chart 2). Hurricanes Laura and Beta likely contributed to dips in the index at the beginning and end of September.
Mobility and Engagement
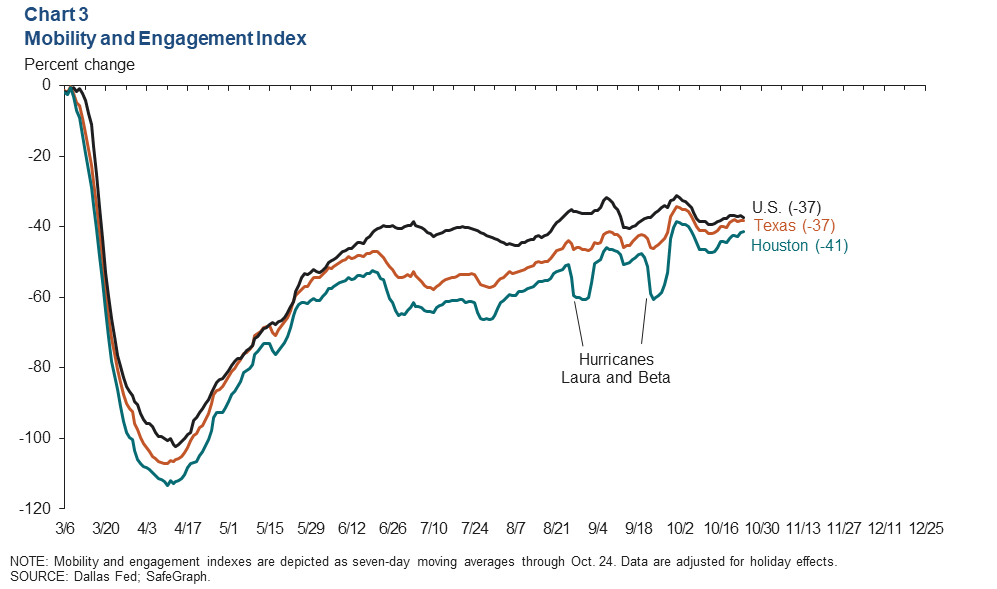
The number of individuals leaving home to engage in economic activity has continued to trend up since mid-summer, albeit with considerable volatility, as measured by mobility and engagement indexes (MEIs). A near record-breaking year for tropical weather saw Hurricanes Laura and Beta disrupt activity in September, driving a lot of the volatility in local MEIs. Similar to trends in Homebase, the gap in mobility between Houston and the U.S. narrowed, with Houston registering a -41 versus -37 nationally on Oct. 24 (Chart 3).
Business Bankruptcies
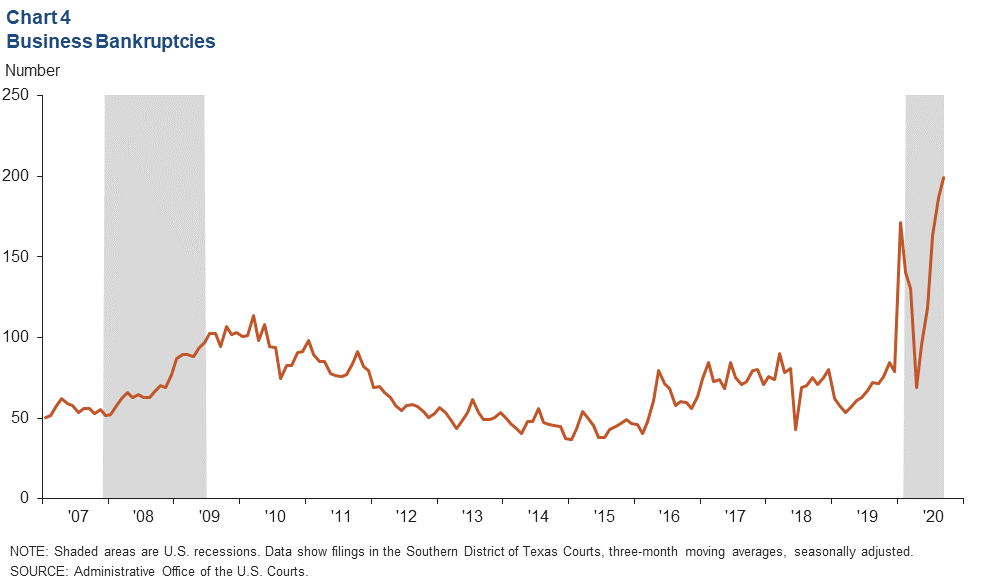
The number of businesses filing for bankruptcy in the southern district of Texas surged in 2020. Bankruptcies typically lag behind aggregate economic activity with elevated levels of bankruptcy filings extending well past the official end of recessions. Filings in the southern district court of Texas (mostly associated with area companies) were already surging prior to the pandemic, likely due to distress in the energy sector. That distress became acute in the pandemic recession as the broader economy suffered.
Over the three months ending in September, the average number of monthly filings was 200 on a seasonally adjusted basis (Chart 4). Since the start of the recession, 1,041 businesses filed. For comparison, 1,399 businesses filed for bankruptcy during the Great Recession, and nearly as many filed in the next year.
Real Estate
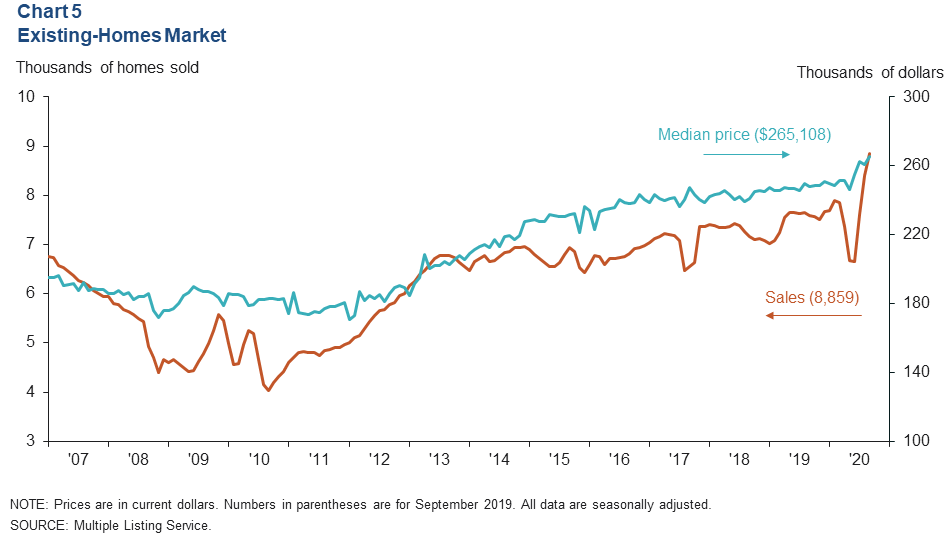
Home Sales Surging
The number of existing homes sold in the Houston region soared in August and September, as pent-up demand from earlier in the pandemic and record-low mortgage rates drove up purchasing. Seasonally adjusted sales were 8,859 in September, and the median price of homes sold rose to $265,108 (Chart 5). The months of inventory (number of homes listed for sale divided by the number of sales) fell to 2.6 in September, the lowest inventory level since the height of the shale boom in 2014.
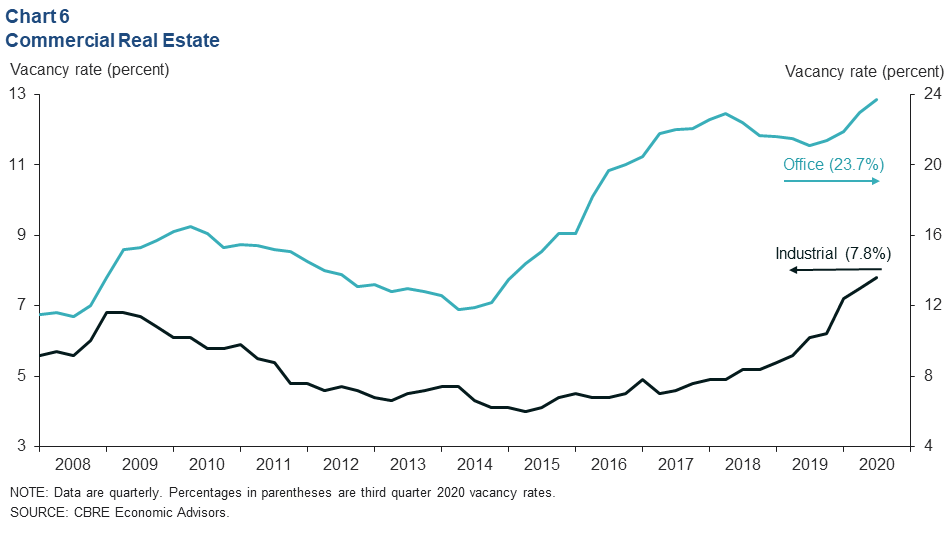
Commercial Vacancy Rate Rising
Vacancy rates for industrial and office space increased in third quarter 2020. Office markets, just beginning to recover from a glut of supply delivered after the 2015–16 shale bust, saw vacancy rates rise to 23.7 percent (Chart 6). That is the highest vacancy rate since the early 1990s. At 7.8 percent, the industrial vacancy rate is also the highest level since first quarter 2005.
NOTE: Data may not match previously published numbers due to revisions.
About Houston Economic Indicators
Questions can be addressed to Jesse Thompson at jesse.thompson@dal.frb.org. Houston Economic Indicators is posted on the second Monday after monthly Houston-area employment data are released.