Houston Economic Indicators

June 14, 2021
The most recent data show continued economic recovery in Houston. In April, payrolls and the labor force increased, unemployment was down, the burden of COVID on the region continued to recede, and mobility moved sideways. Inflation and input prices have picked up. Overall, the outlook remains positive.
Employment
Texas Payrolls Pick Up After State Reopens
Houston metropolitan area payrolls continued to increase in April to 3,012,000—94.5 percent of February 2020 levels—after shifting up in March when the state removed most pandemic restrictions on businesses, and the economy bounced back from Winter Storm Uri (Chart 1). The rest of Texas has continued to outpace the U.S. overall in employment since summer 2020, with payrolls rising to 96.8 percent of February 2020 levels by April.
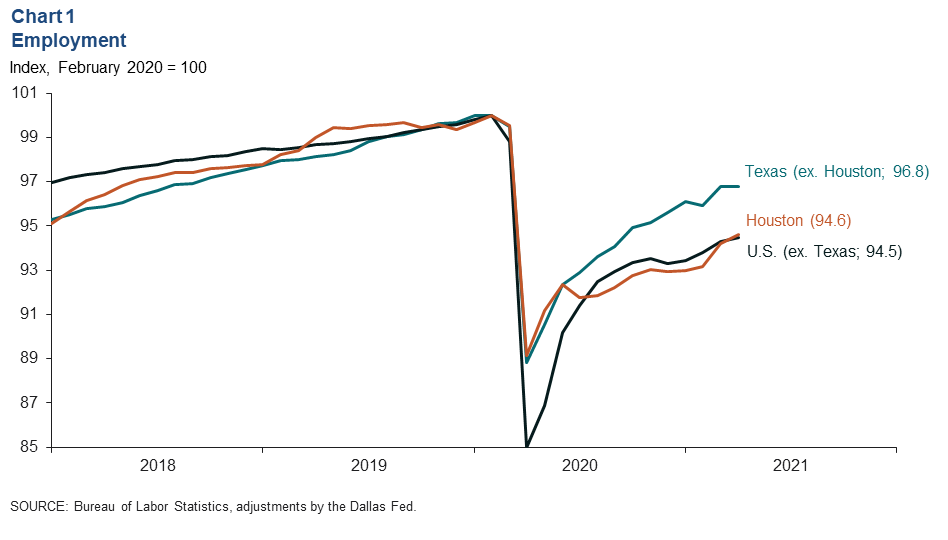
Houston’s unemployment rate fell from 8.1 percent in February to 7.6 percent in April. This occurred amid an increase in the labor force of 44,500—the largest two-month gain since June 2020. Prior to that, only January and February 2010 saw larger increases.
Over Half of Pandemic Job Losses Recovered
Houston added 174,300 jobs in the year since the pandemic decimated the labor market, yielding a net loss of 171,700 jobs (Chart 2). While leisure and hospitality’s bounce-back has been the most robust, it was also the hardest-hit sector during the pandemic. From February 2020 to April 2021, the industry had lost 35,600 jobs on. Trade, transportation and utilities had the smallest job losses of major industry groups with a net decline of 3,300. Financial activities was down 5,500 jobs.
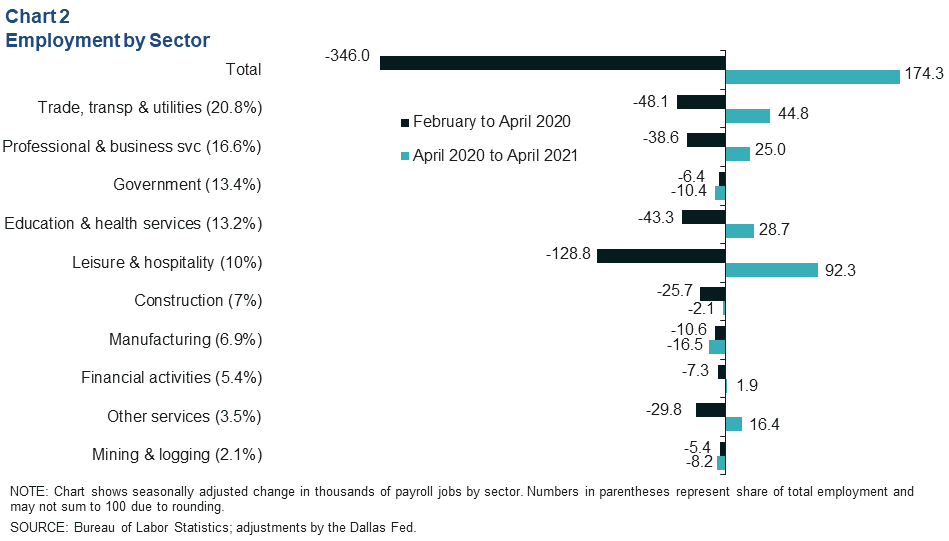
Not all sectors have managed to pare their job losses since April 2020. Construction was down a net 27,800 jobs (particularly, heavy and civil construction), and manufacturing was down 27,100 jobs. Both are influenced by the oil and gas mining sector, which itself was down 13,600 jobs compared to February 2020. Government jobs were down 16,700—mostly in local public educational services.
Local Pandemic and Mobility Data
Houston-Area Pandemic Statistics at 12-Month Low
The average number of hospitalized COVID patients fell to 520 for the seven days ending June 5—its lowest point since May 28, 2020 (Chart 3). Hospitalizations have been trending down steadily since early this year, which suggests that the death count should continue to fall. Daily deaths, which tend to lag changes in hospitalizations, averaged eight people for the seven days ending May 21—the lowest level since Oct. 25, 2020.
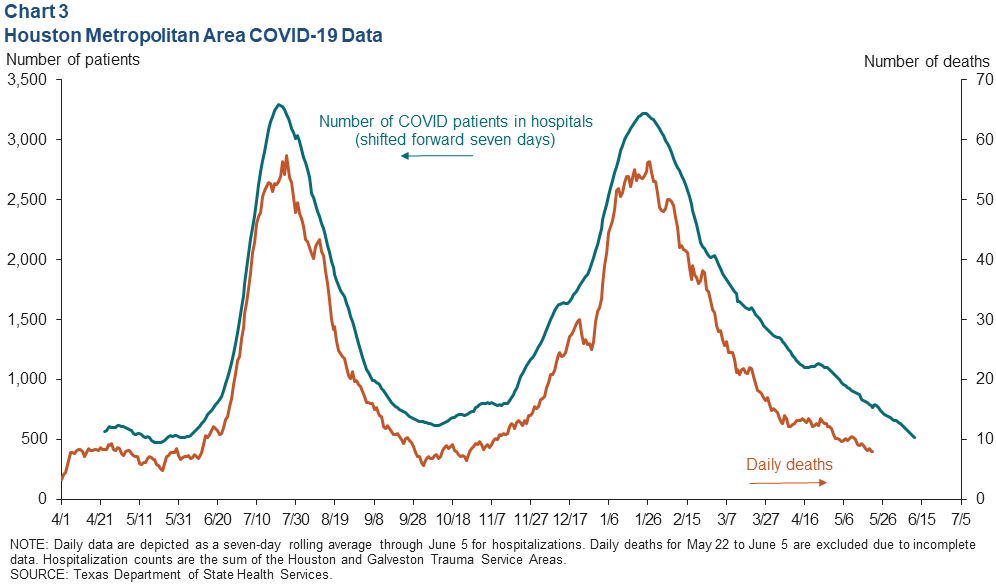
The improvement in hospitalizations and deaths was in part due to the ongoing vaccination effort. By early June, over 55 percent of the population age 12 and older in the metropolitan area had received at least one vaccination—slightly ahead of the state’s rate of 53 percent.
Mobility Indexes Trend Sideways
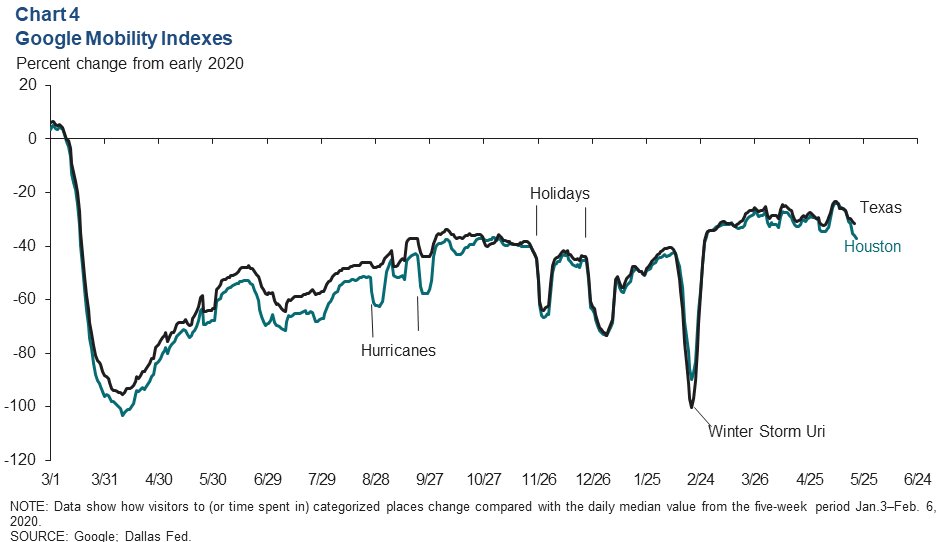
A Google mobility index for the nine-county metro area has been oscillating around a sideways trend since the governor reopened the state in early March (Chart 4). This implies that the pace of recovery for in-person economic activities has slowed.
Inflation and Input Prices
Houston Consumer Price Index Accelerates, Lags Nation
The U.S. Consumer Price Index (CPI) grew at an annual pace of 3.0 percent from February 2020 to May 2021—its highest rate since March 2012. The 15-month view helps to avoid distortions caused by comparing the present to the depths of the pandemic lockdown last year. The comparable Houston CPI accelerated to 2.2 percent growth in April—its highest rate since November 2018 (Chart 5).
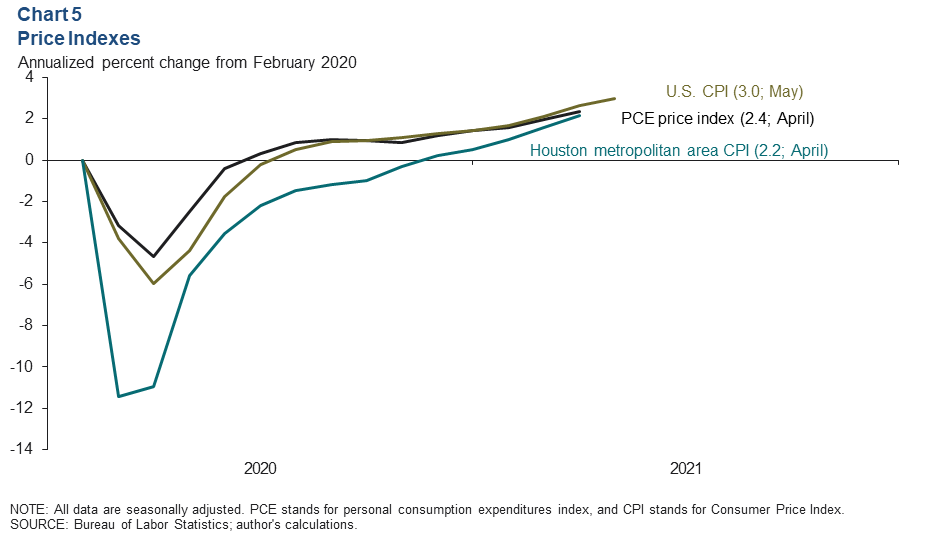
The U.S. personal consumption expenditures (PCE) index—which has several advantages over CPI—accelerated to an annualized 2.4 percent over the 14 months ending in April—its most-rapid pace since April 2012.
To put those annualized paces in perspective, PCE inflation averaged 1.9 percent over the past 20 years. The U.S. CPI and Houston CPI have averaged 2.1 and 2 percent, respectively.
Businesses Feel Price Pressures
Input prices for Texas businesses are rising quickly according to respondents to the Dallas Fed Texas Business Outlook Surveys. The services input price index reached 43.8 in May—a 13-year high. The manufacturing price index for raw materials soared to 79.9—an all-time high (Chart 6).
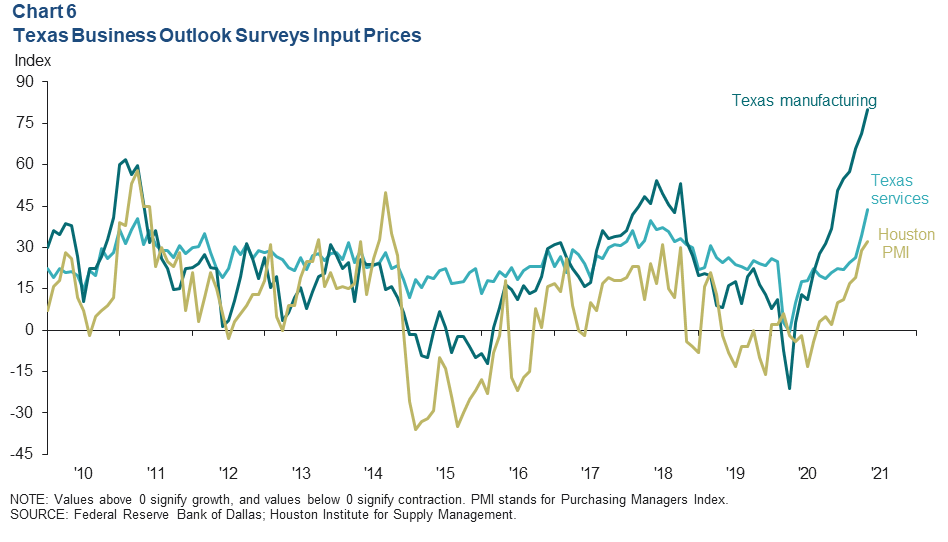
Similarly, in April and May, the U.S. Purchasing Managers Index (PMI) saw price index readings of nearly 90. The Houston PMI prices paid index—the spread between the share of respondents reporting an increase and the share reporting a decrease—rose to 32 in May. This more muted reading likely reflects the higher weight of the oil and gas industry in the Houston region, which has lagged the broader recovery.
NOTE: Data may not match previously published numbers due to revisions.
About Houston Economic Indicators
Questions can be addressed to Jesse Thompson at jesse.thompson@dal.frb.org. Houston Economic Indicators is posted monthly after Houston-area employment data are released.