Permian Basin Economic Indicators

Employment in the Permian Basin increased slightly, while unemployment inched up. Production continued its strong trajectory as the rig count continued to tick up. Retail sales improved drastically in the first half of 2017 compared with the same period in 2016. Housing indicators in the Permian continue to be strong.
Labor Market
Employment in Midland–Odessa grew to 164,200 in November (Chart 1). November’s reading brings year-to-date annualized employment growth to 5.3 percent—an improvement from the 3.2 percent decrease in employment in 2016. The recently released fourth-quarter Dallas Fed Energy Survey pointed to expanding employment and employee hours, but the growth was concentrated in oilfield services firms.
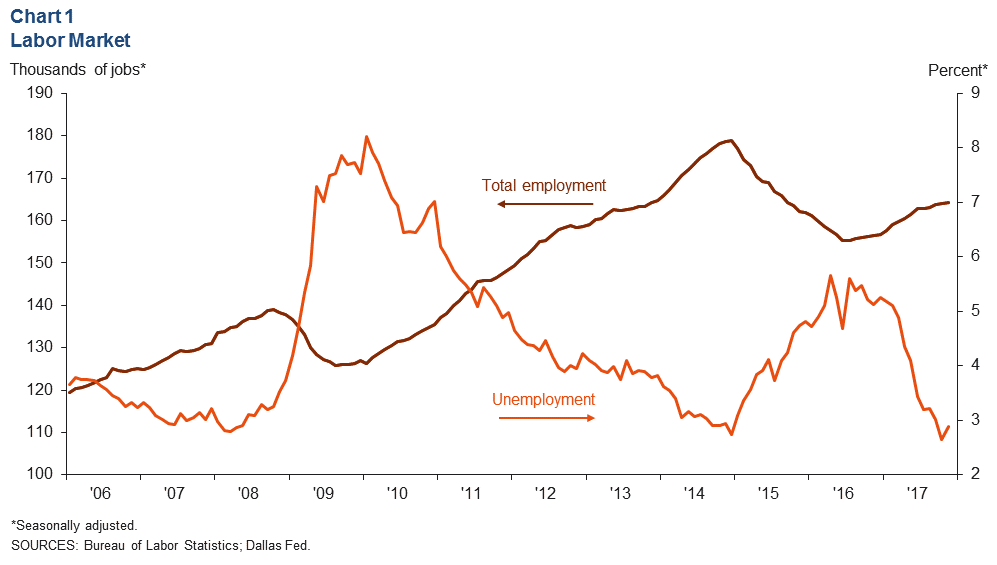
The unemployment rate in the Permian Basin ticked up to 2.9 percent in November. The unemployment rate in Midland–Odessa remains well below the Texas rate of 3.8 percent.
Energy
Oil Production Finishes 2017 Strong, Rig Count Rises
The Permian Basin’s rig count rose slightly to 398 in December, an increase of 10 rigs from November (Chart 2). In total, the rig count grew by 145 during 2017.
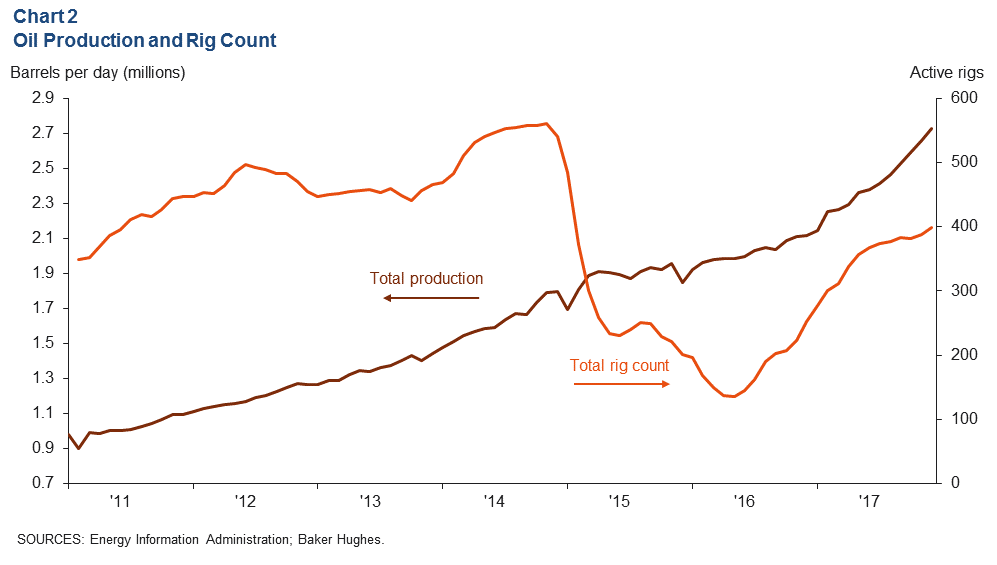
Production increased by about 66,000 barrels per day (b/d) between November and December as production expanded to about 2.73 million b/d. Strong production numbers are in line with the fourth-quarter Dallas Fed Energy Survey, which saw an acceleration from 14.3 to 33.7 in its oil production index. Today, the Permian Basin is producing 29 percent more barrels per day than in December 2016.
Price of West Texas Intermediate Continues to Increase
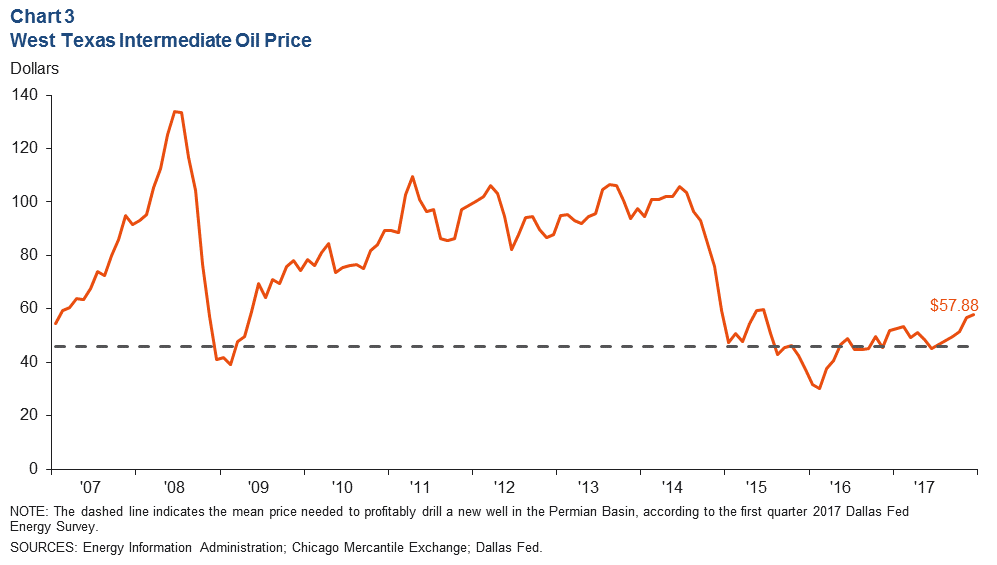
In December, the average price per barrel of West Texas Intermediate (WTI) crude increased to $57.88 from $56.64 in November—beating the average year-end price forecast of $50.20 from the third-quarter Dallas Fed Energy Survey (Chart 3). On average, respondents to the fourth-quarter Dallas Fed Energy Survey forecasted that WTI will end 2018 at $58.98—above the December 2017 average price.
Retail
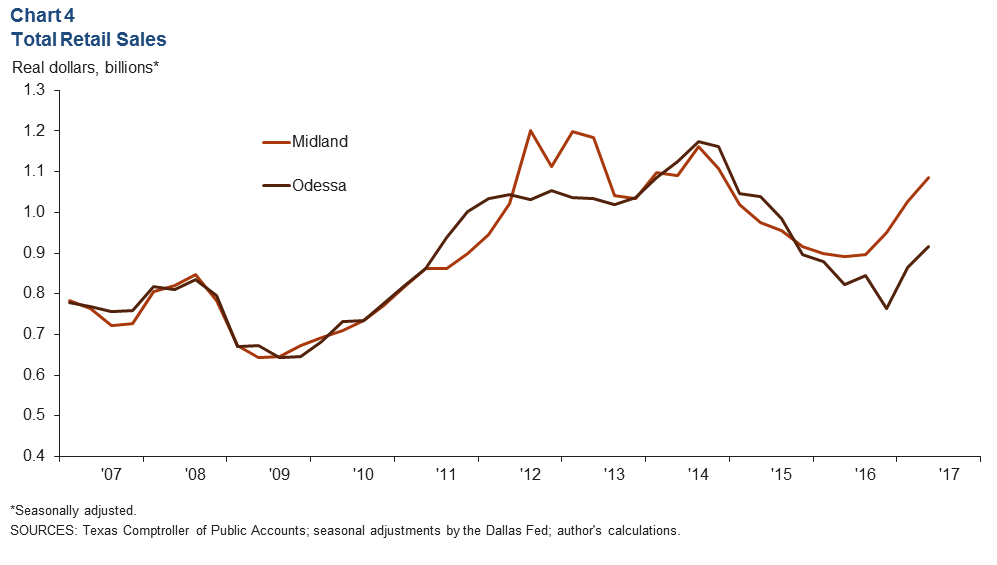
In second quarter 2017 (latest data available), retail sales jumped to just under $1.1 billion in Midland and about $920 million in Odessa (Chart 4). This reflects a 5.7 percent increase in Midland and a 6.1 percent increase in Odessa between the first and second quarter. Retail sales for the first half of 2017 are significantly stronger than the same period in 2016. Strong gains in first- and second-quarter retail sales could reflect rising wages and increased employment in the area since the oil recovery began in late 2016.
Housing
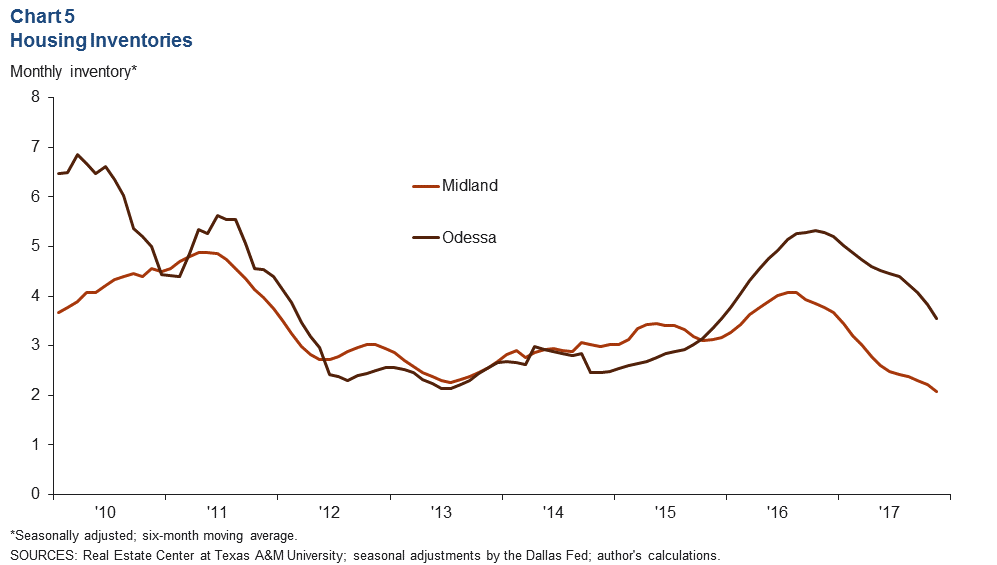
Housing Inventories Fall Further
The Midland–Odessa existing homes’ supply continued to tighten in November (Chart 5). The six-month moving average for months of inventory is just above two months in Midland and about 3.5 months in Odessa. Total listings continue to fall, while existing-home sales are still elevated. Housing inventories have tightened as other aspects of Midland–Odessa’s real economy are improving.
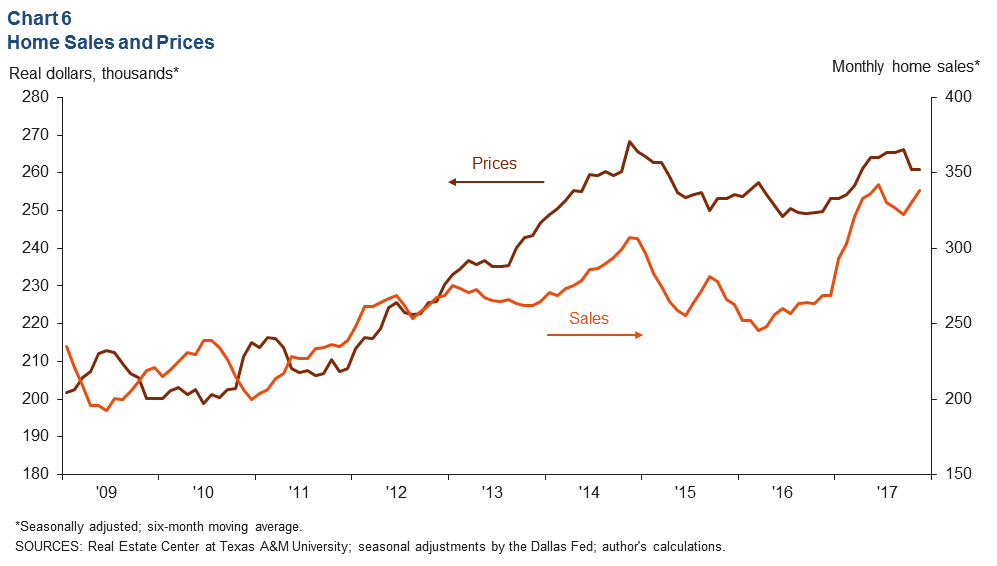
Home Sales Rebound as Prices Remain Stable
Home sales remain elevated in Midland–Odessa as the six-month moving average for total sales of existing homes increased by 2 percent to 339 between October and November (Chart 6). Tightening supply conditions and rising home sales have most likely kept the average price of an existing home in Midland–Odessa elevated. However, the price remained unchanged between October and November at just under $261,000. Prices are up 4.5 percent since December 2016.
NOTES: Data are for the Midland–Odessa metropolitan statistical area (Martin, Midland and Ector counties), except for energy data, which cover the 55 counties in West Texas and southern New Mexico that make up the Permian Basin region. Data may not match previously published numbers due to revisions.
About Permian Basin Economic Indicators
Questions can be addressed to Dylan Szeto at Dylan.Szeto@dal.frb.org. Permian Basin Economic Indicators is released on the third Wednesday of every month.