Dallas Fed Energy Survey

Fourth Quarter | December 28, 2017
Oil and Gas Expansion Accelerates
What's New This Quarter
Special questions this quarter focused on U.S. rig counts and capital spending in 2018, along with price expectations for the longer term (three to five years).
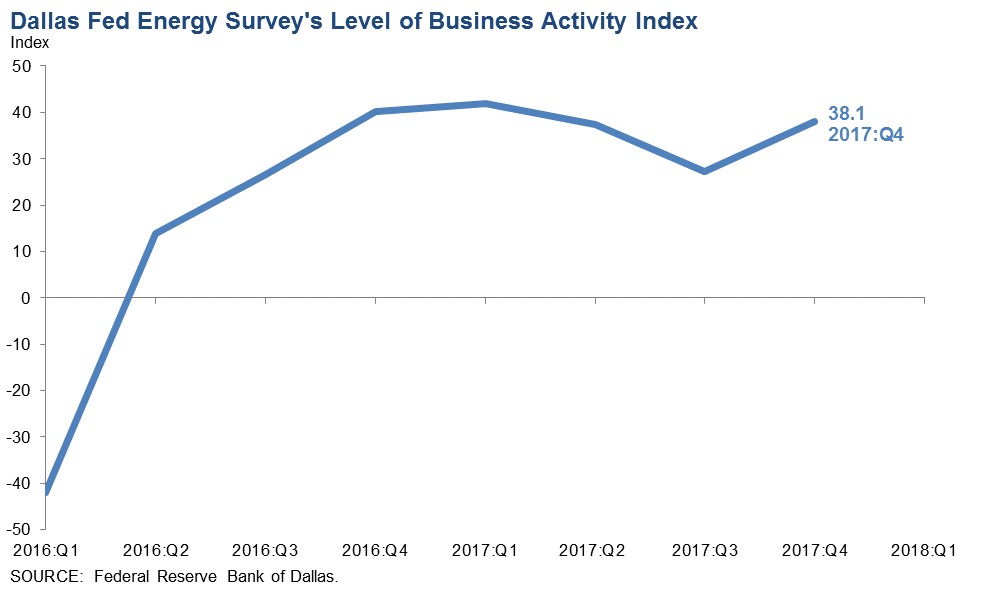
Business activity gained momentum in the fourth quarter, according to oil and gas executives responding to the Dallas Fed Energy Survey. The business activity index—the survey’s broadest measure of conditions facing Eleventh District energy firms—climbed from 27.3 in the third quarter to 38.1 in the fourth, with the increase driven by the exploration and production (E&P) side of the industry.
Positive readings in the survey generally indicate expansion, while readings below zero generally indicate contraction. All indexes in the latest survey reflected expansion on a quarterly basis.
Oil and gas production increased for the fifth quarter in a row, according to executives at E&P firms. The oil production index leaped from 19.3 in the third quarter to 33.7 in the fourth quarter. Likewise, the natural gas production index rose from 17.3 to 26.6. These increases suggest that oil and gas production rose at an accelerated rate.
Utilization of oilfield services firms’ equipment increased at a slightly slower pace than last quarter, with the corresponding index at 29.6, down five points from the third quarter. Measures of selling prices and input costs continued to suggest some pressure on margins for oilfield services firms. The index of prices received for oilfield services remained essentially unchanged at 22.6, while the index of input costs edged up to 30.9.
Labor market indexes continue to point to rising employment and employee hours, with growth in employment primarily driven by oilfield services firms. The employment index rose nine points to 33.4 for services firms while retreating to zero for E&P firms. The employee hours indexes showed a smaller but still sizable gap: 35.8 for services firms versus 20.8 for E&P firms. The aggregate wages and benefits index increased from 18.4 to 25.5, the highest reading since the survey began.
The company outlook index posted a seventh consecutive positive reading and soared more than 20 points to 52.0 in the fourth quarter. The index measuring uncertainty regarding firms’ outlooks declined from 4.9 to -5.3, its first negative reading since the index was introduced in first quarter 2017, which indicates reduced uncertainty. This reduction was particularly prominent among oilfield services firms, where the outlook uncertainty index fell to -14.3.
On average, respondents expect West Texas Intermediate (WTI) oil prices to be $58.98 per barrel by year-end 2018, with responses ranging from $45 to $95 per barrel. Respondents expect Henry Hub natural gas prices to end 2018 at $3.05 per million British thermal unit (MMBtu). For reference, WTI spot prices averaged $57.42 per barrel and Henry Hub spot prices averaged $2.67 per MMBtu during the survey collection period.
Next release: March 28, 2018
Data were collected Dec. 13-21, and 134 energy firms responded to the survey. Of the respondents, 77 were exploration and production firms and 57 were oilfield services firms. The Dallas Fed conducts the Dallas Fed Energy Survey quarterly to obtain a timely assessment of energy activity among oil and gas firms located or headquartered in the Eleventh District. Firms are asked whether business activity, employment, capital expenditures and other indicators increased, decreased or remained unchanged compared with the prior quarter and with the same quarter a year ago. Survey responses are used to calculate an index for each indicator. Each index is calculated by subtracting the percentage of respondents reporting a decrease from the percentage reporting an increase. When the share of firms reporting an increase exceeds the share reporting a decrease, the index will be greater than zero, suggesting the indicator has increased over the previous quarter. If the share of firms reporting a decrease exceeds the share reporting an increase, the index will be below zero, suggesting the indicator has decreased over the previous quarter. |
Fourth Quarter | December 28, 2017
Price Forecasts
West Texas Intermediate Crude
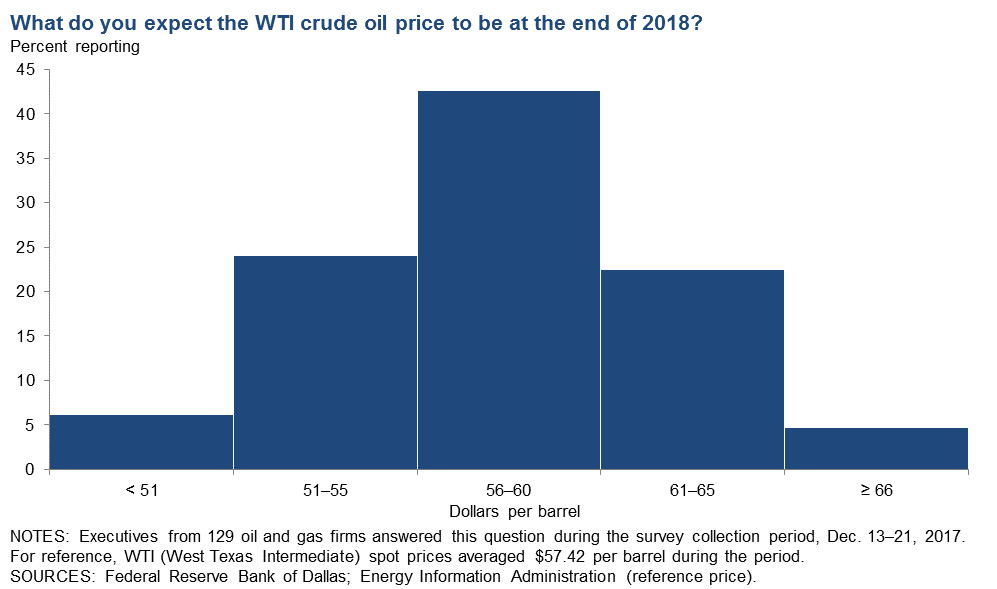
| West Texas Intermediate crude oil price (dollars per barrel), year-end 2018 | ||||
| Indicator | Survey Average | Low Forecast | High Forecast | Price During Survey |
Current quarter | $58.98 | $45.00 | $95.00 | $57.42 |
Prior quarter | N/A | N/A | N/A | N/A |
Henry Hub Natural Gas
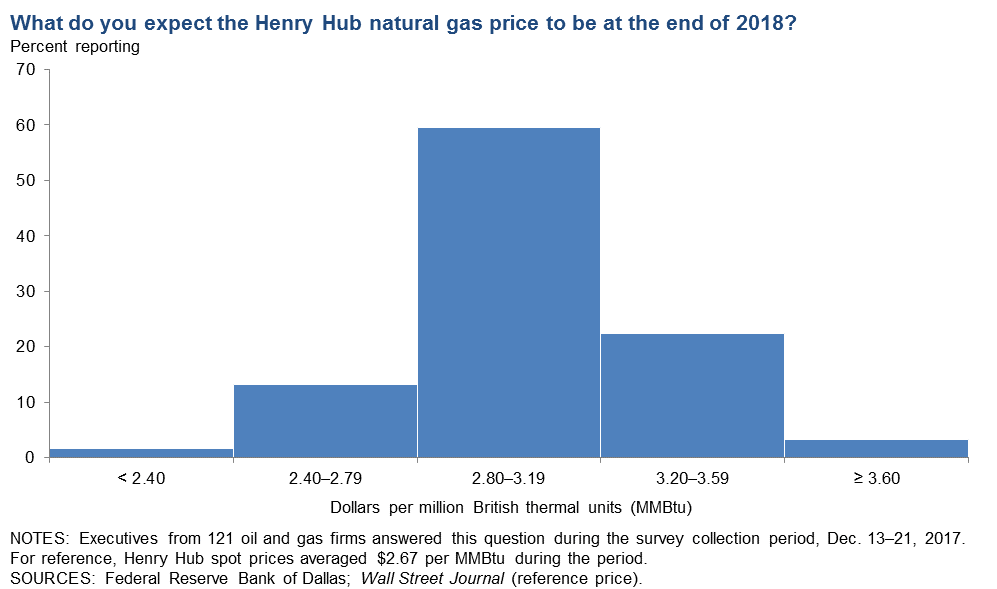
| Henry Hub natural gas price (dollars per MMBtu), year-end 2018 | ||||
| Indicator | Survey Average | Low Forecast | High Forecast | Price During Survey |
Current quarter | $3.05 | $1.95 | $4.50 | $2.67 |
Prior quarter | N/A | N/A | N/A | N/A |
NOTE: Price during survey is an average of daily spot prices during the survey collection period.
SOURCES: Energy Information Administration; Wall Street Journal.
Fourth Quarter | December 28, 2017
Special Questions
Data were collected Dec. 13–21, and 132 oil and gas firms responded to the special questions survey.
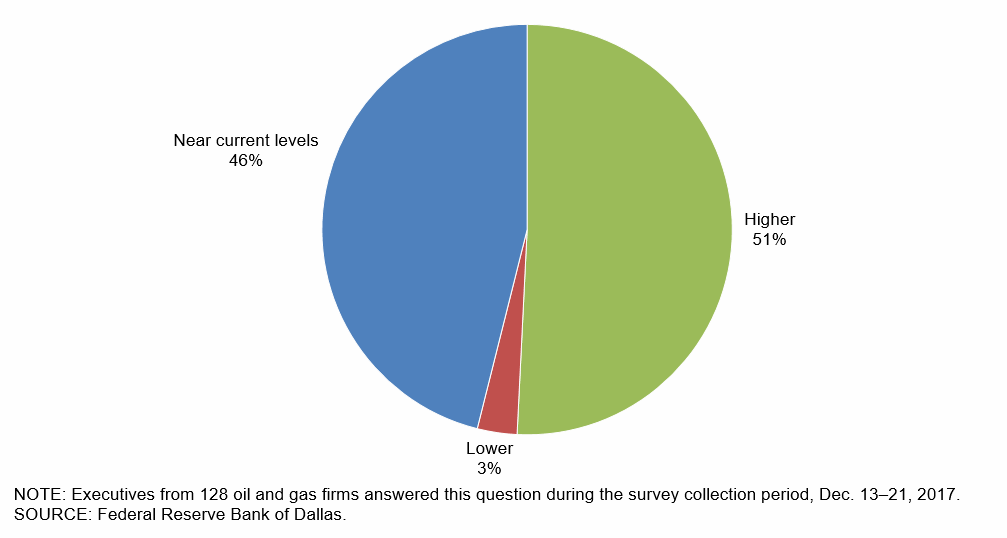
Do you expect the number of U.S. rigs drilling for oil six months from now to be higher, lower or near current levels?
A little more than half of the executives—51 percent—said that they expect the number of U.S. rigs drilling for oil six months from now to be higher than current levels. Forty-six percent noted they anticipate the number of U.S. rigs drilling for oil six months from now to be near current levels. Only three percent of executives said they expect the oil-directed rig count to be lower six months from now.
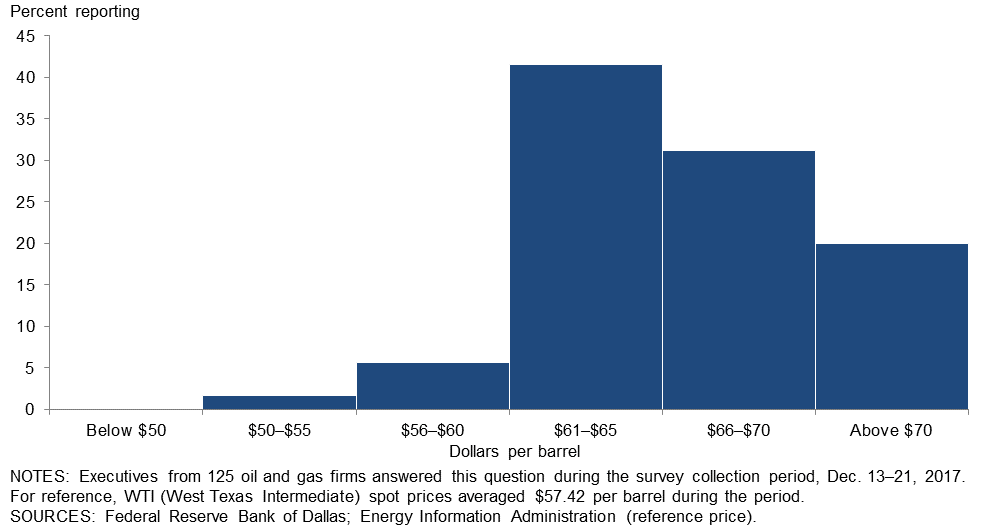
At what West Texas Intermediate (WTI) crude oil price would you expect the U.S. oil rig count to substantially increase?
Forty-two percent of executives expect the U.S. oil rig count to substantially increase if WTI crude oil prices are between $61 per barrel and $65 per barrel. Thirty-one percent of executives expect prices will need to be between $66 per barrel and $70 per barrel to see a substantial increase, while 20 percent of executives believe prices will need to be above $70 per barrel for oil rig counts to substantially increase. Only seven percent of executives believe that prices below $60 are sufficient to generate a substantial increase in the U.S. oil rig count. For reference, WTI spot prices averaged $57.42 per barrel during the survey collection period.
What are your expectations for your firm’s capital spending in 2018 versus 2017?
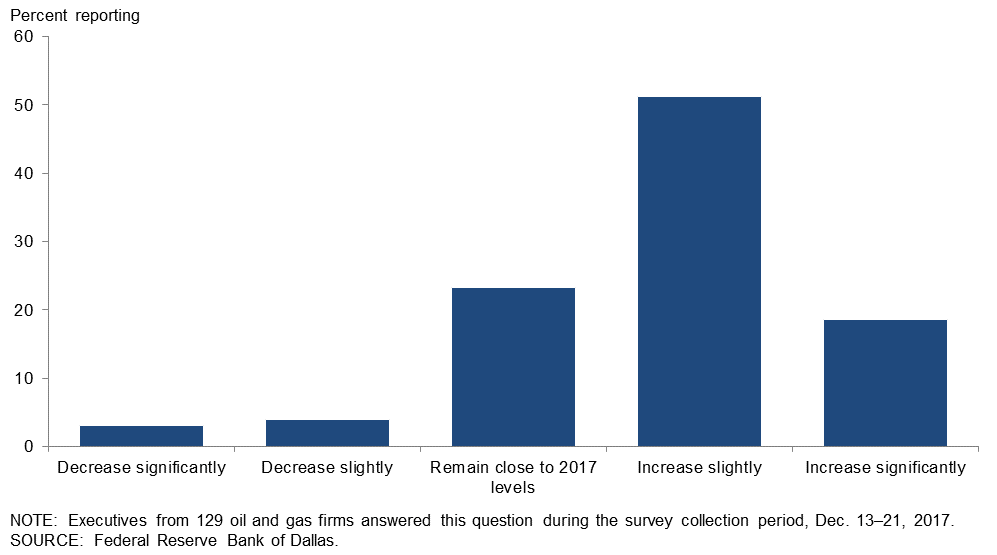
Just over half of the executives—51 percent—said that they expect their firm’s capital spending will slightly increase in 2018 compared with 2017. Nineteen percent expect significant increases, while 23 percent expect spending to be near 2017 levels for 2018. Only seven percent expect to lower spending in 2018 compared with 2017.
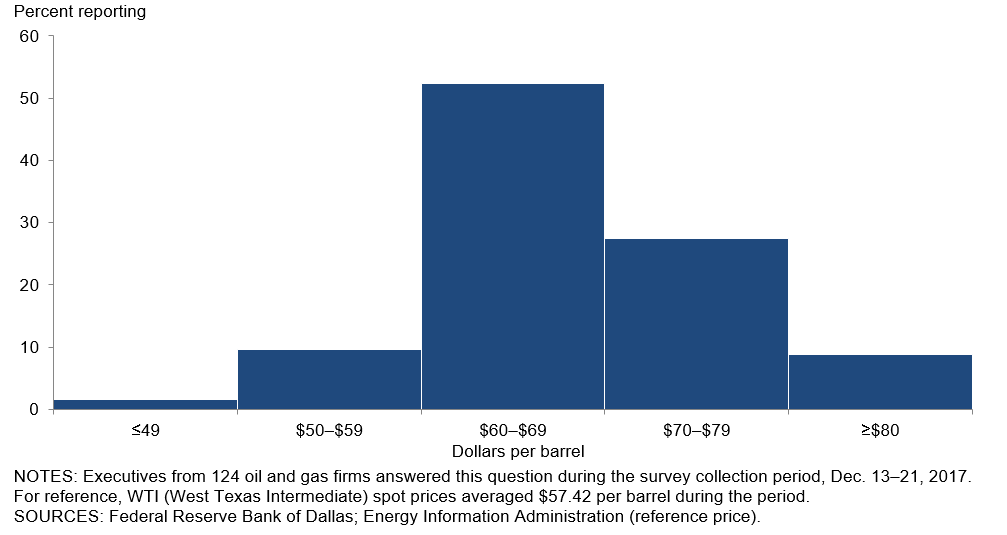
What do you expect the West Texas Intermediate crude oil price to be in the longer term (three to five years from now)?
For this special question, executives were asked to provide a specific price for WTI crude oil expected in the longer term (three to five years from now). Expectations centered around $60–$69 per barrel, with the average response across all executives being $66.16 per barrel and a median of $65 per barrel. The most frequent response was $60 per barrel, followed by $65 and $70. Only 11 percent of responses were under $60.
Compared with price expectations for year-end 2018, the longer term had a higher average ($66.16 versus $58.98), and there was more variation in the responses (standard deviation of $9.14 versus $5.76). For reference, WTI spot prices averaged $57.42 per barrel during the survey collection period.
| Year-end 2018 | Three to Five Years | |
| Average | $58.98 | $66.16 |
| Median | $58.00 | $65.00 |
| Range | $45–$95 | $40–$100 |
| Standard Deviation | $5.76 | $9.14 |
NOTE: Please refer to the year-end 2018 and three-to-five year price expectation charts for details. |
||
Special Questions Comments
Exploration and Production Firms
- The oil industry in the lower 48 states appears to be in the “Goldilocks stage”—not too strong, not too soft, just right—which incents everyone to be efficient.
- We believe that the worldwide natural field decline of 5 to 6 percent per year will not be offset by new discoveries or U.S. shale production in the three- to five-year time frame. This belief is driving our expectation of higher oil prices in the early 2020s.
- We are in acquisition mode and, if successful in buying some properties, will be adding staff and increasing spending to enhance production on those properties.
- The ethereal nature of demand is the most important issue we’re currently facing. If perceived demand continues to increase, then prices could move higher. Worldwide economic improvement creates a reason for optimism in higher crude prices. Natural gas, on the other hand, is stuck in a rut for a very long time.
- Electric transportation vehicles and electric rail will drastically decrease the demand for crude oil in the longer term (20 years).
Oil and Gas Support Services Firms
- I expect the average WTI crude oil price to remain in the $50- to $60-per-barrel range over the next five years but with higher volatility due to the diminished ability of Saudi Arabia to act as swing producer. I believe we may experience $100 and $30 per barrel again over that time frame.
- Finding the new “norm,” be it $55 or $65 per barrel, is necessary for our customers to sustain both drilling rigs and necessary maintenance to production facilities.
Fourth Quarter | December 28, 2017
Historical data are available from first quarter 2016 to the most current release quarter.
Business Indicators: Quarter/Quarter
| Business Indicators: All Firms Current Quarter (versus previous quarter) | |||||
| Indicator | Current Index | Previous Index | % Reporting Increase | % Reporting No Change | % Reporting Decrease |
Level of Business Activity | 38.1 | 27.3 | 47.8 | 42.5 | 9.7 |
Capital Expenditures | 40.3 | 21.8 | 47.8 | 44.8 | 7.5 |
Supplier Delivery Time | 8.6 | 12.3 | 15.6 | 77.3 | 7.0 |
Employment | 14.2 | 14.0 | 24.6 | 64.9 | 10.4 |
Employee Hours | 27.1 | 16.9 | 34.6 | 57.9 | 7.5 |
Wages and Benefits | 25.5 | 18.4 | 30.8 | 63.9 | 5.3 |
| Indicator | Current Index | Previous Index | % Reporting Improved | % Reporting No Change | % Reporting Worsened |
Company Outlook | 52.0 | 28.2 | 56.7 | 38.6 | 4.7 |
| Indicator | Current Index | Previous Index | % Reporting Increase | % Reporting No Change | % Reporting Decrease |
Uncertainty | –5.3 | 4.9 | 18.9 | 56.8 | 24.2 |
| Business Indicators: E&P Firms Current Quarter (versus previous quarter) | |||||
| Indicator | Current Index | Previous Index | % Reporting Increase | % Reporting No Change | % Reporting Decrease |
Level of Business Activity | 36.4 | 15.4 | 46.8 | 42.9 | 10.4 |
Oil Production | 33.7 | 19.3 | 50.6 | 32.5 | 16.9 |
Natural Gas Wellhead Production | 26.6 | 17.3 | 41.3 | 44.0 | 14.7 |
Capital Expenditures | 44.1 | 16.9 | 53.2 | 37.7 | 9.1 |
Expected Level of Capital Expenditures Next Year | 44.7 | 27.3 | 52.6 | 39.5 | 7.9 |
Supplier Delivery Time | 2.7 | 12.2 | 12.3 | 78.1 | 9.6 |
Employment | 0.0 | 5.2 | 13.0 | 74.0 | 13.0 |
Employee Hours | 20.8 | 3.9 | 28.6 | 63.6 | 7.8 |
Wages and Benefits | 27.3 | 10.2 | 31.2 | 64.9 | 3.9 |
Finding and Development Costs | 22.4 | 23.7 | 31.6 | 59.2 | 9.2 |
Lease Operating Expenses | 25.7 | 15.6 | 31.1 | 63.5 | 5.4 |
| Indicator | Current Index | Previous Index | % Reporting Improved | % Reporting No Change | % Reporting Worsened |
Company Outlook | 48.6 | 27.0 | 52.8 | 43.1 | 4.2 |
| Indicator | Current Index | Previous Index | % Reporting Increase | % Reporting No Change | % Reporting Decrease |
Uncertainty | 1.4 | 6.5 | 21.1 | 59.2 | 19.7 |
| Business Indicators: O&G Support Services Firms Current Quarter (versus previous quarter) | |||||
| Indicator | Current Index | Previous Index | % Reporting Increase | % Reporting No Change | % Reporting Decrease |
Level of Business Activity | 40.3 | 41.6 | 49.1 | 42.1 | 8.8 |
Utilization of Equipment | 29.6 | 34.4 | 38.9 | 51.9 | 9.3 |
Capital Expenditures | 35.1 | 27.7 | 40.4 | 54.4 | 5.3 |
Supplier Delivery Time | 16.4 | 12.5 | 20.0 | 76.4 | 3.6 |
Lag Time in Delivery of Firm's Services | 11.1 | 11.3 | 14.8 | 81.5 | 3.7 |
Employment | 33.4 | 24.6 | 40.4 | 52.6 | 7.0 |
Employment Hours | 35.8 | 32.3 | 42.9 | 50.0 | 7.1 |
Wages and Benefits | 23.3 | 28.1 | 30.4 | 62.5 | 7.1 |
Input Costs | 30.9 | 28.5 | 34.5 | 61.8 | 3.6 |
Prices Received for Services | 22.6 | 22.5 | 26.4 | 69.8 | 3.8 |
| Indicator | Current Index | Previous Index | % Reporting Improved | % Reporting No Change | % Reporting Worsened |
Company Outlook | 56.3 | 29.5 | 61.8 | 32.7 | 5.5 |
| Indicator | Current Index | Previous Index | % Reporting Increase | % Reporting No Change | % Reporting Decrease |
Uncertainty | –14.3 | 3.1 | 16.1 | 53.6 | 30.4 |
Business Indicators: Year/Year
| Business Indicators: All Firms Current Quarter (versus same quarter a year ago) | |||||
| Indicator | Current Index | Previous Index | % Reporting Increase | % Reporting No Change | % Reporting Decrease |
Level of Business Activity | 54.0 | 47.4 | 66.9 | 20.2 | 12.9 |
Capital Expenditures | 54.0 | 41.3 | 63.7 | 26.6 | 9.7 |
Supplier Delivery Time | 19.0 | 17.8 | 25.9 | 67.2 | 6.9 |
Employment | 21.3 | 20.1 | 36.1 | 49.2 | 14.8 |
Employee Hours | 33.0 | 25.0 | 42.7 | 47.6 | 9.7 |
Wages and Benefits | 40.6 | 28.1 | 46.3 | 48.0 | 5.7 |
| Indicator | Current Index | Previous Index | % Reporting Improved | % Reporting No Change | % Reporting Worsened |
Company Outlook | 65.8 | 40.9 | 71.8 | 22.2 | 6.0 |
| Business Indicators: E&P Firms Current Quarter (versus same quarter a year ago) | |||||
| Indicator | Current Index | Previous Index | % Reporting Increase | % Reporting No Change | % Reporting Decrease |
Level of Business Activity | 48.5 | 40.2 | 61.4 | 25.7 | 12.9 |
Oil Production | 38.6 | 16.6 | 60.0 | 18.6 | 21.4 |
Natural Gas Wellhead Production | 30.5 | 22.9 | 49.3 | 31.9 | 18.8 |
Capital Expenditures | 55.7 | 37.2 | 64.3 | 27.1 | 8.6 |
Expected Level of Capital Expenditures Next Year | 40.6 | 18.6 | 52.2 | 36.2 | 11.6 |
Supplier Delivery Time | 12.5 | 20.3 | 20.3 | 71.9 | 7.8 |
Employment | 3.0 | 5.5 | 22.1 | 58.8 | 19.1 |
Employee Hours | 22.9 | 5.6 | 32.9 | 57.1 | 10.0 |
Wages and Benefits | 36.3 | 20.9 | 43.5 | 49.3 | 7.2 |
Finding and Development Costs | 30.5 | 25.7 | 43.5 | 43.5 | 13.0 |
Lease Operating Expenses | 30.8 | 19.4 | 42.6 | 45.6 | 11.8 |
| Indicator | Current Index | Previous Index | % Reporting Improved | % Reporting No Change | % Reporting Worsened |
Company Outlook | 64.2 | 30.9 | 68.7 | 26.9 | 4.5 |
| Business Indicators: O&G Support Services Firms Current Quarter (versus same quarter a year ago) | |||||
| Indicator | Current Index | Previous Index | % Reporting Increase | % Reporting No Change | % Reporting Decrease |
Level of Business Activity | 61.1 | 55.8 | 74.1 | 13.0 | 13.0 |
Utilization of Equipment | 55.8 | 56.7 | 67.3 | 21.2 | 11.5 |
Capital Expenditures | 51.9 | 45.9 | 63.0 | 25.9 | 11.1 |
Supplier Delivery Time | 26.9 | 15.0 | 32.7 | 61.5 | 5.8 |
Lag Time in Delivery of Firm's Services | 16.0 | 12.3 | 26.0 | 64.0 | 10.0 |
Employment | 44.4 | 37.7 | 53.7 | 37.0 | 9.3 |
Employment Hours | 46.3 | 47.5 | 55.6 | 35.2 | 9.3 |
Wages and Benefits | 46.3 | 36.6 | 50.0 | 46.3 | 3.7 |
Input Costs | 46.1 | 48.3 | 51.9 | 42.3 | 5.8 |
Prices Received for Services | 44.0 | 27.1 | 52.0 | 40.0 | 8.0 |
| Indicator | Current Index | Previous Index | % Reporting Improved | % Reporting No Change | % Reporting Worsened |
Company Outlook | 68.0 | 53.9 | 76.0 | 16.0 | 8.0 |
Fourth Quarter | December 28, 2017
Activity Chart
Fourth Quarter | December 28, 2017
Comments from Survey Respondents
These comments are from respondents’ completed surveys and have been edited for publication. Comments from the Special Questions survey can be found below the special questions.
Exploration and Production Firms
- We still believe that $60 per barrel is the tipping point for substantial increases in domestic drilling activity. If backwardation continues and spot prices exceed $60 per barrel, then, in our opinion, prices will drop substantially and return to "lower for longer.”
- The worst appears to be over—at least for the time being.
- We are planning a significant increase in drilling in 2018 compared to 2017.
- Factor costs are rising at the same pace as crude oil prices, and we now expect both oil prices and service costs to remain relatively flat. Wage pressure on skilled laborers will put more upward pressure on costs to service companies and thus on the prices vendors charge operators to frack, drill, cement and produce wells.
- Our outlook for commodity prices is more positive than last quarter, but we are seeing rising costs and, in particular, lengthening lead times from suppliers. It looks like inability to get equipment to drill sites in a timely manner is going to be a bit of a problem for us in 2018.
- As crude prices inch up, I grow more optimistic for the upcoming year.
- Regulatory responses to Oklahoma earthquakes continue to hammer earnings due to lawsuits, mandatory saltwater disposal, well pluggings, curtailments and reduced upstream production. These factors have forced the sale of producing properties at distressed prices. Oil and gas pricing problems are being felt now in the Permian Basin, where there is too much gas for too little infrastructure. The world market is seeing that a barrel of oil is not like every other barrel of oil; quality and American Petroleum Institute (API) gravity issues are finally sinking in with buyers.
- As with last year, many regional and political issues have the potential to significantly escalate market pricing of oil and gas. Those issues can affect market pricing without reference to the conventional measurements of supply and demand or “balancing” of supply and demand. Assuming that one or more of those issues is not further escalated, it seems appropriate to expect moderate increases in both oil and gas prices during 2018, at a rate slightly above the basic inflation rate.
- Commodity price stability in a decent price range is facilitating our ability to finance capital programs and hedge prudently, which in turn has made it easier to support longer-term capital programs and hiring for growth.
- The administration is making a big difference with its pro-business rather than pro-regulation attitude. It is also selling America to the global community like no previous administration. The administration is also creating a tax code that is supportive of work and against government. Our system has changed from government for the people to people for the government.
- I sense that a floor for West Texas Intermediate (WTI) crude oil prices is developing around $60 per barrel.
- Small independent operators will have difficulty securing certain services from major service providers due to service providers’ focus on large-scale unconventional programs. The limited number of experienced service providers will cause difficulty in getting vertical work accomplished efficiently.
- We have a couple of new projects that are creating the increased activity. However, we see new activity throughout the Permian Basin.
- We see the WTI crude oil price fluctuating between $45 and $60 per barrel in 2018.
- The current price of natural gas does not justify exploration and production. A higher oil price is needed to justify conventional exploration.
- We expect to significantly increase our operations in 2018.
Oil and Gas Support Services Firms
- The real economics of a lot of the Wolfcamp/Wolfberry Midland Basin are beginning to show through. Investors are now asking, “Where is the beef?” Returns are not coming in as forecasted, and reserves will prove to have been overestimated. Declines will make it virtually impossible to establish significant free cash flows because maintaining a consistent level of production requires new drilling to make up for declines. The resources are there to be exploited, but I feel that if some type of pressure maintenance or pressure enhancement projects are not implemented soon, millions of barrels of oil will be left in the ground and a lot of people will lose a lot of money.
- We expect activity to increase well into 2018, albeit at a modest pace compared to the rate of change in the first half of 2017 over 2016.
- Our prospects for 2018 appear to be improving.
- Hiring qualified personnel, especially commercially licensed oilfield drivers, has become increasingly difficult and more expensive. Rates for our services are still depressed in most areas of our service, but in the coming months we are looking to negotiate higher rates in all plays where we are currently active: the Eagle Ford Shale, Barnett Shale and Permian Basin.
- Business continues to strengthen, and prices have improved quarter over quarter.
- Sentiment has improved over the second half of 2017, and the outlook for fiscal year 2018 is better than it was a quarter ago.
- We are flat quarter over quarter in all respects except costs.
- Not that it was ever easy, but predicting the price of oil in 2018 is much harder for a number of reasons. Storage numbers have dropped worldwide, but I have not seen that reported for the U.S. Economies worldwide are improving, which should increase demand for oil. Pressure on producers by “investors” (mostly stockholders) in the oil business for returns on their “investments” may have a downward effect on supply as producers spend less money on new wells. Acreage prices continue to be outlandish, and there is no way all these expensive leases can be drilled before their primary terms expire. High acreage prices lower the return on investment for a new well, which may put more pressure on producers to curtail drilling. In short, there are so many variables that I have no idea what oil will do in 2018.
- It is certainly looking better as West Texas operations are at full tilt. East Texas is starting to wake up.
Questions regarding the Dallas Fed Energy Survey can be addressed to Michael Plante at Michael.Plante@dal.frb.org or Kunal Patel at Kunal.Patel@dal.frb.org.
Sign up for our email alert to be automatically notified as soon as the latest Dallas Fed Energy Survey is released on the web.