Permian Basin Economic Indicators

Job growth has softened in the Permian Basin as drilling activity has slowed. The rig count has fallen, while oil output continues to rise. Housing prices have soared as supply remains limited.
Labor Market
Payrolls Dip
Employment levels in the Permian Basin have inched down after peaking in January (Chart 1). Through April, payrolls have contracted by 2,300, with the mining, logging and construction sector leading the losses.
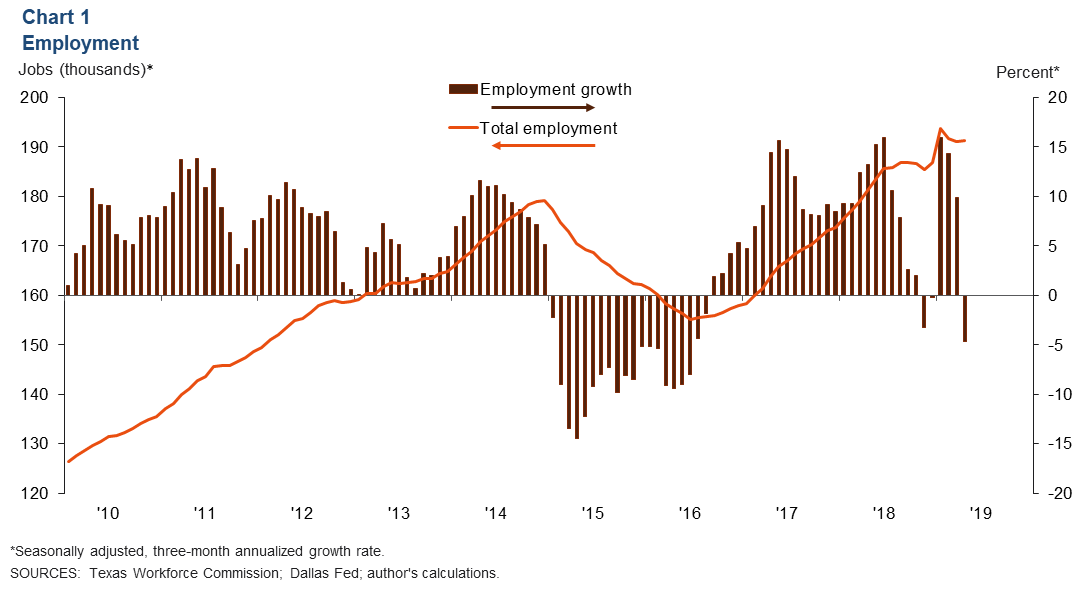
Jobs in the Midland and Odessa metropolitan areas contracted at an annual rate of 4.7 percent over the three months ending in April, compared with 2.4 percent growth in Texas over the same period.
Unemployment Rate Slips Further
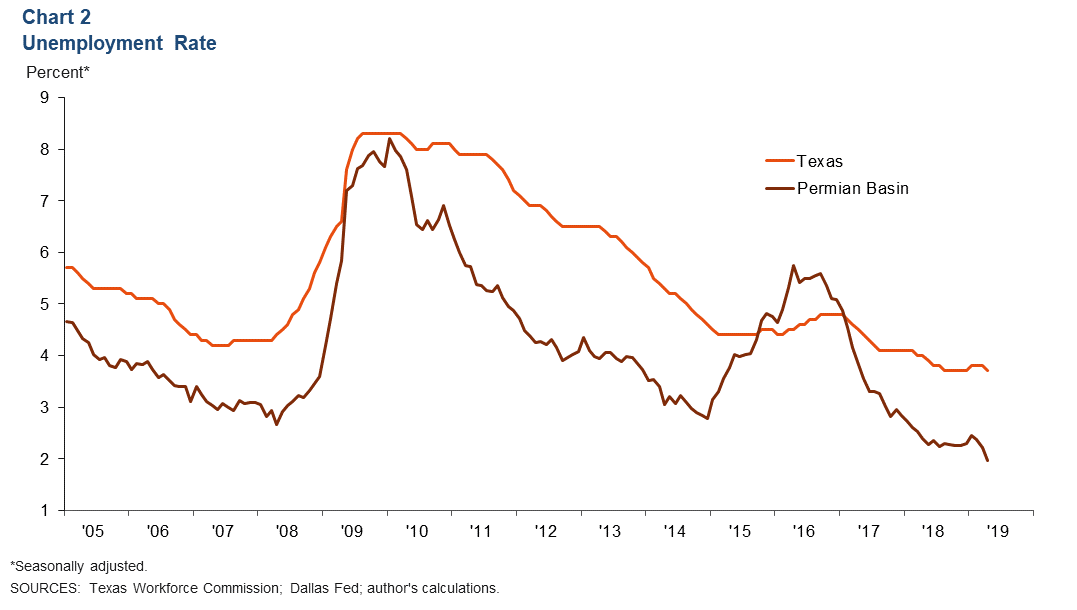
The labor market in the Midland and Odessa metros remains tight. In April, the unemployment rate for the Permian Basin was 2.0 percent, well below the state figure of 3.7 percent (Chart 2).
Energy
West Texas Intermediate Price Slides
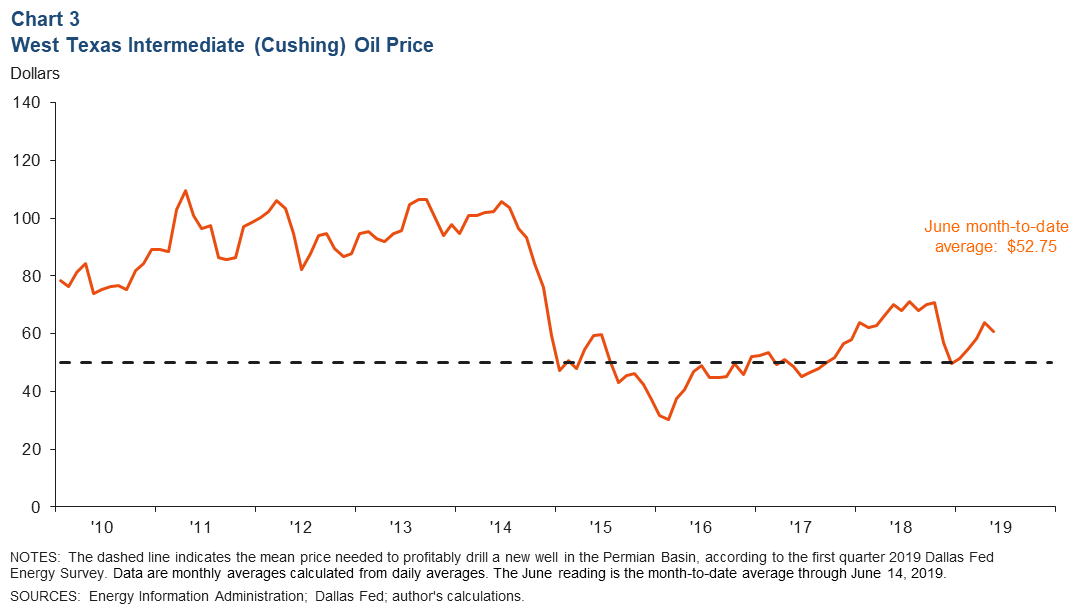
The price of West Texas Intermediate (WTI) has slipped amid concerns of slowing global growth. However, prices remain above the $50 per barrel Dallas Fed Energy Survey respondents say is needed to profitably drill a new well (Chart 3).
Rig Count Declines, Oil Production at Record High
The rig count has declined as the drop in oil prices has impacted drilling activity. The average number of rigs operating in the Permian Basin dropped to 452 in May from 460 in April (Chart 4).
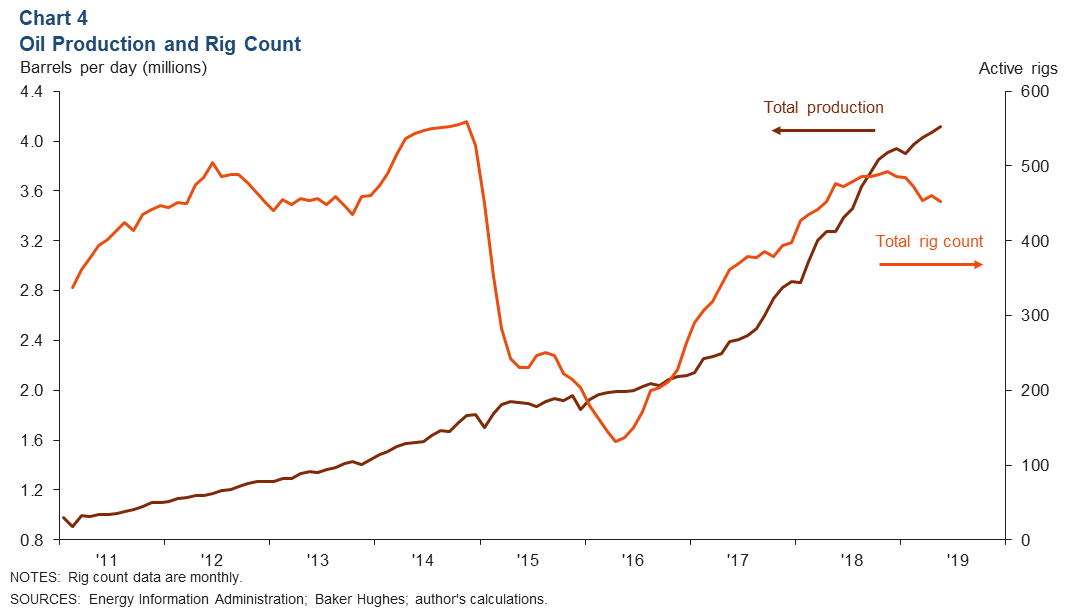
Meanwhile, oil production is at a record high. The Permian Basin produced an average of over 4 million barrels per day of crude oil in May, an increase of 26 percent from a year earlier.
Housing
Inventories Fall
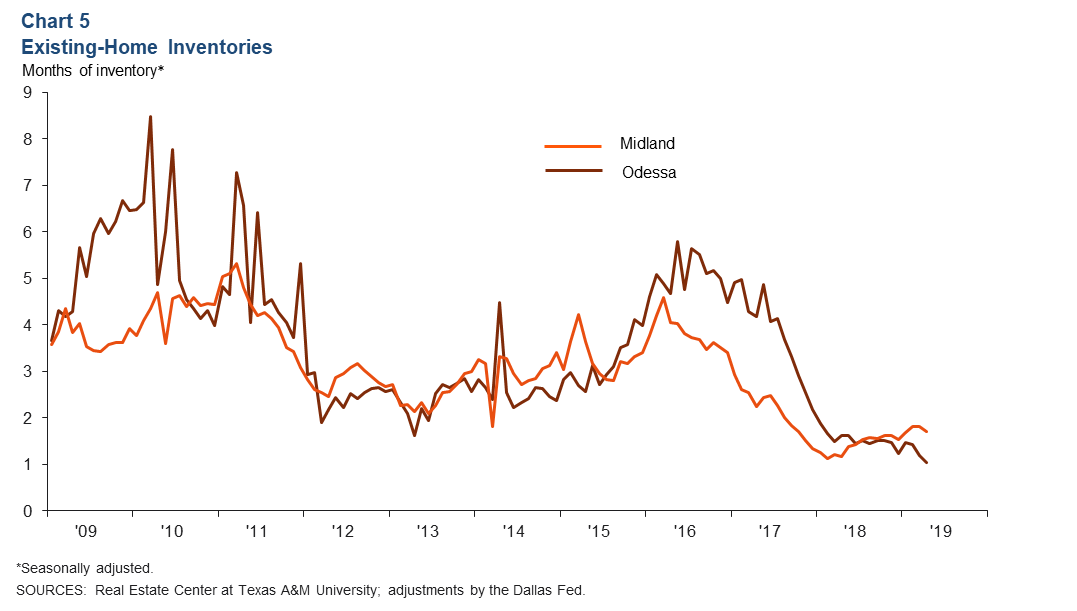
Housing supply remains constrained in the Permian Basin. In April, Odessa’s inventory further tightened and stood at 1.1 months. While inventories in Midland inched up in early 2019, in April they fell to 1.7 months. Inventories in both markets have been below two months since February 2018, well below the six months considered a balanced market (Chart 5).
Home Prices Soar
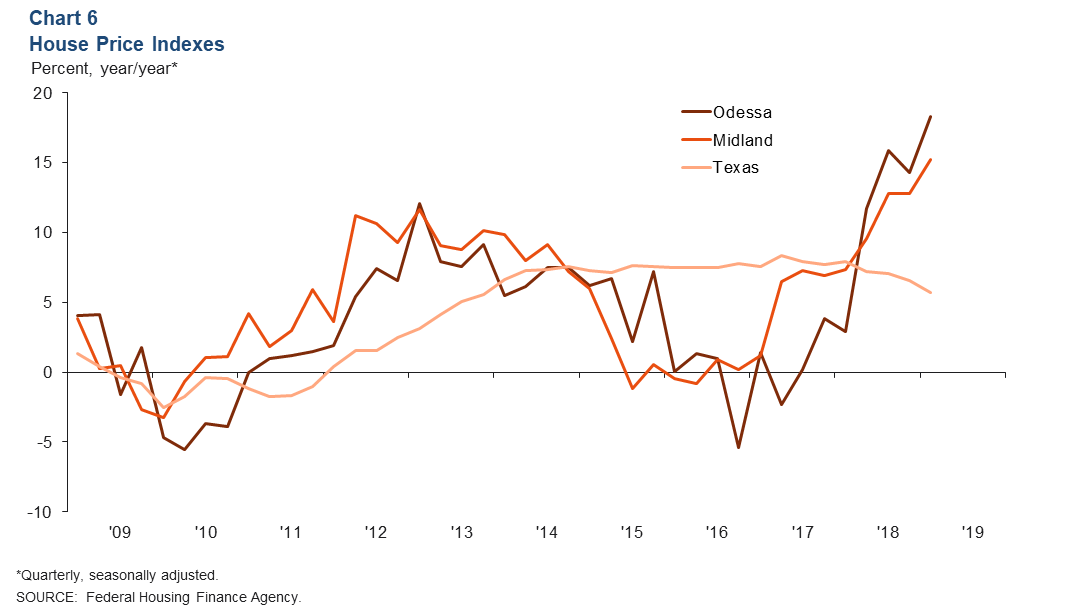
The housing shortage in the Permian Basin has caused home prices to climb. In first quarter 2019, Odessa home prices jumped 18.3 percent from a year earlier, and Midland prices rose 15.2 percent over the same period (Chart 6). Meanwhile, home price gains in Texas are slowing. In first quarter 2019, the state posted a 5.7 percent year-over-year increase in home prices.
NOTES: Employment data are for the Midland–Odessa metropolitan statistical area (Martin, Midland and Ector counties), unless otherwise specified. Energy data includes the 55 counties in West Texas and southern New Mexico that make up the Permian Basin region. Data may not match previously published numbers due to revisions.
About Permian Basin Economic Indicators
Questions can be addressed to Marycruz De León at marycruz.deleon@dal.frb.org. Permian Basin Economic Indicators is released monthly.