Permian Basin Economic Indicators

March 19, 2020
Note: Most of the data included in this release precede the coronavirus (COVID-19) outbreak in the U.S.
Oil prices dropped sharply in early March. Oil production reached new highs in January, and the rig count edged up in February. The labor market has stalled, but wages continue to rise. Existing-home sales have slowed, inventories are on the rise, and prices are stable.
Energy
Oil prices drop
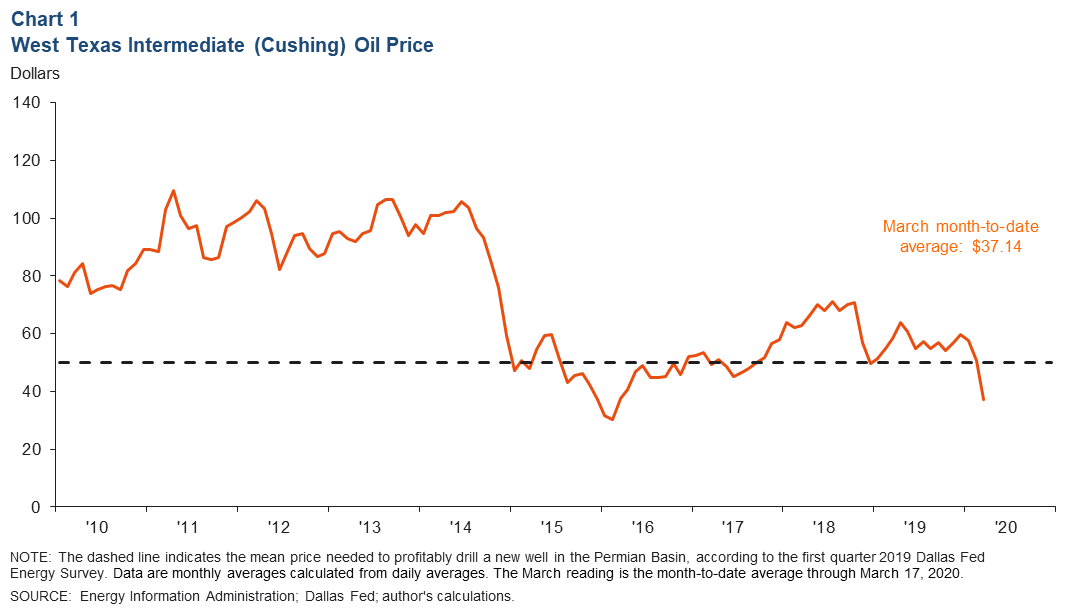
Uncertainty related to the coronavirus and its impact on the global economy continues to hurt oil markets. West Texas Intermediate (WTI) crude plummeted to $37.14 per barrel in March (through March 17), falling over $13 from the February average (Chart 1).In addition, prices have dropped below the $50 per barrel that Dallas Fed Energy Survey respondents say is needed on average to profitably drill a new well.
Oil production climbs
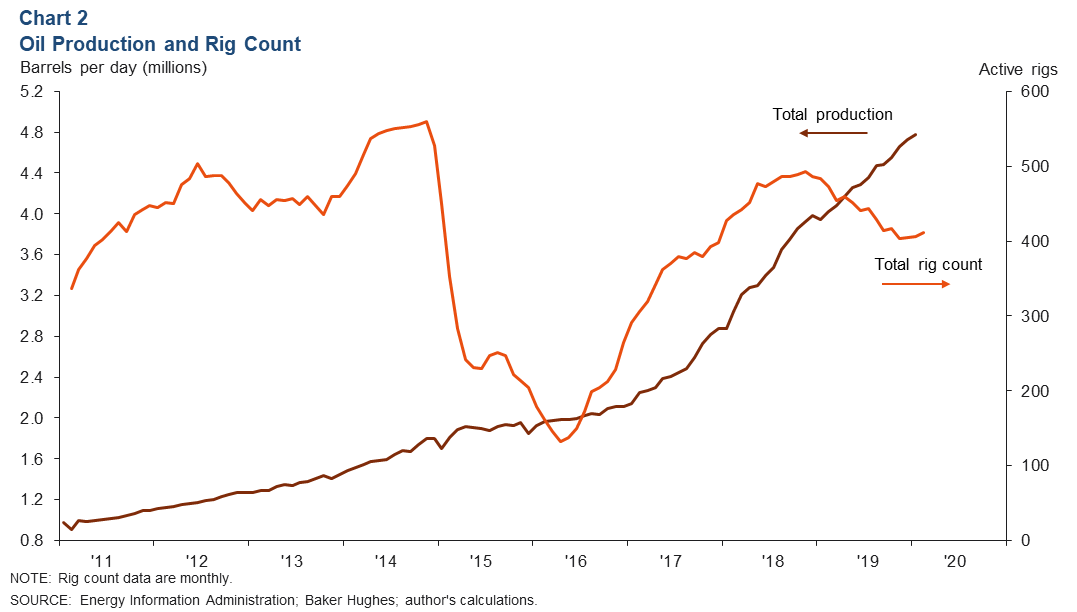
Permian Basin oil production continued to climb in January, with production estimated to have reached an all-time high of 4.8 million barrels per day (Chart 2). Meanwhile, the rig count remains well below its November 2018 peak but inched up from 406 in January to 411 in February.
Labor market
Payrolls stagnate
Permian Basin payrolls have stagnated as the energy slowdown progresses. In January, payrolls were 198,000, nearly unchanged from 197,300 a year earlier (Chart 3).
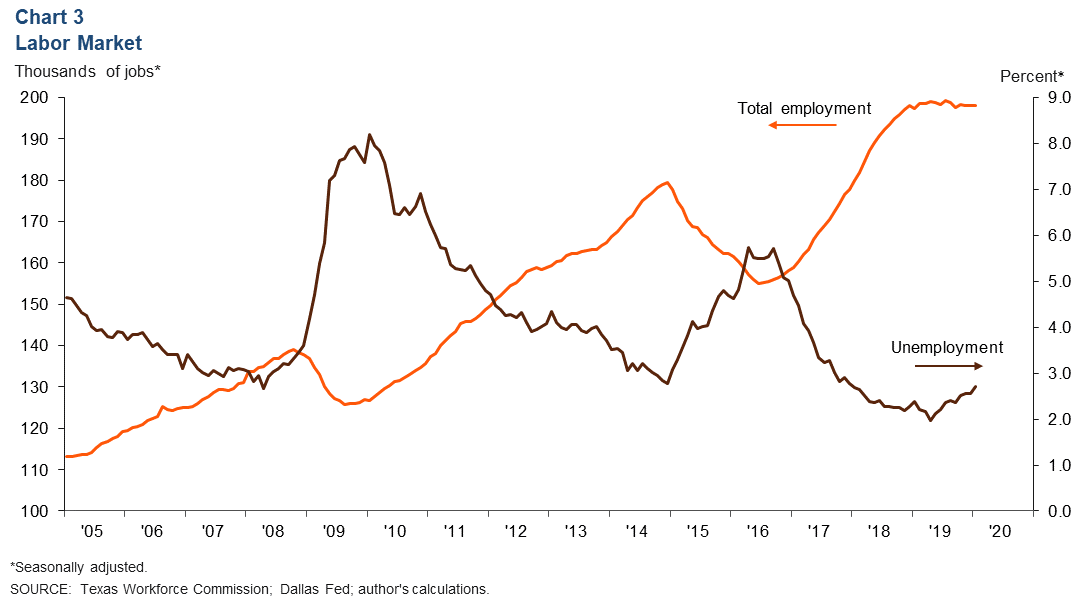
As payroll gains have stalled, the unemployment rate has edged up. In January, the jobless rate was 2.7 percent, up from its most recent low of 2.0 percent in May 2019. Unemployment in the Permian Basin remains below Texas’ 3.5 percent rate.
Permian wages still rising
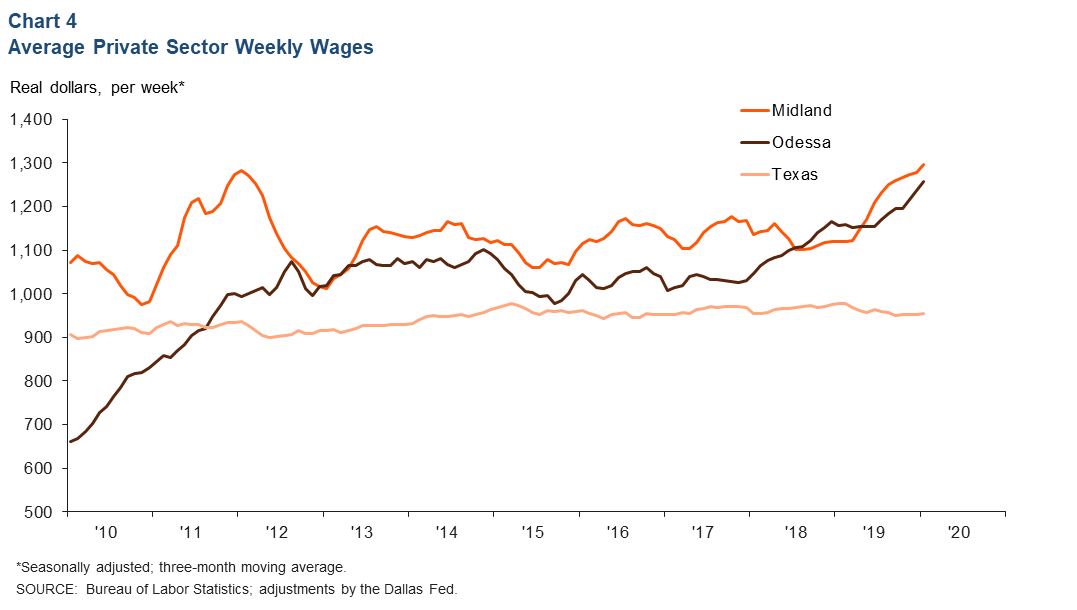
While the unemployment rate has been ticking up, it remains below 3.0 percent. The Permian labor market remains tight, and wages continued to rise through January (Chart 4). Both Midland and Odessa posted record-high weekly wages in January. The average weekly wage in Midland was $1,296—15.8 percent above year-ago levels. The average in Odessa rose 8.6 percent from the prior year to $1,257. Both the Midland and Odessa averages were above the Texas average of $955.
Housing
Housing inventories on the rise
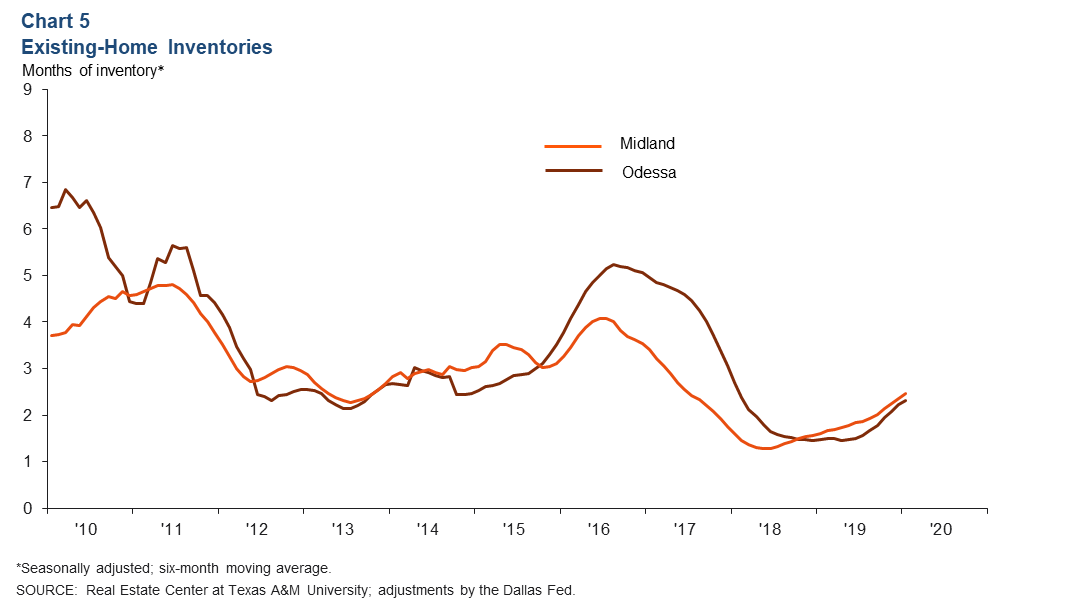
Midland–Odessa’s supply of existing homes continues to grow (Chart 5). The six-month moving average for months of inventory was 2.5 in Midland, above the 1.6 months seen a year earlier. Odessa’s supply was 2.3 months, higher than the 1.5 months in January 2019. While inventories in the Permian Basin continue to rise, the supply of homes remains well below the six months associated with a balanced market.
Home sales slow
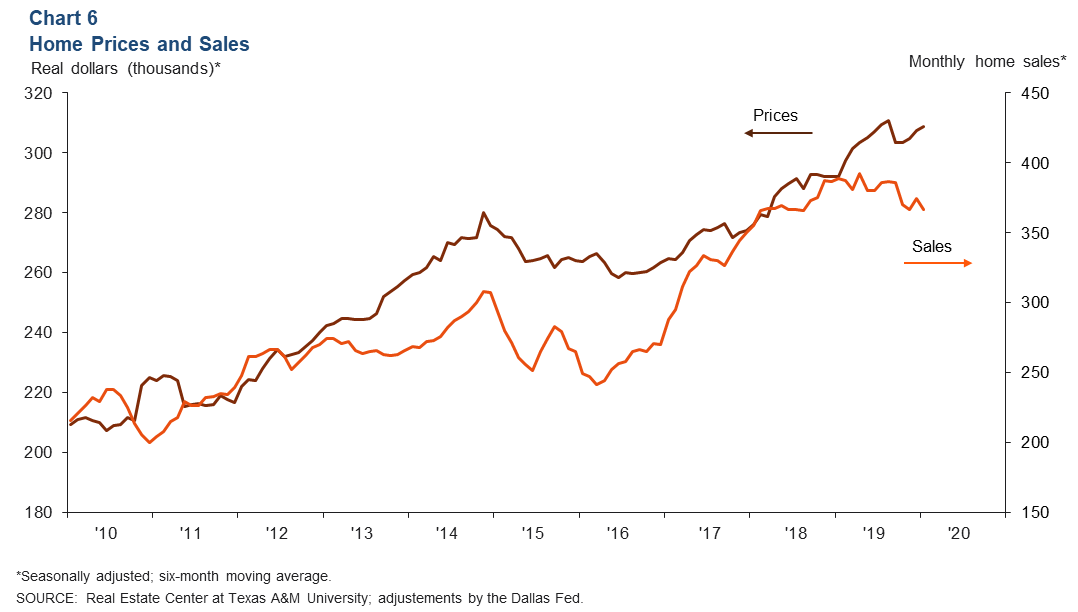
Existing-home sales in Midland and Odessa have slowed since mid-2019. In January, home sales totaled 366 and marked the fifth month of consecutive declines in sales (Chart 6). Meanwhile, the average home price seems to have steadied. In January, the average price was $308,615; the price has drifted between $300,000 and $310,000 since March 2019.
NOTES: Employment data are for the Midland–Odessa metropolitan statistical area (Martin, Midland and Ector counties), unless otherwise specified. Energy data include the 55 counties in West Texas and southern New Mexico that make up the Permian Basin region. Data may not match previously published numbers due to revisions.
About Permian Basin Economic Indicators
Questions or suggestions can be addressed to Kenya Schott at kenya.schott@dal.frb.org. Permian Basin Economic Indicators is released quarterly.